Sample Category Title
GBP/USD Daily Outlook
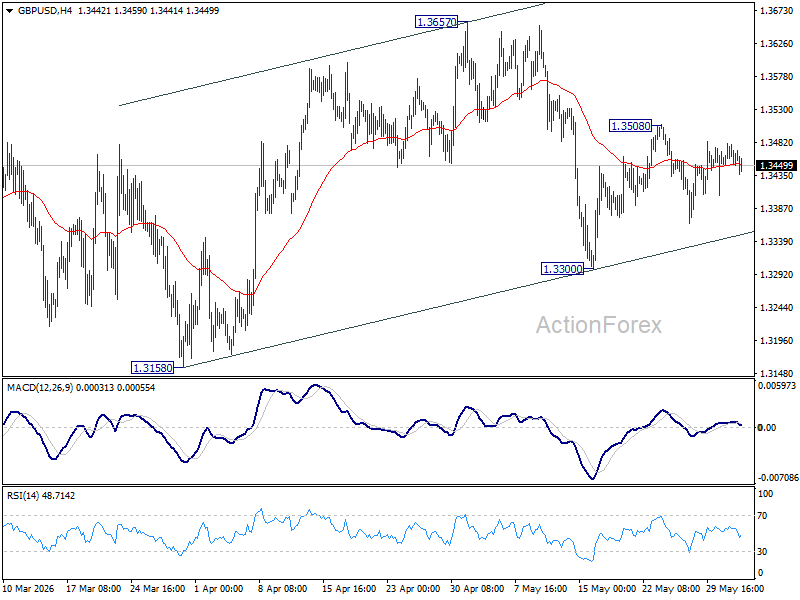
Outlook is unchanged in GBP/USD as range trading continues. Intraday bias remains neutral for the moment. On the upside, above 1.3508 will extend the rebound from 1.3300 to 1.3657 resistance first. On the downside, below 1.3300 will bring deeper fall back to 1.3158 support instead.
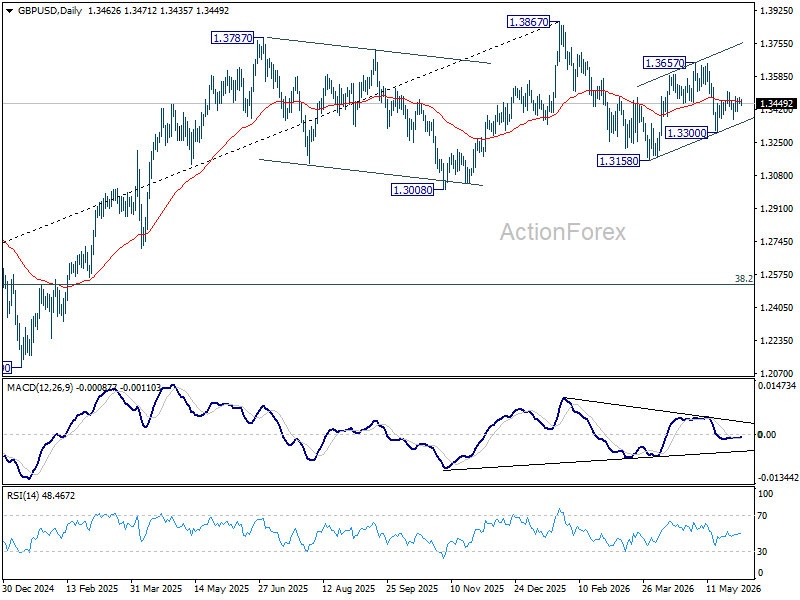
In the bigger picture, price actions from 1.3867 are a corrective pattern within the broader up trend from 1.0351 (2022 low). With 1.3008 support intact, medium term bullishness is maintained and break of 1.3867 is in favor for a later stage, towards 1.4248 key resistance (2021 high). However, firm break of 1.3008 will at least bring deeper fall to 38.2% retracement of 1.0351 to 1.3867 at 1.2524, with increased risk of bearish reversal.
USD/CHF Daily Outlook
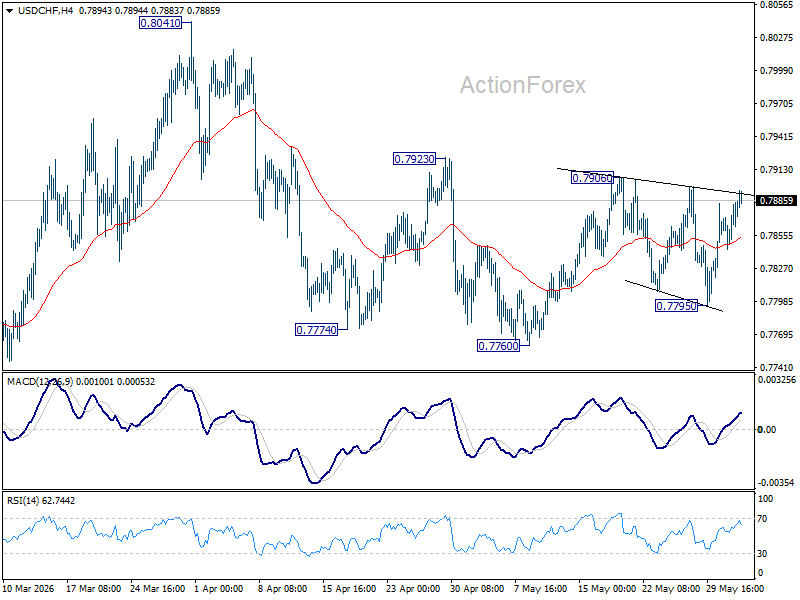
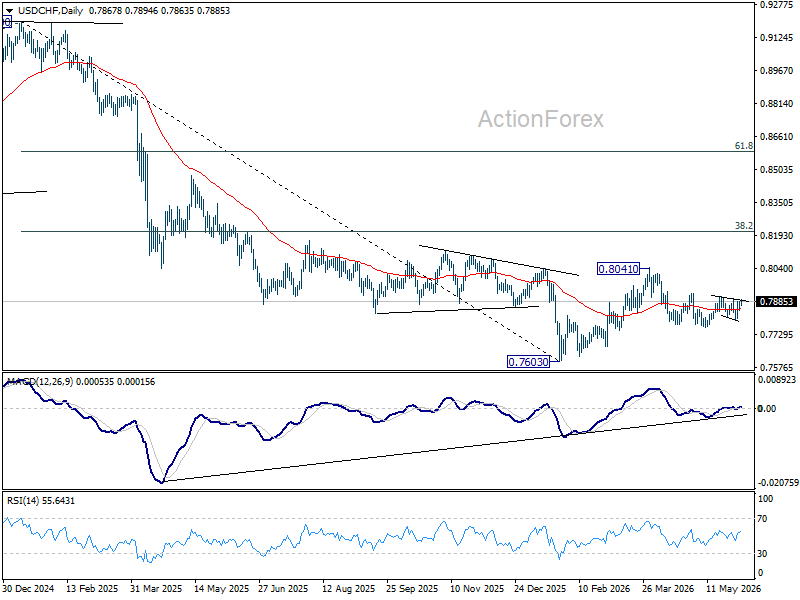
USD/CHF is staying in range below 0.7906 and intraday bias is remains neutral. On the upside, firm break of 0.7906 will resume the rebound from 0.7760 to retest 0.8041. On the downside, below 0.7795 will bring deeper fall to 0.7760 support instead.
In the bigger picture, as long as 55 W EMA (now at 0.8028) holds, fall from 0.9200 is expected to continue, as part of the larger down trend. Firm break of 0.7603 will target 100% projection of 1.0146 (2022 high) to 0.8332 from 0.9200 at 0.7382.
AUD/USD Daily Report
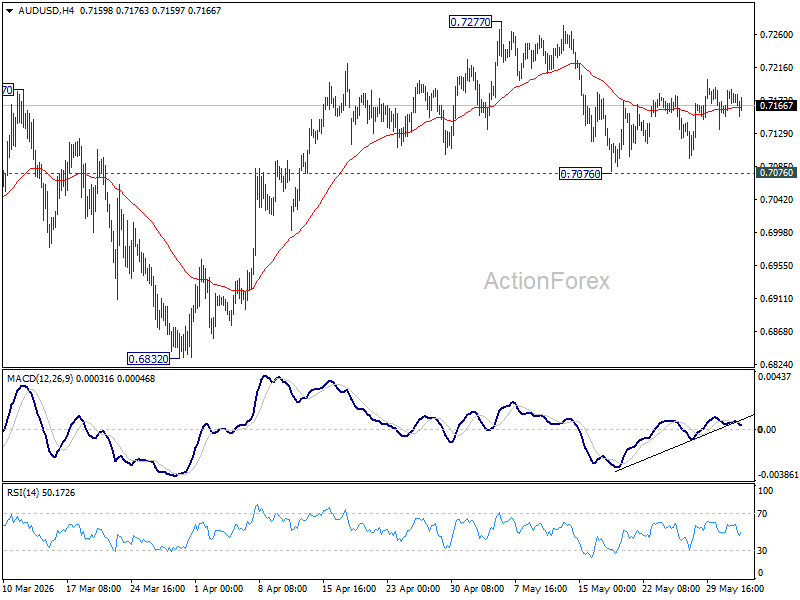
Intraday bias in AUD/USD is turned neutral first with current retreat. Outlook will remain mildly bullish as long as 0.7076 support holds. Firm break of 0.7277 will resume larger up trend. However, sustained break of 0.7076 will bring deeper fall back towards 0.6832 support instead.
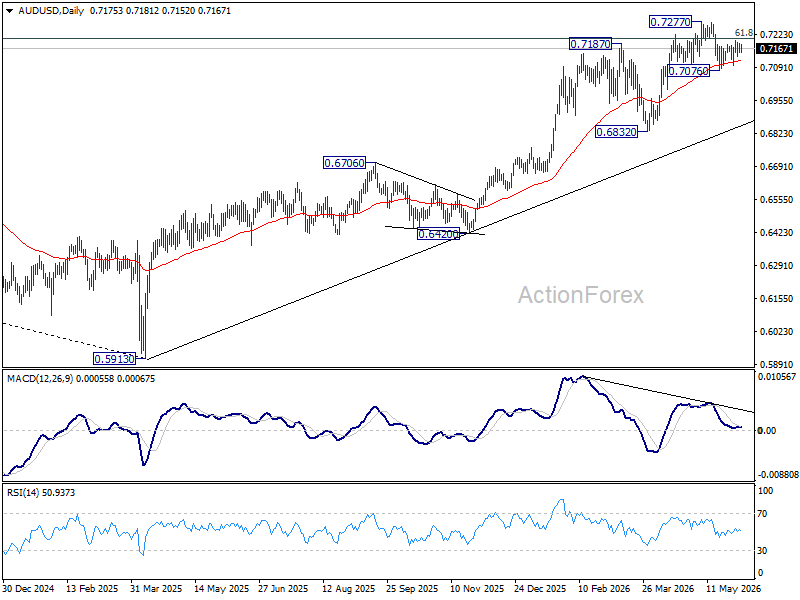
In the bigger picture, rise from 0.5913 (2024 low) is still in progress. Decisive break of 61.8% retracement of 0.8006 to 0.5913 at 0.7206 will solidify the case that it's already reversing the down trend from 0.8006 (2021 high). Further rally should then be seen to retest 0.8006. For now, outlook will remain bullish as long as 0.6832 support holds, in case of pullback.
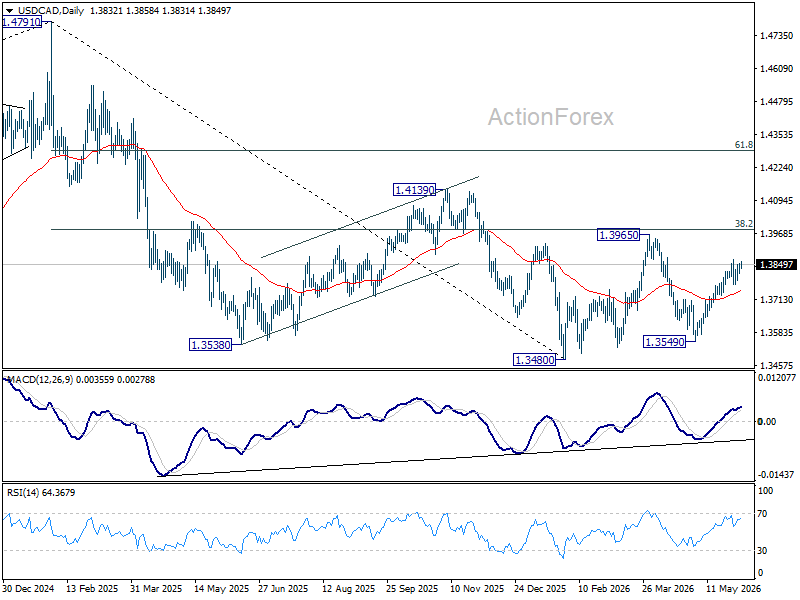
USD/CAD Daily Outlook
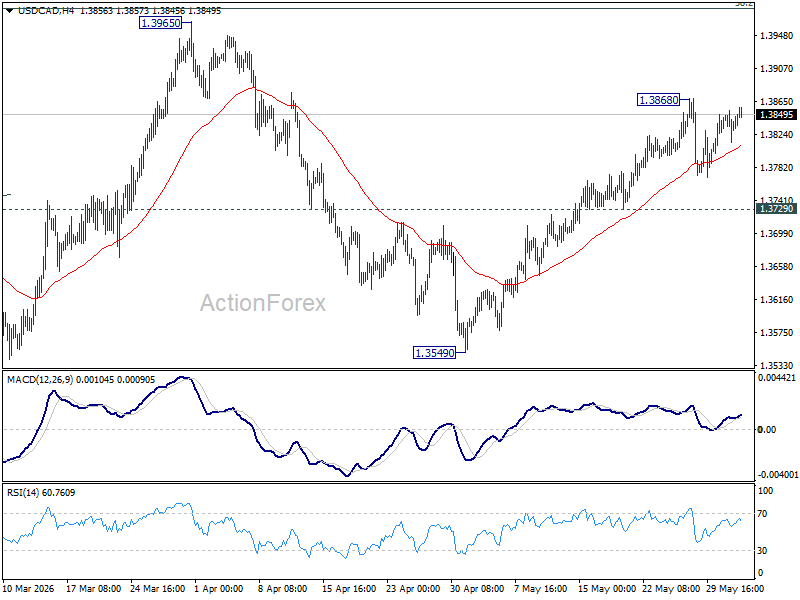
Intraday bias in USD/CAD stays neutral at this point, as consolidations continue below 1.3868. Further rise expected as long as 1.3729 support holds. Rally from 1.3549 is seen as the third leg of the pattern from 1.3480. Above 1.3868 will target 1.3965 resistance next. Break of 1.3729 will suggest that the rebound has completed, and turn bias back to the downside.
In the bigger picture, price actions from 1.4791 are seen as a corrective pattern to the whole up trend from 1.2005 (2021 low). Deeper fall could be seen, as the pattern extends, to 61.8% retracement of 1.2005 to 1.4791 at 1.3069. However, decisive break of 38.2% retracement of 1.4791 to 1.3480 at 1.3981 will argue that the correction has completed with three waves down to 1.3480 already.
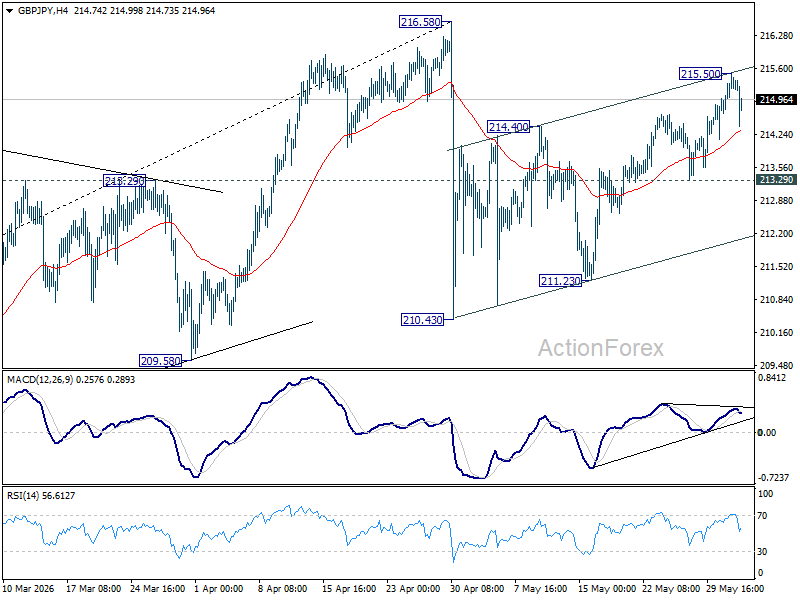
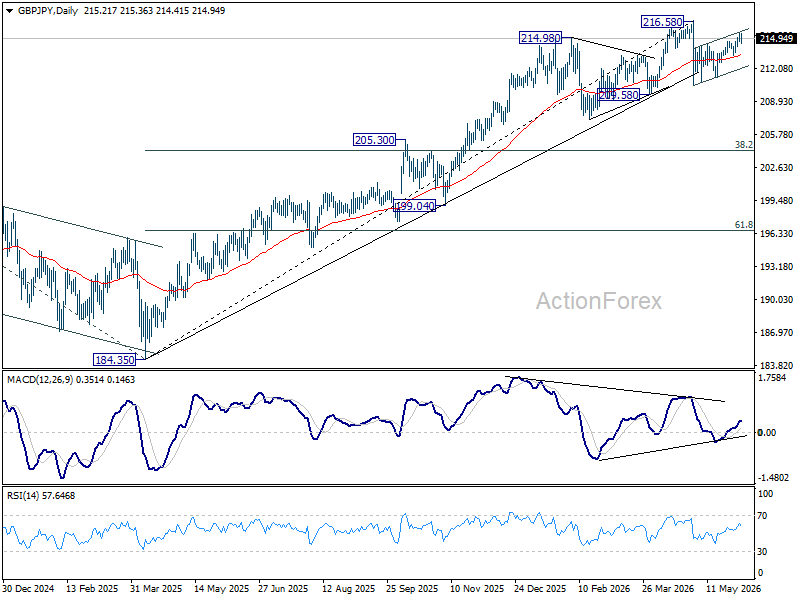
GBP/JPY Daily Outlook
Intraday bias in GBP/JPY is turned neutral first with current retreat. Further rise is expected as long as 213.29 support holds. Above 215.50 will resume the rebound from 210.43 to retest 216.58 high. Strong resistance should be seen there to cap upside, at least on first attempt.
In the bigger picture, while the fall from 216.58 is steep, there is no clear sign of trend reversal yet. The long term up trend could still extend to 61.8% projection of 148.93 (2022 low) to 208.09 (2024 high) from 184.35 at 220.90 on resumption. However, sustained break of 55 W EMA (now at 206.56) will argue that it's already in medium term down trend for 184.35 support.
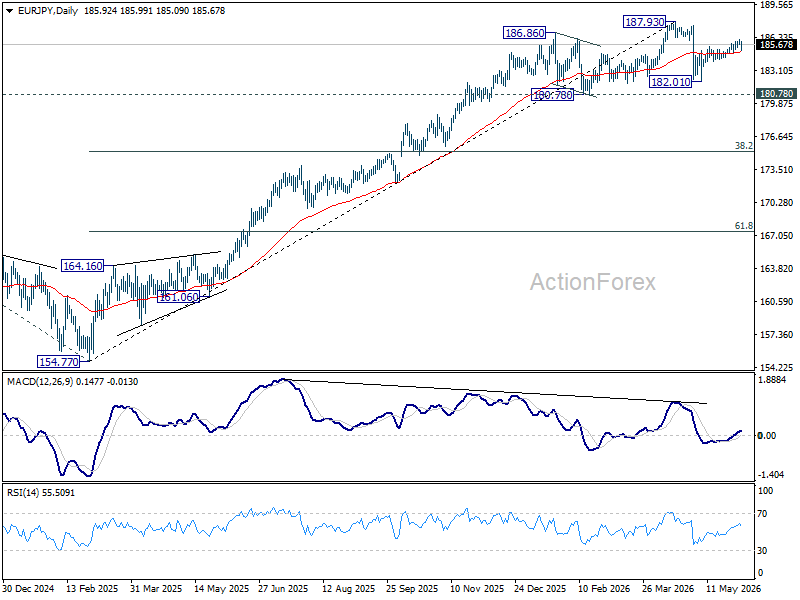
EUR/JPY Daily Outlook
Intraday bias in EUR/JPY is turned neutral first with current retreat. Further rise is expected as long as 184.42 support holds. Above 186.18 will extend the rebound from 182.01. Firm break of 61.8% projection of 182.01 to 185.44 from 184.42 at 186.53 will pave the way to 100% projection at 187.85.
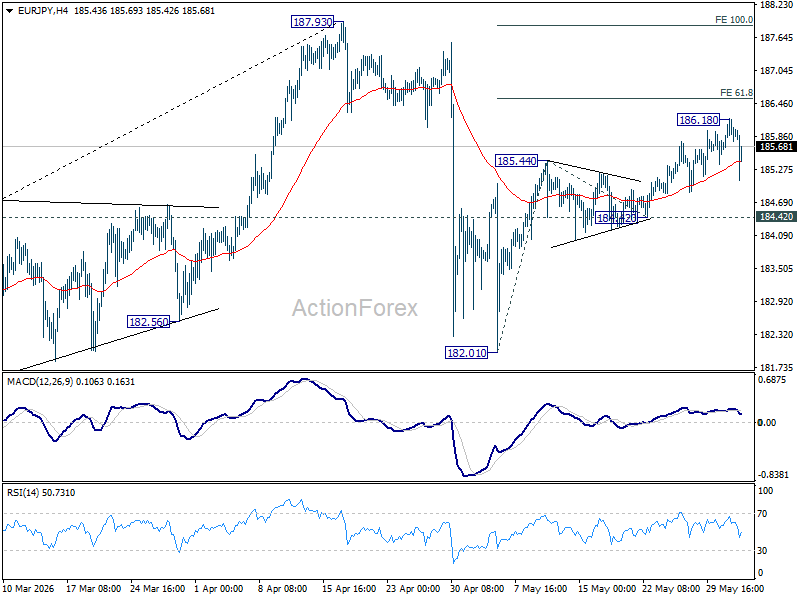
In the bigger picture, the pullback from 187.93 was steep, there is no sign of reversal yet. Uptrend from 114.42 (2020 low) is still expected to resume at a later stage to 78.6% projection of 124.37 (2022 low) to 175.41 (2025 high) from 154.77 at 194.88. However, sustained break of 55 W EMA (now at 178.78) will argue that it's already in a medium term down trend to 175.41 resistance turned support and below.
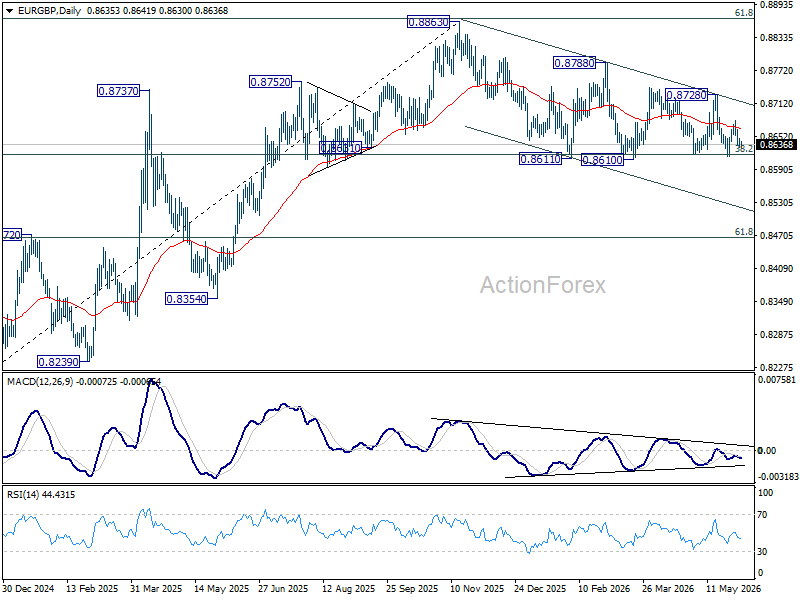
EUR/GBP Daily Outlook
Intraday bias in EUR/GBP remains neutral and outlook is unchanged. On the downside, decisive break of 0.8610 support will revive the case of bearish trend reversal. On the upside, break of 0.8728 resistance will bring stronger rally back to 0.8788 resistance and above.
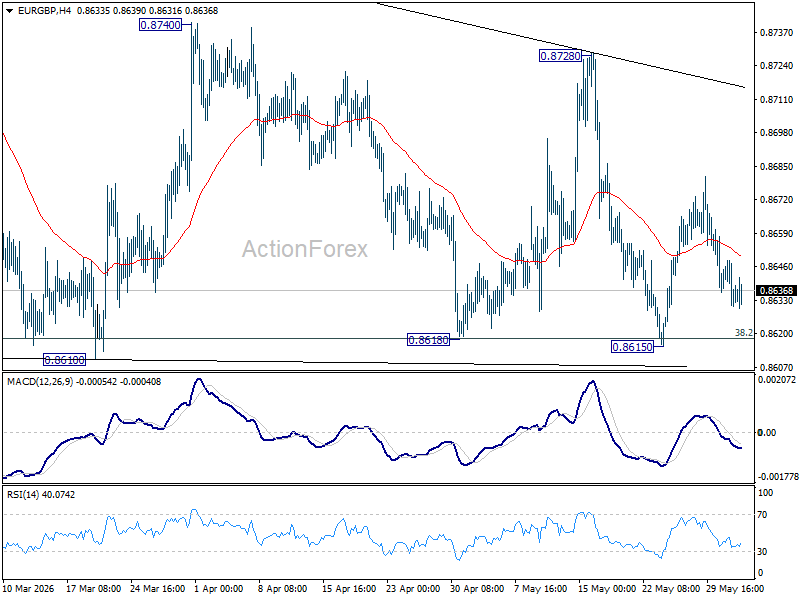
In the bigger picture, focus is staying on 38.2% retracement of 0.8821 to 0.8863 at 0.8618. Strong rebound from there will retain medium term bullishness. Rise from 0.8221 should resume through 0.8863 at a later stage. Nevertheless, sustained break of 0.8618 will confirm that whole rise from 0.8221 has completed at 0.8863. Deeper decline should then be seen to 61.8% retracement at 0.8466 at least.
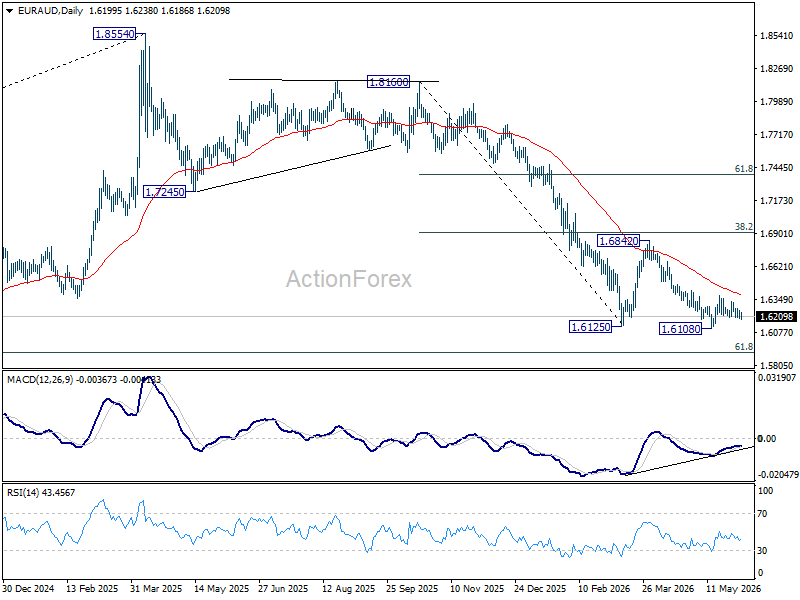
EUR/AUD Daily Outlook
No change in EUR/AUD's outlook as it's still bounded in range trading. Intraday bias stays neutral first. Rise from 1.6108 is seen as the third leg of the corrective pattern from 1.6125. Above 1.6381 will bring stronger rebound back towards 1.6842 resistance. Nevertheless, firm break of 1.6108 will resume the larger down trend from 1.8554.
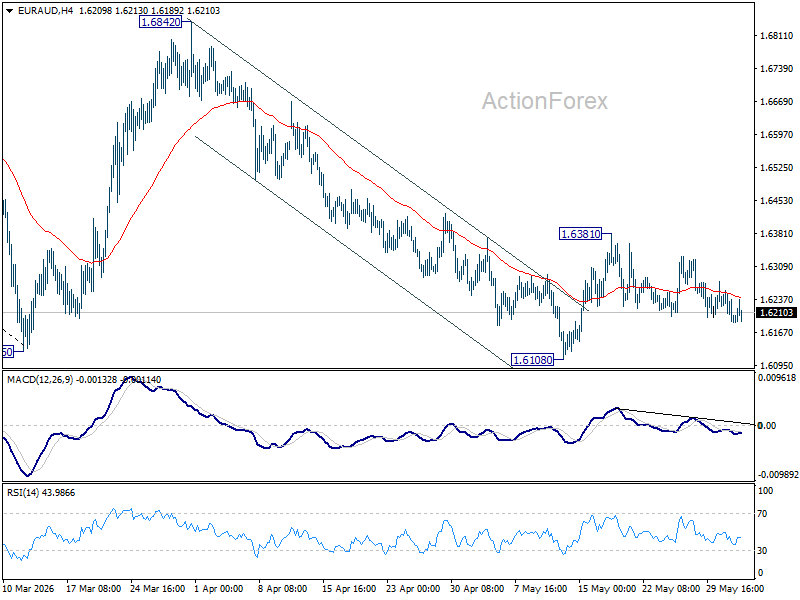
In the bigger picture, fall from 1.8554 (2025 high) is in progress and deeper decline should be seen to 61.8% retracement of 1.4281 to 1.8554 at 1.5913, which is slightly below 1.5963 structural support. Decisive break there will pave the way back to 1.4281 (2022 low). For now, risk will stay on the downside as long as 55 W EMA (now at 1.6956) holds, even in case of strong rebound.
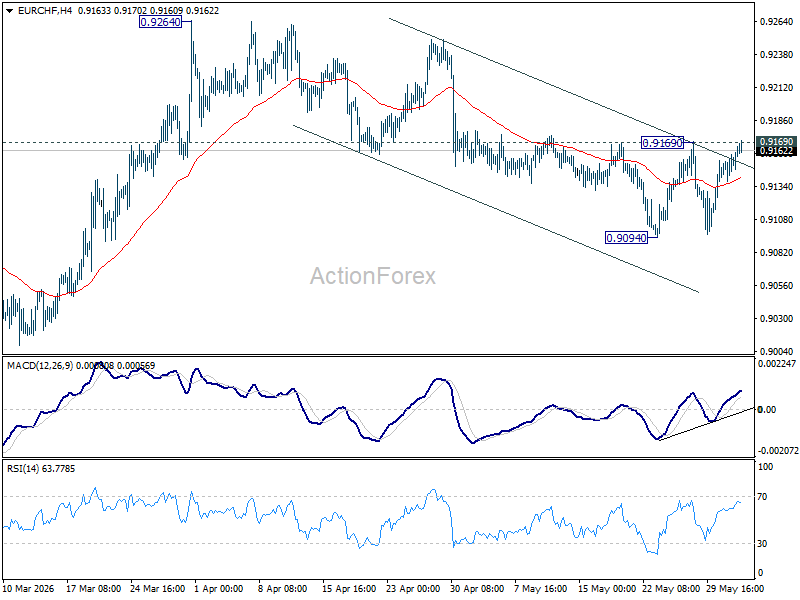
EUR/CHF Daily Outlook
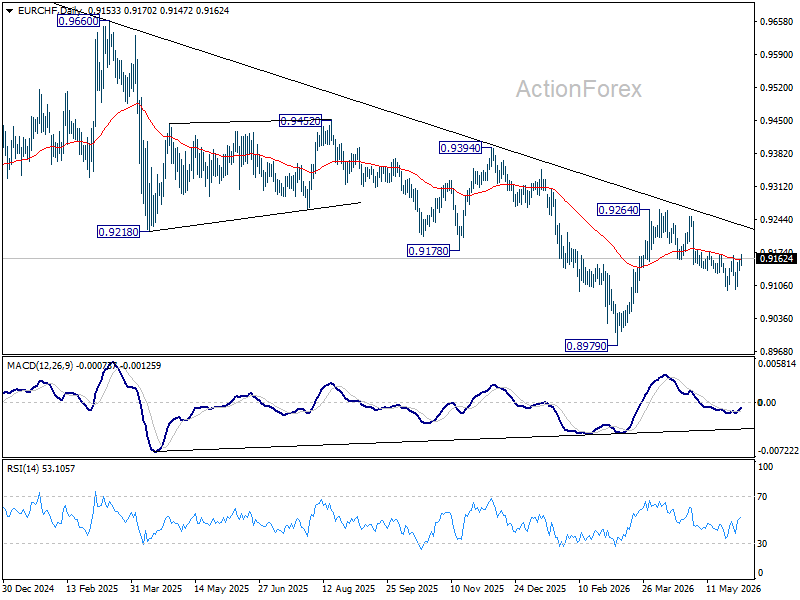
EUR/CHF is still limited by 0.9169 resistance and intraday bias remains neutral. On the downside, firm break of 0.9094 will resume the decline from 0.9264 to retest 0.8979 low. On the upside, however, decisive break of 0.9169 will argue that the pullback has completed, and turn bias back to the upside for 0.9264.
In the bigger picture, the rejection by 55 W EMA (now at 0.9252) suggests that the down trend from 0.9928 (2024 high) is still in progress. Firm break of 0.8979 will confirm down trend resumption. Outlook will stay bearish as long as 0.9394 resistance holds, in case of another rebound.
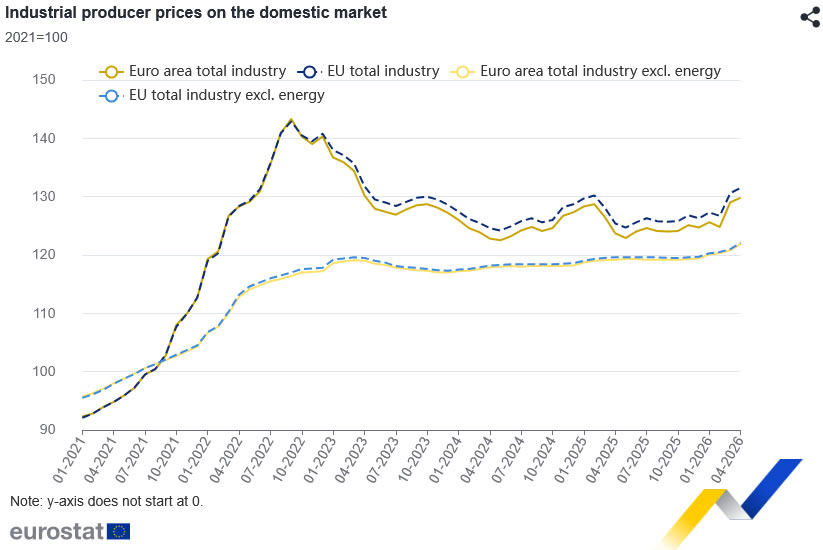
Eurozone PPI Jumps 0.6% mom, 4.9% yoy as Pipeline Inflation Pressures Build
Eurozone producer prices rose more than expected in April, adding to evidence that inflation pressures are continuing to build beneath the surface of the economy. Producer Price Index increased 0.6% mom, above expectations of 0.4% mom. Annual producer inflation accelerated sharply from 2.0% yoy to 4.9% yoy, slightly above forecasts of 4.8% yoy. The figures come just a day after stronger-than-expected Eurozone inflation data reinforced expectations for an ECB rate hike next week.
The details suggest inflationary pressures are becoming increasingly broad-based in Eurozone. Intermediate goods prices rose 1.8% mom on the month, indicating higher costs are continuing to move through supply chains. Capital goods and durable consumer goods prices both increased 0.3%, while non-durable consumer goods prices were unchanged. Energy prices actually fell -0.4% during the month, implying that the acceleration in producer inflation was not solely driven by energy costs.
Across the European Union, producer prices rose 0.7% mom and 4.9% yoy. Denmark, Croatia, and Belgium recorded the largest monthly increases, while France, Estonia, and Sweden saw declines.
| Indicator | March | April | Expectation |
|---|---|---|---|
| Eurozone PPI M/M | 3.4% | 0.6% | 0.4% |
| Eurozone PPI Y/Y | 2.0% | 4.9% | 4.8% |
| EU PPI M/M | 0.7% | ||
| EU PPI Y/Y | 4.9% |
Eurozone PPI Components (M/M)
| Component | April |
|---|---|
| Intermediate Goods | +1.8% |
| Capital Goods | +0.3% |
| Durable Consumer Goods | +0.3% |
| Non-Durable Consumer Goods | 0.0% |
| Energy | -0.4% |
Largest Monthly Changes by Country
| Country | PPI M/M |
|---|---|
| Denmark | +3.0% |
| Croatia | +2.7% |
| Belgium | +2.4% |
Largest Monthly Declines by Country
| Country | PPI M/M |
|---|---|
| France | -2.1% |
| Estonia | -0.8% |
| Sweden | -0.3% |