Sample Category Title
Hammack Warns Fed May Need to Act Soon as Inflation Moves Higher
Federal Reserve Bank of Cleveland President Beth Hammack delivered one of the more hawkish messages from a Fed official in recent weeks, warning that inflation risks are becoming increasingly difficult to ignore. While she stopped short of advocating an immediate rate hike, Hammack said the central bank may need to respond if current inflation trends persist. "If recent trends continue, it may soon be appropriate to act," she said, even as she acknowledged that holding rates steady for now remains a reasonable course.
A key concern for Hammack is that inflation pressures are broadening rather than fading. She argued that "inflation is too high and is moving higher," pointing to rising costs across goods and services as well as higher energy prices stemming from disruptions linked to the Iran conflict. According to Hammack, "there is a growing risk that inflation could remain elevated" if businesses continue passing higher costs through to consumers. She also questioned whether current policy settings are restrictive enough, saying she is increasingly concerned that monetary policy "may not be sufficiently restrictive to bring inflation down to 2 percent."
The remarks suggest that inflation has once again become the dominant concern inside parts of the Fed. Hammack explicitly said she is "more concerned about the growing risks of persistently elevated inflation than the risks to full employment," a notable statement given recent debates about growth and labor market conditions. With unemployment still near full-employment levels and financial conditions supportive of activity, the hurdle for discussing rate cuts remains extremely high. Instead, markets may need to pay closer attention to the possibility that the Fed's next move, while not imminent, could eventually be another hike.
Yen Nears 160 Again as Markets Demand More Than a Token BoJ Hike
The Japanese Yen is once again approaching the intervention red line around 160 per dollar, despite growing confidence that the Bank of Japan will raise interest rates later this month. Overnight index swaps are currently pricing around an 80% probability of a June rate hike from 0.75% to 1.00%. Under normal circumstances, the prospect of tighter monetary policy would be expected to support the currency. Instead, Yen is among the weakest major currencies, highlighting a market that is looking beyond the next BoJ move.
The problem is not whether the BoJ hikes. It is what comes after. A 25 basis point increase would do little to close the enormous yield gap between Japan and the rest of the world, particularly while the Middle East conflict continues to keep energy prices elevated and inflation concerns alive globally. As long as oil prices sustain upward pressure on global bond yields, a move to 1.00% is unlikely to materially change the attractiveness of Yen-funded carry trades. Markets want a clearer roadmap for policy normalization rather than a single rate hike.
That demand for clarity is becoming more vocal within Japan itself. Sumitomo Mitsui Financial Group's global markets chief Arihiro Nagata told Reuters that the BoJ "should raise interest rates in June, and I expect it will – surely this time." However, he argued that the key issue for the June 15-16 meeting is how clearly policymakers communicate their path toward normalization. Nagata's concern is not merely about interest rates but about reducing uncertainty and allowing markets to price future policy without fear of sudden disruptions.
Former BoJ board member Makoto Sakurai went even further. Warning that inflation pressures are broadening because of the Iran war, he argued that "stagflation is inevitable" and that "forgoing a rate hike in June is unthinkable." Sakurai cautioned that delaying action could force the central bank into a much more aggressive tightening cycle later, saying Japan is "only a step away from repeating the mistake that led to Japan's lost decades."
Meanwhile, broader markets remain trapped in a wait-and-see mode as uncertainty over US-Iran negotiations continues. Reports from Iran suggest a proposed agreement is still under review, while US President Donald Trump insists talks are continuing. Brent crude slipped back below 95 dollars on hopes diplomacy remains alive, but there is little conviction behind the move. Investors are still waiting for a definitive answer on whether a deal will emerge or fail.
For Yen traders, that uncertainty matters. If elevated oil prices continue to keep global yields high, even a June BoJ hike may struggle to prevent another test of 160. Japan spent ¥11.7 trillion defending that level only a month ago. The market now appears willing to ask whether authorities are prepared to do it again.
Stronger Eurozone Inflation Gives EUR/CAD a Floor. But Can It Break the Ceiling?
The ECB's June rate hike is increasingly becoming a certainty after Eurozone core inflation surprised to the upside. That should keep EUR/CAD supported on dips, but the real challenge comes afterward. With markets already pricing another ECB move and oil prices still influencing the Canadian Dollar, breaking above major resistance may require more than next week's hike alone. Read More.
Eurozone CPI Rises to 3.2%, Core Inflation Tops Forecasts
The ECB has spent weeks preparing markets for a rate hike, and May's inflation data may have just validated that strategy. Core inflation exceeded forecasts and services prices accelerated sharply, suggesting price pressures are spreading beyond energy alone. Read More.
Gold's 4,400-4,600 Standoff To Be Decided by the Next Iran Headline
Gold is caught between two competing narratives. Reports that Iran could halt talks and threaten Hormuz initially challenged the peace trade, but Trump's insistence that negotiations are continuing prevented a broader market shift. With oil still below key resistance and Gold trapped between 4,400 and 4,600, the next major move may depend on whether diplomacy regains momentum or breaks down completely. Read More.
RBA's Harper Warns Rising Inflation Expectations Could Require "Strong Action"
Higher oil prices, rising wage pressures, and persistent inflation expectations are keeping the RBA on alert. Ian Harper's latest comments reinforce that policymakers remain focused on preventing inflation from becoming embedded in the economy. Read More.
Australia Approves Stronger Wage Rise as RBA Monitors Second-Round Effects
Australia's Fair Work Commission has delivered a 4.75% increase in minimum and award wages, affecting more than one in five workers. While the direct impact on inflation is expected to be small, the bigger question is whether the decision becomes a benchmark for wage negotiations across the broader economy. That risk could keep the RBA focused on inflation expectations even as growth and labor market conditions soften. Read More.
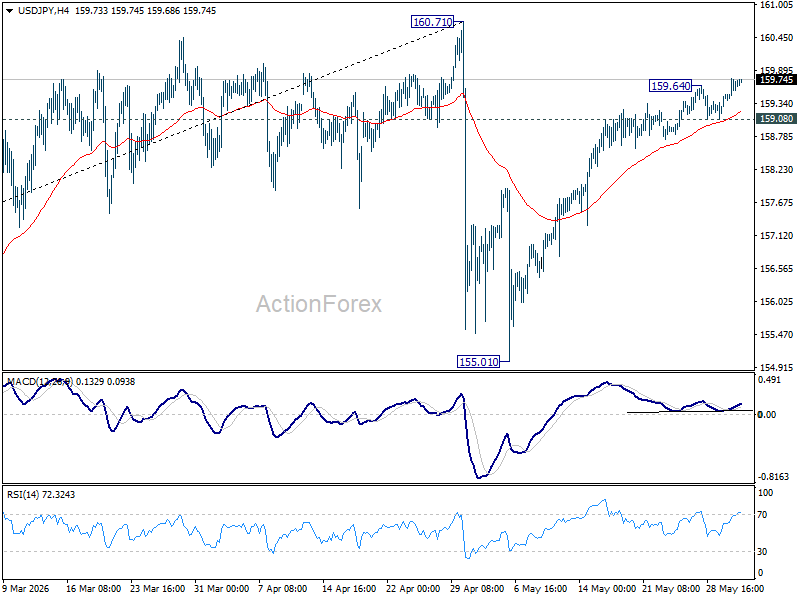
USD/JPY Daily Outlook
Intraday bias in USD/JPY is back on the upside with break of 159.64 temporary top. Rise from 155.01 should continue to retest 160.71 high. Strong resistance should be seen there to bring reversal. On the downside, break of 159.08 minor support will turn intraday bias neutral first.
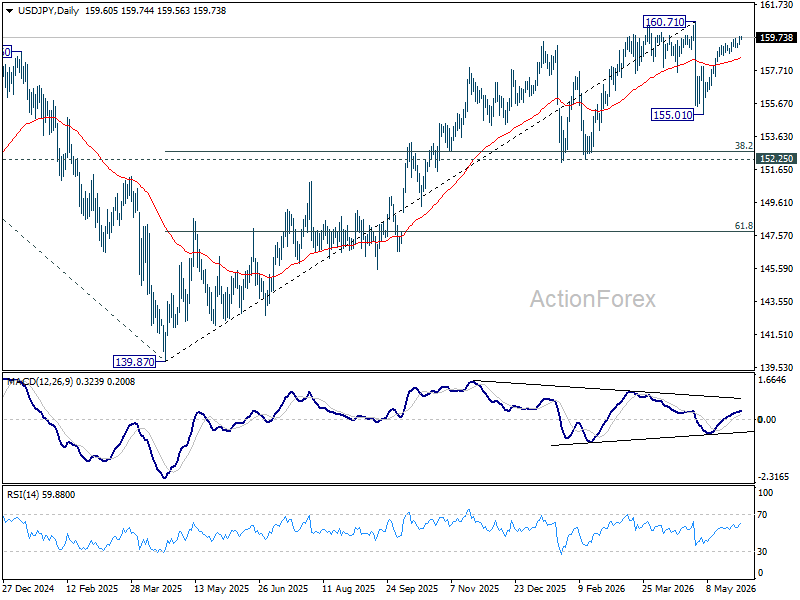
In the bigger picture, for now, corrective pattern from 161.94 (2024 high) is still seen as completed at 139.87. Rise from there is seen as resuming the long term up trend. So, break of 161.94 is expected at a later stage to resume the long term up trend. However, sustained break of 55 W EMA (now at 154.55) will dampen this view and bring deeper fall back towards 139.87 to extend the pattern from 161.94.
EUR/USD Daily Outlook
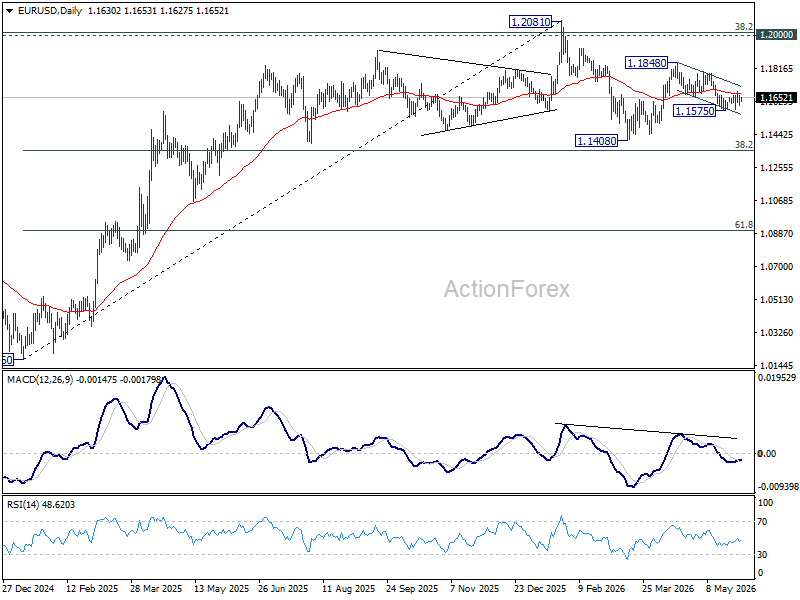
Intraday bias in EUR/USD is turned neutral first with current retreat. On the downside, break of 1.1575 support will resume the fall from 1.1848 to retest 1.1408 low. Above 1.1865 will target 1.1795 resistance. Firm break there will argue that rise from 1.1408 is ready to resume through 1.1848.
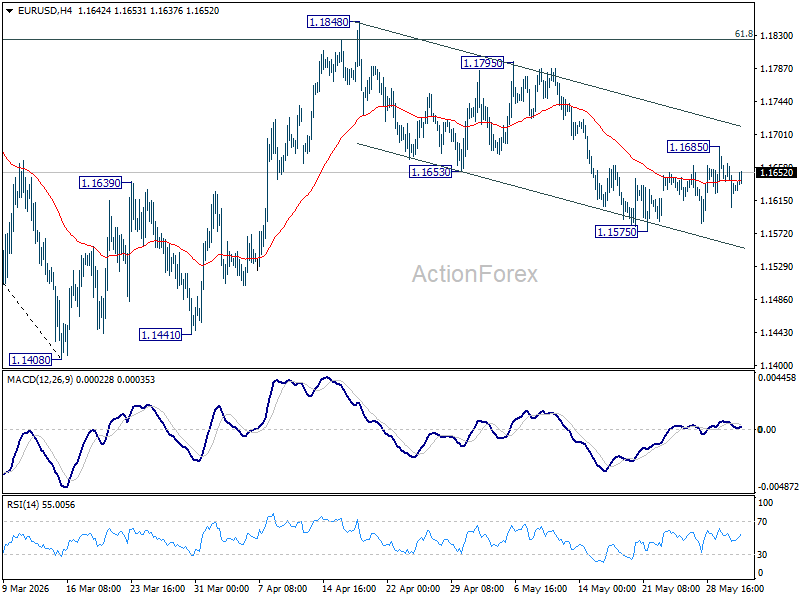
In the bigger picture, the strong support from 38.2% retracement of 1.0176 to 1.2081 at 1.1353 suggests that the pullback from 1.2081 is more likely a corrective move. Strong support was also found in 55 W EMA (now at 1.1542). Focus is back on 1.2 key cluster resistance level. Decisive break there will carry long term bullish implications. Nevertheless, break of 1.1408 support will revive the case of medium term bearish trend reversal.
USD/JPY Daily Outlook
Intraday bias in USD/JPY is back on the upside with break of 159.64 temporary top. Rise from 155.01 should continue to retest 160.71 high. Strong resistance should be seen there to bring reversal. On the downside, break of 159.08 minor support will turn intraday bias neutral first.
In the bigger picture, for now, corrective pattern from 161.94 (2024 high) is still seen as completed at 139.87. Rise from there is seen as resuming the long term up trend. So, break of 161.94 is expected at a later stage to resume the long term up trend. However, sustained break of 55 W EMA (now at 154.55) will dampen this view and bring deeper fall back towards 139.87 to extend the pattern from 161.94.
GBP/USD Daily Outlook
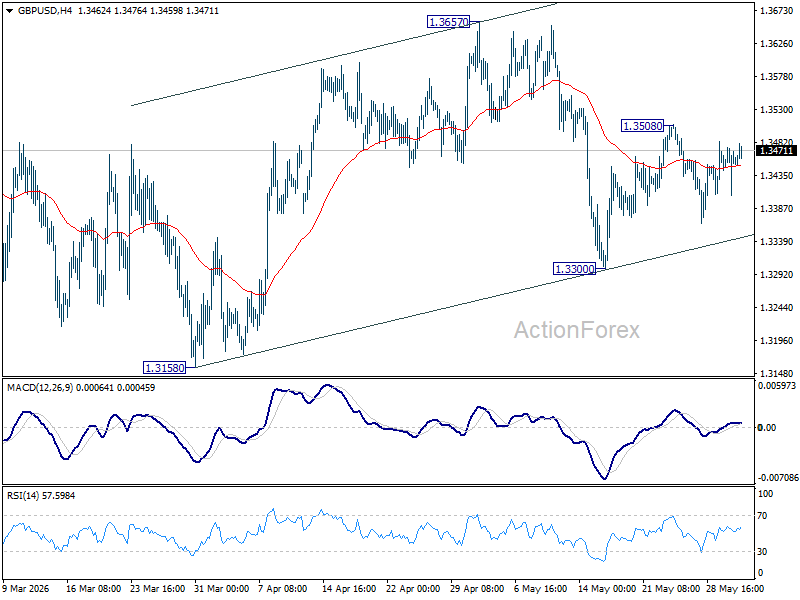
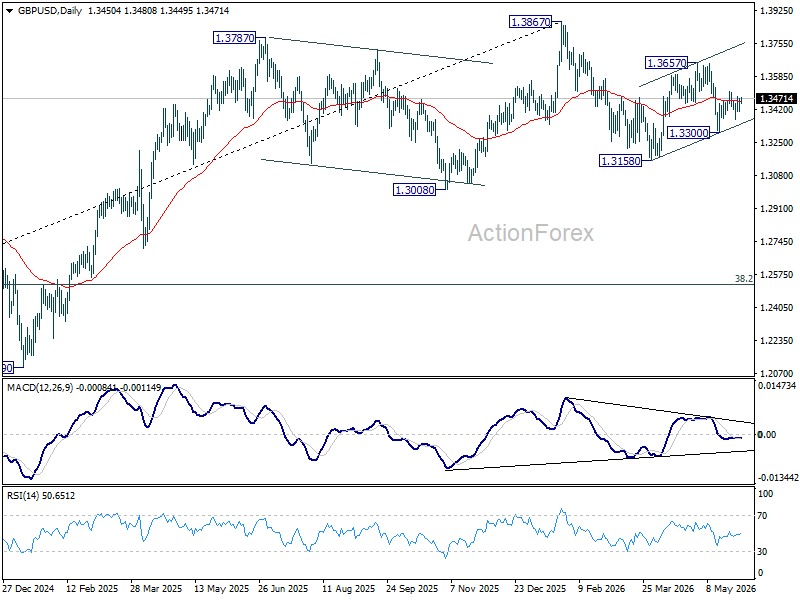
Range trading continues in 1.3300/3508 in GBP/USD and intraday bias remains neutral. On the upside, above 1.3508 will extend the rebound from 1.3300 to 1.3657 resistance first. On the downside, below 1.3300 will bring deeper fall back to 1.3158 support instead.
In the bigger picture, price actions from 1.3867 are a corrective pattern within the broader up trend from 1.0351 (2022 low). With 1.3008 support intact, medium term bullishness is maintained and break of 1.3867 is in favor for a later stage, towards 1.4248 key resistance (2021 high). However, firm break of 1.3008 will at least bring deeper fall to 38.2% retracement of 1.0351 to 1.3867 at 1.2524, with increased risk of bearish reversal.
USD/CHF Daily Outlook
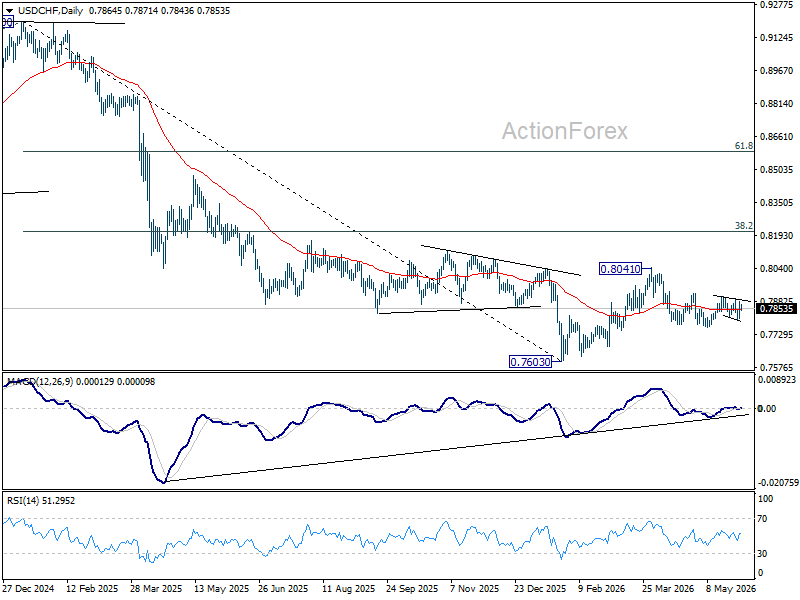
Intraday bias in USD/CHF remains neutral at this point. Risk is mildly on the downside as long as 0.7898 resistance holds. Break of 0.7760 will confirm resumption of the whole fall from 0.8041. However, firm break of 0.7906 should resume the rebound from 0.7760 to retest 0.8041.
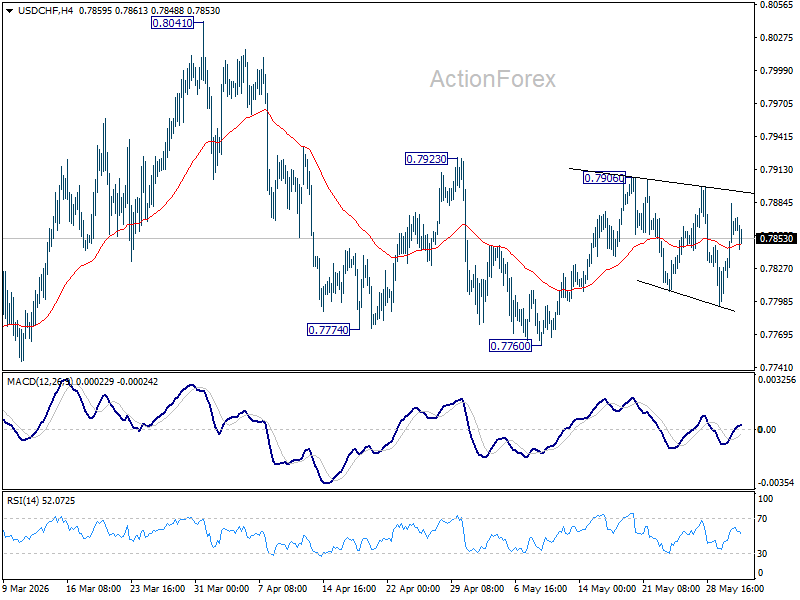
In the bigger picture, as long as 55 W EMA (now at 0.8028) holds, fall from 0.9200 is expected to continue, as part of the larger down trend. Firm break of 0.7603 will target 100% projection of 1.0146 (2022 high) to 0.8332 from 0.9200 at 0.7382.
AUD/USD Daily Report
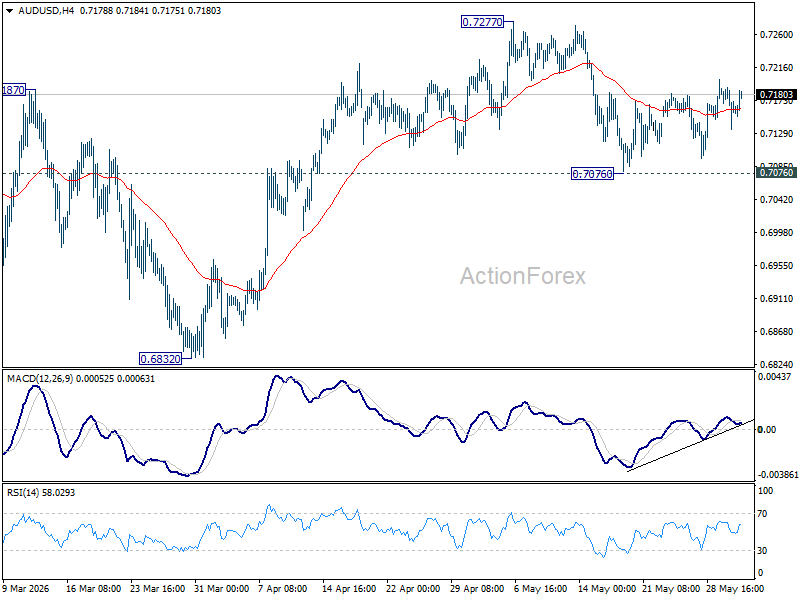
No change in AUD/USD's outlook and intraday bias stays mildly on the upside. Rebound from 0.7076 should extend to retest 0.7277 high first. Firm break there will resume larger up trend. For now, risk will stay on the upside as long as 0.7076 support holds, in case of retreat.
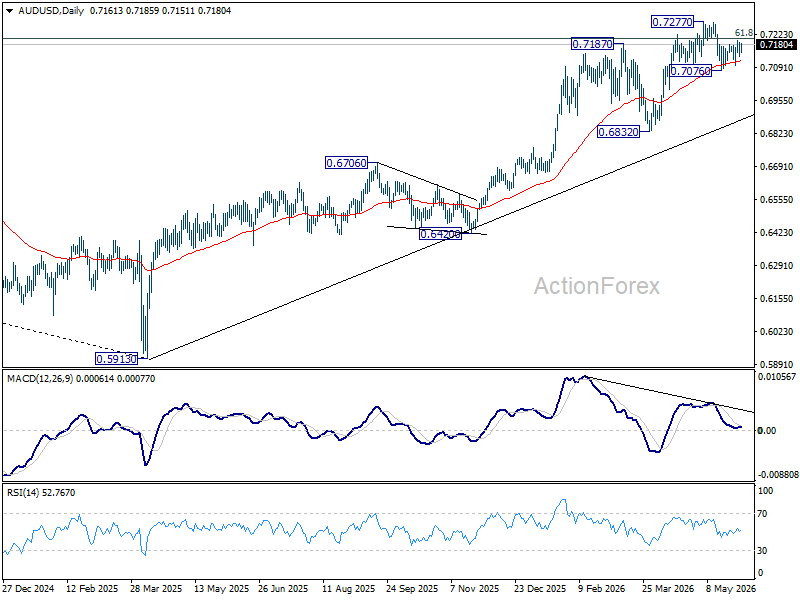
In the bigger picture, rise from 0.5913 (2024 low) is still in progress. Decisive break of 61.8% retracement of 0.8006 to 0.5913 at 0.7206 will solidify the case that it's already reversing the down trend from 0.8006 (2021 high). Further rally should then be seen to retest 0.8006. For now, outlook will remain bullish as long as 0.6832 support holds, in case of pullback.
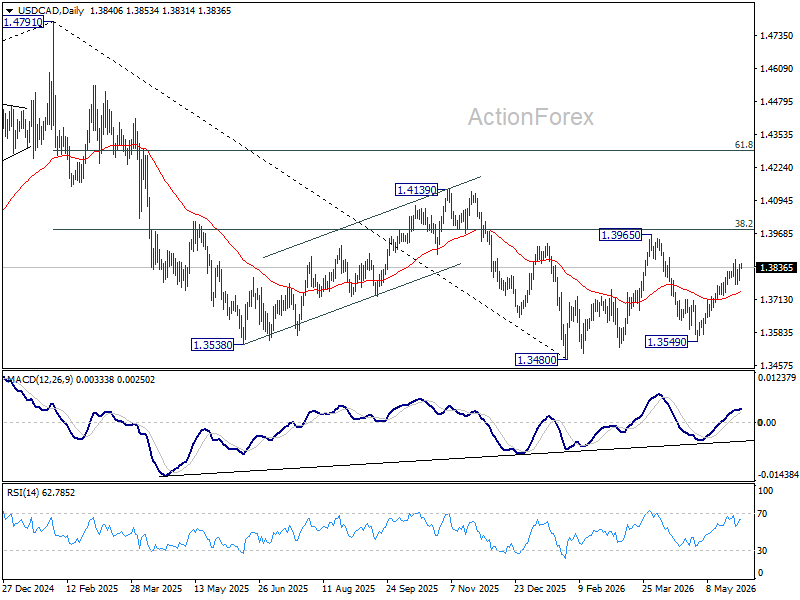
USD/CAD Daily Outlook
Intraday bias in USD/CAD remains neutral and more consolidations could be seen below 1.3868. Further rise expected as long as 1.3729 support holds. Rally from 1.3549 is seen as the third leg of the pattern from 1.3480. Above 1.3868 will target 1.3965 resistance next. Break of 1.3729 will suggest that the rebound has completed, and turn bias back to the downside.
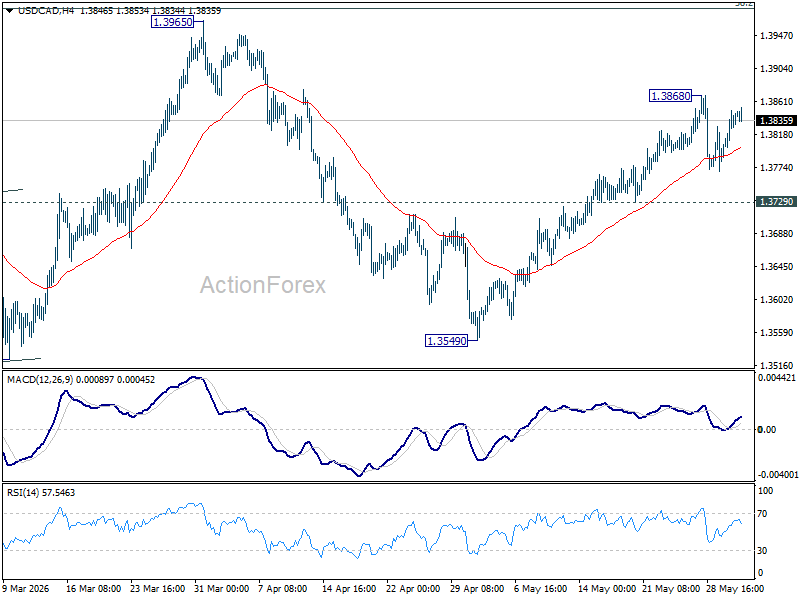
In the bigger picture, price actions from 1.4791 are seen as a corrective pattern to the whole up trend from 1.2005 (2021 low). Deeper fall could be seen, as the pattern extends, to 61.8% retracement of 1.2005 to 1.4791 at 1.3069. However, decisive break of 38.2% retracement of 1.4791 to 1.3480 at 1.3981 will argue that the correction has completed with three waves down to 1.3480 already.
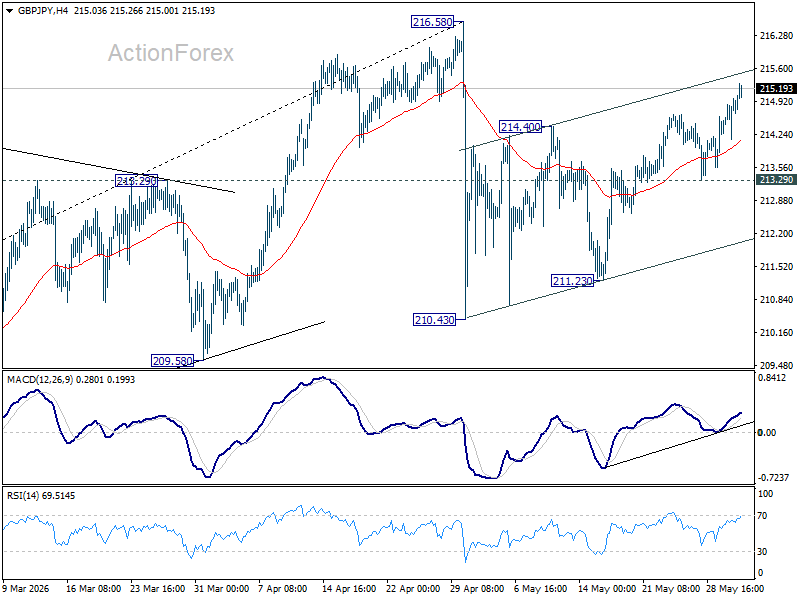
GBP/JPY Daily Outlook
GBP/JPY's rise from 210.43 is still in progress and intraday bias stays on the upside for retesting 216.58 high. Strong resistance should be seen there to cap upside, at least on first attempt. On the downside, below 213.29 minor support will turn bias back to the downside for 211.23 support instead.
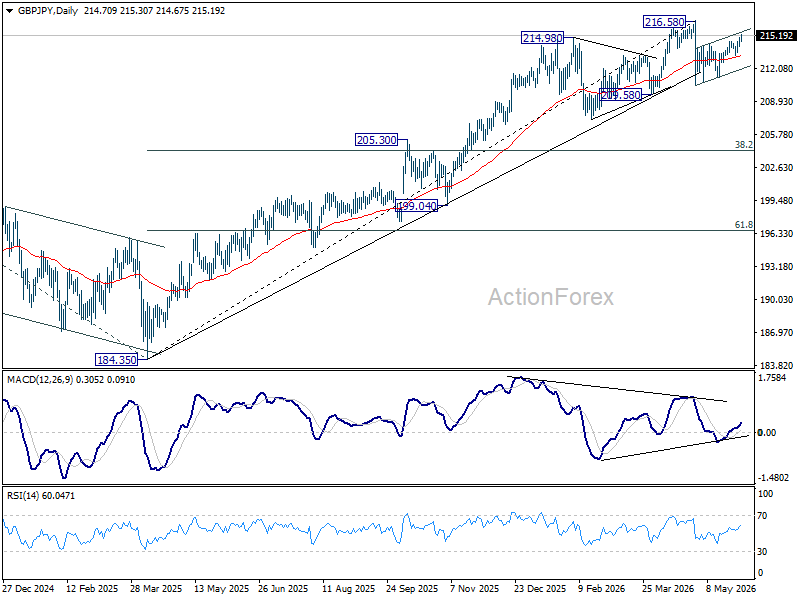
In the bigger picture, while the fall from 216.58 is steep, there is no clear sign of trend reversal yet. The long term up trend could still extend to 61.8% projection of 148.93 (2022 low) to 208.09 (2024 high) from 184.35 at 220.90 on resumption. However, sustained break of 55 W EMA (now at 206.56) will argue that it's already in medium term down trend for 184.35 support.
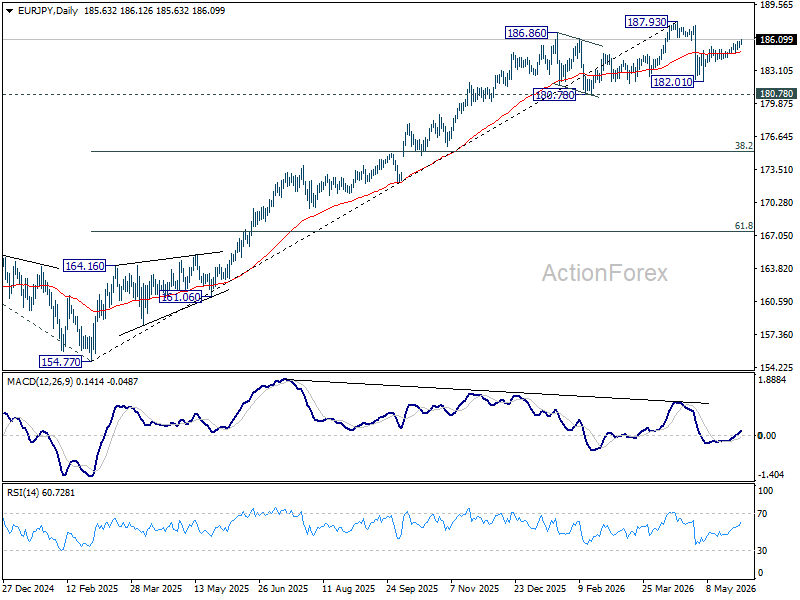
EUR/JPY Daily Outlook
EUR/JPY's rally from 182.01 is still in progress today and intraday bias stays on the upside for 61.8% projection of 182.01 to 185.44 from 184.42 at 186.53. Firm break there will pave the way to 100% projection at 187.85. For now, risk will stay on the upside as long as 184.42 support holds, in case of retreat.
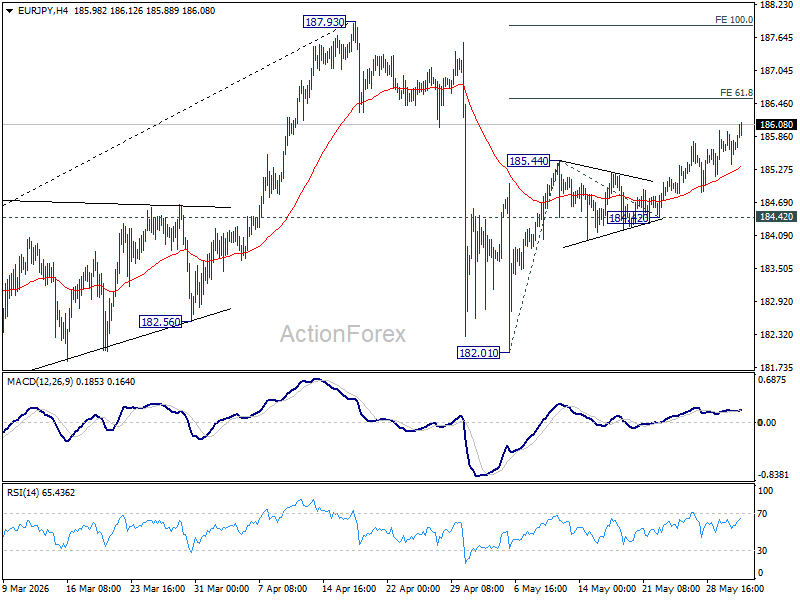
In the bigger picture, the pullback from 187.93 was steep, there is no sign of reversal yet. Uptrend from 114.42 (2020 low) is still expected to resume at a later stage to 78.6% projection of 124.37 (2022 low) to 175.41 (2025 high) from 154.77 at 194.88. However, sustained break of 55 W EMA (now at 178.78) will argue that it's already in a medium term down trend to 175.41 resistance turned support and below.