
Sample Category Title
EUR/GBP Daily Outlook
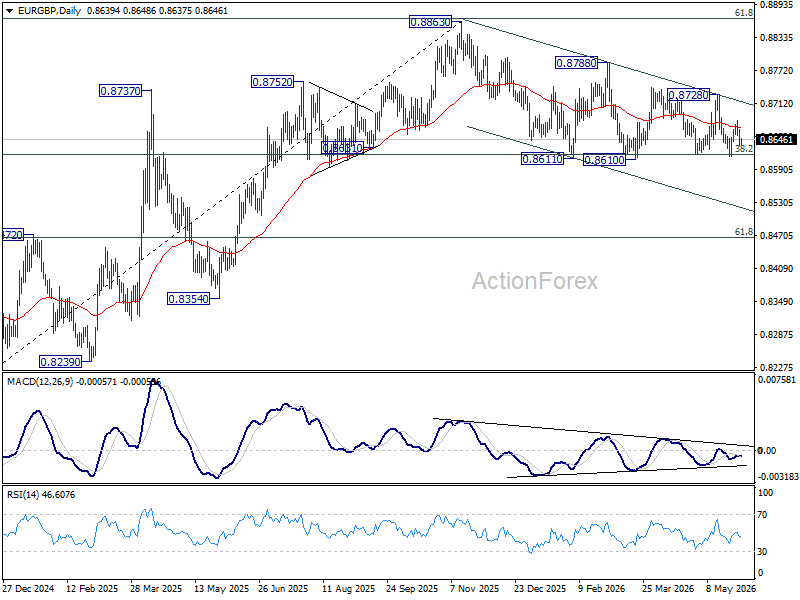
Range trading continues in EUR/GBP and outlook is unchanged. Intraday bias remains neutral for the moment. On the downside, decisive break of 0.8610 support will revive the case of bearish trend reversal. On the upside, break of 0.8728 resistance will bring stronger rally back towards 0.8740 resistance.
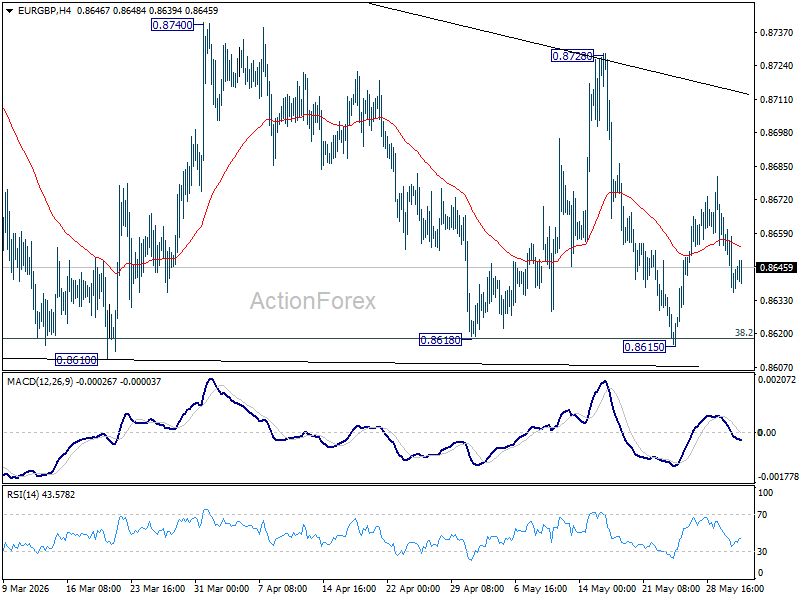
In the bigger picture, focus is staying on 38.2% retracement of 0.8821 to 0.8863 at 0.8618. Strong rebound from there will retain medium term bullishness. Rise from 0.8221 should resume through 0.8863 at a later stage. Nevertheless, sustained break of 0.8618 will confirm that whole rise from 0.8221 has completed at 0.8863. Deeper decline should then be seen to 61.8% retracement at 0.8466 at least.
EUR/AUD Daily Outlook
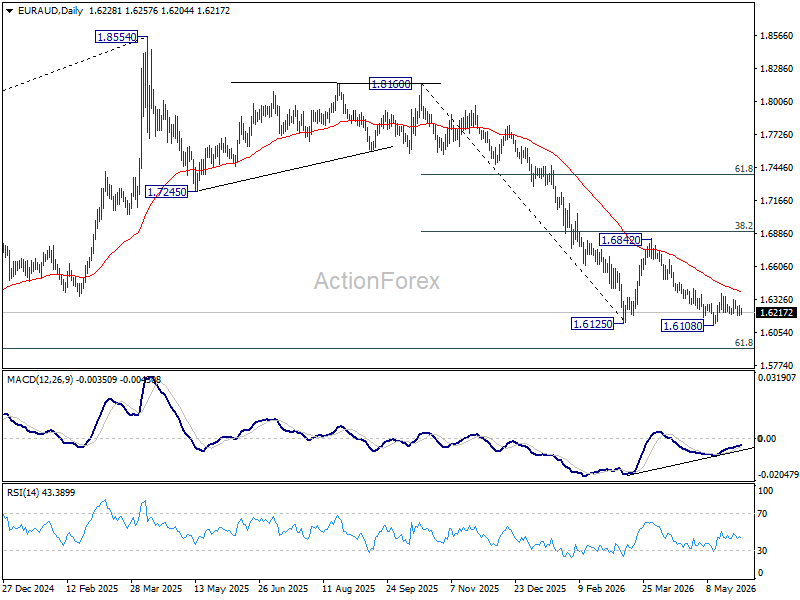
EUR/AUD is staying in range trading and intraday bias remains neutral at this point. Rise from 1.6108 is seen as the third leg of the corrective pattern from 1.6125. Above 1.6381 will bring stronger rebound to 55 D EMA (now at 1.6392) and above. Nevertheless, firm break of 1.6108 will resume the larger down trend from 1.8554.
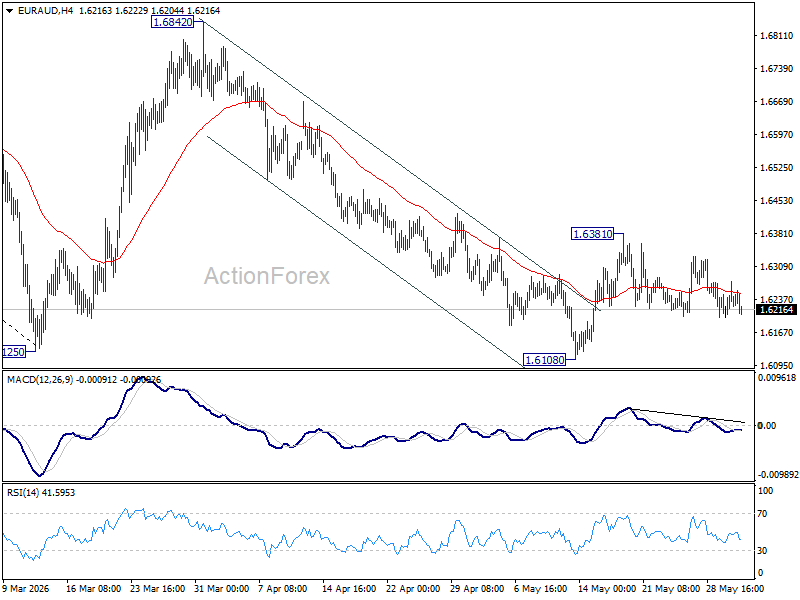
In the bigger picture, fall from 1.8554 (2025 high) is in progress and deeper decline should be seen to 61.8% retracement of 1.4281 to 1.8554 at 1.5913, which is slightly below 1.5963 structural support. Decisive break there will pave the way back to 1.4281 (2022 low). For now, risk will stay on the downside as long as 55 W EMA (now at 1.6956) holds, even in case of strong rebound.
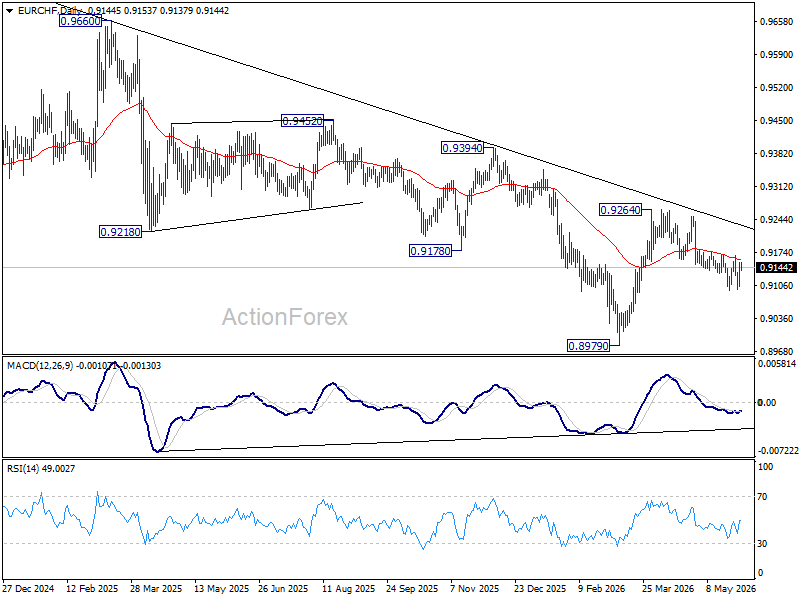
EUR/CHF Daily Outlook
Intraday bias in EUR/CHF remains neutral as range trading continues. Further fall is in favor with 0.9169 resistance intact. Firm break of 0.9094 will resume the decline from 0.9264 to retest 0.8979 low. On the upside, however, decisive break of 0.9169 will argue that the pullback has completed, and turn bias back to the upside for 0.9264.
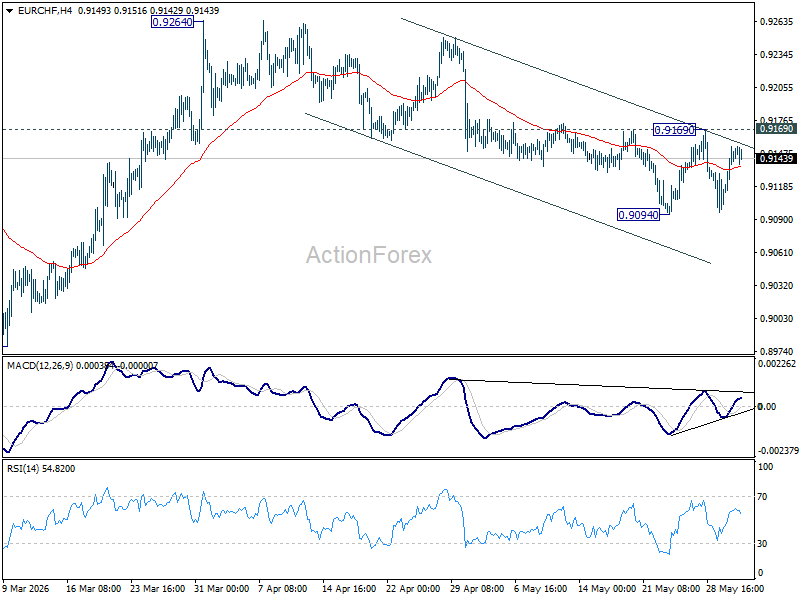
In the bigger picture, the rejection by 55 W EMA (now at 0.9252) suggests that the down trend from 0.9928 (2024 high) is still in progress. Firm break of 0.8979 will confirm down trend resumption. Outlook will stay bearish as long as 0.9394 resistance holds, in case of another rebound.
Dollar is Back in the Game
- Rumours of a breakdown in negotiations have reignited investor interest in the US dollar.
- The risk of further currency interventions is mounting along with USDJPY.
The US dollar rose by 0.4% on Monday following reports that Iran intended to walk away from negotiations with the US. Tehran’s threat sent oil prices soaring and reignited investor interest in safe-haven assets. Strong macroeconomic data also favoured the bulls on the USD index. However, in the absence of further escalation, the DXY gave back some of its gains, stabilising at 99, roughly in the middle of the range seen over the past two weeks.
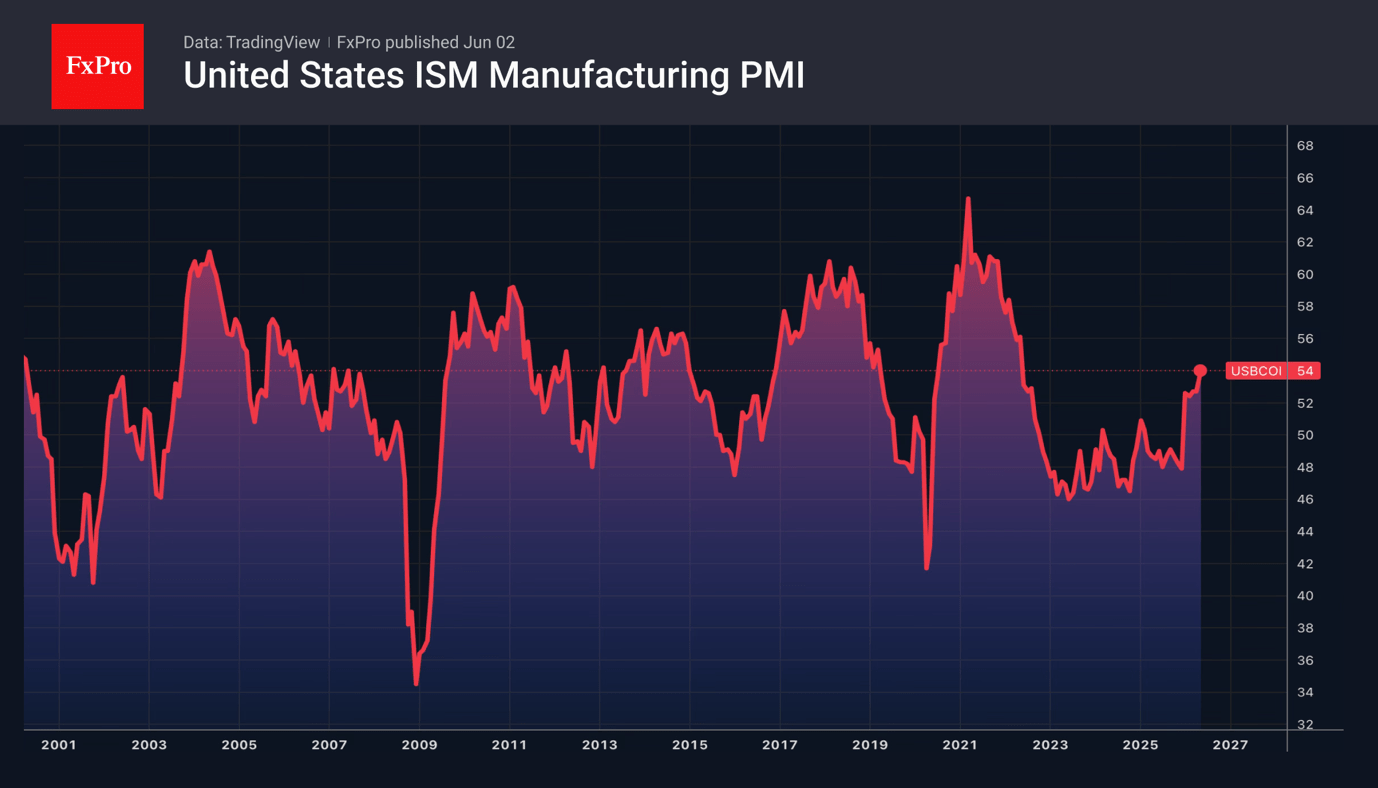
The ISM manufacturing business activity index exceeded forecasts, rising to 54, its highest level since May 2022. The Purchasing Managers’ Index has remained in expansionary territory above 50 for the fifth consecutive month, indicating the sector’s strength. The price component of the PMI fell in May compared with April.
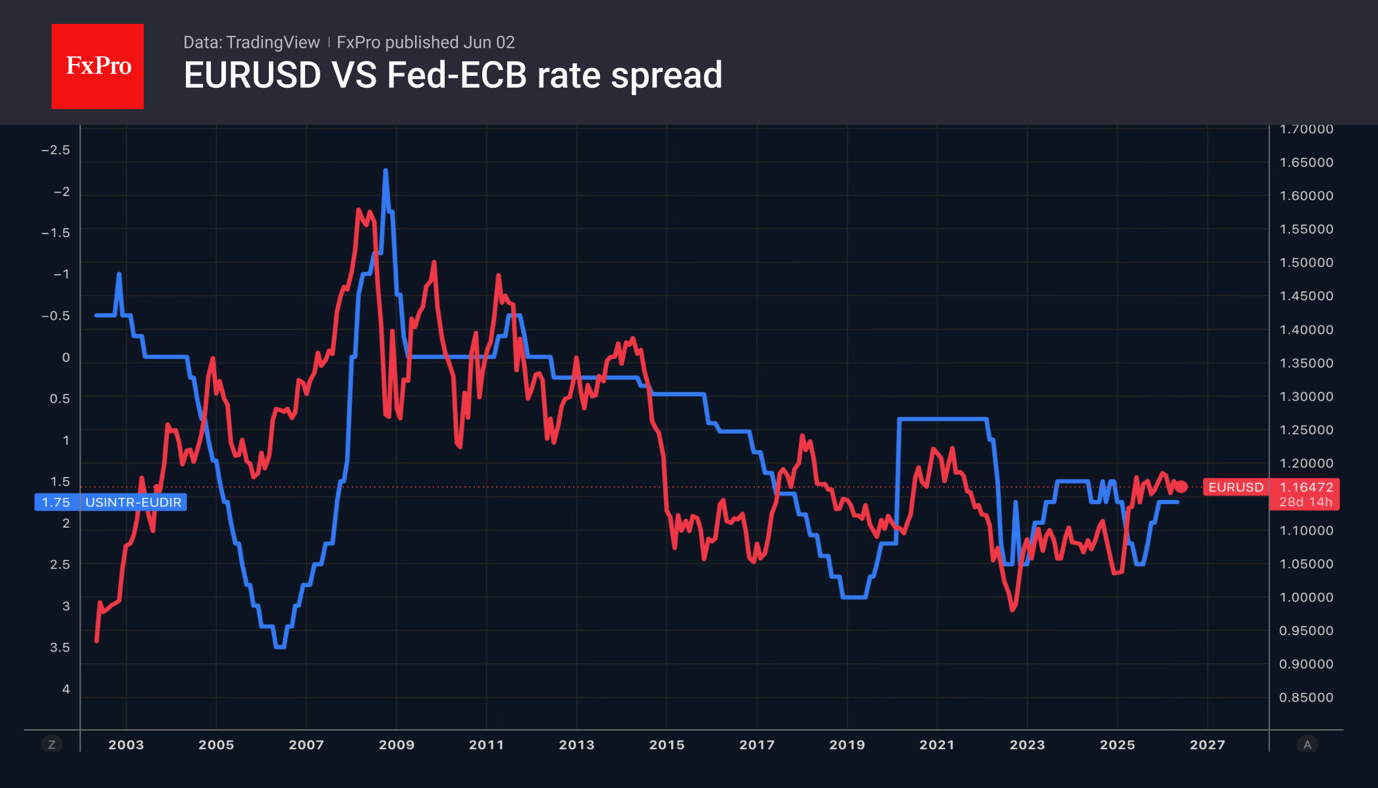
The strength of the US economy allows the Fed to adopt a wait-and-see approach. The futures market puts the odds of the federal funds rate remaining unchanged in 2026 at 51%, with a 49% probability of a hike. According to Rabobank, such assessments suggest limited upside potential for the EURUSD. Two ECB hikes are already priced into the euro exchange rate. However, the longer the Strait of Hormuz remains closed, the more pain the eurozone economy will suffer.
Until now, the markets have been optimistic about the US-Iran deal. However, a partial escalation of the conflict, along with rumours that Tehran is withdrawing from the negotiations, is making investors nervous. What if the current dialogue with the Islamic Republic ends the same way as all the previous ones, i.e., in failure?
As the USDJPY moves higher, the intensity of the government’s verbal interventions is increasing. Finance Minister Satsuki Katayama is using the same rhetoric she used ahead of the previous currency market intervention. She asserts that the authorities are ready to take appropriate measures at any time, as necessary. Tokyo is in close contact with Washington regarding the situation in the Forex market.
Japan holds colossal foreign exchange reserves of $1.17 trillion, which, according to Goldman Sachs, would allow it to intervene in the market at least 30 times. However, a significant portion of these reserves consists of US Treasury bonds, the sale of which would raise their yields and is therefore not welcomed by the US Treasury.
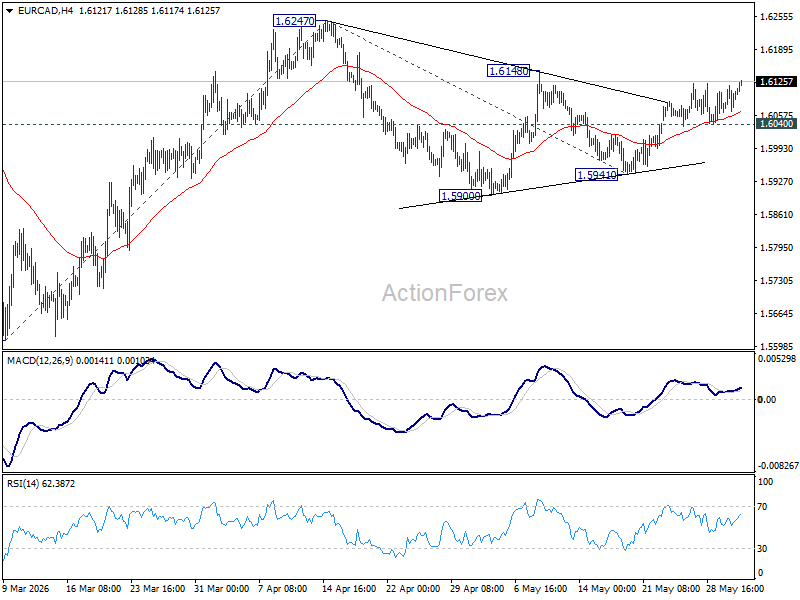
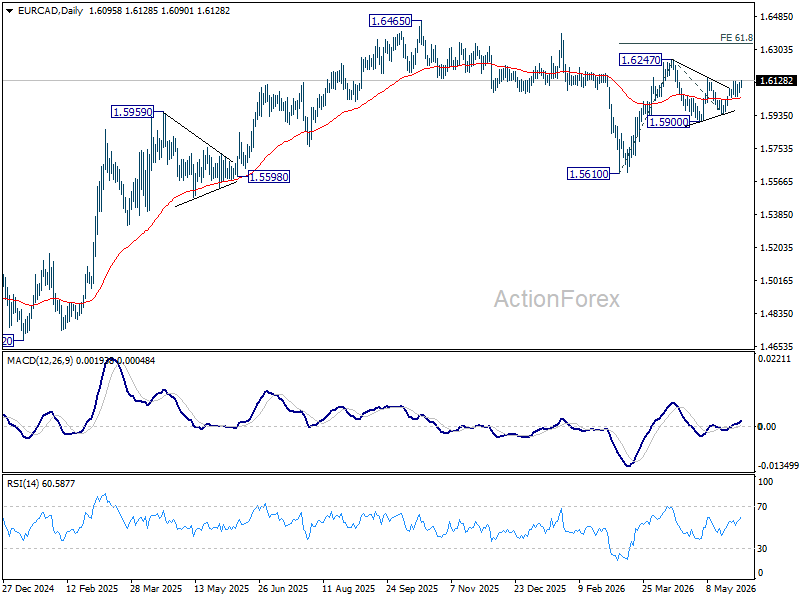
Stronger Eurozone Inflation Gives EUR/CAD a Floor. But Can It Break the Ceiling?
Eurozone inflation has given EUR/CAD a reason to stay bid, but perhaps not yet a reason to break much higher. The stronger-than-expected rise in core CPI to 2.5% yoy and the acceleration in services inflation to 3.5% yoy have effectively cemented expectations for a 25 basis point ECB rate hike next week. For now, that policy outlook is helping to underpin the Euro against its Canadian counterpart.
The logic behind the move is straightforward. The ECB faces growing concerns that higher energy costs could spread into broader wage and price-setting behavior. Raising the deposit rate from 2.00% to 2.25% next week would serve as an insurance policy against those risks, particularly as policymakers become increasingly uncomfortable with persistent services inflation. As long as markets remain confident that the June hike is coming, EUR/CAD should find buyers on pullbacks.
However, the story becomes far less certain once June is out of the way. Financial markets are already pricing one additional hike after next week's move, while some economists believe the ECB may struggle to justify tightening much further given weak domestic demand and slowing growth. That leaves the Euro needing fresh evidence of rising underlying inflation if it is to sustain a broader rally.
At the same time, EUR/CAD cannot escape the influence of oil. The Canadian Dollar remains highly sensitive to developments in crude markets, particularly with uncertainty surrounding US-Iran negotiations and the Strait of Hormuz. Any sharp rebound in oil prices would likely strengthen CAD and offset support coming from ECB policy. In that sense, oil arguably has greater influence over EUR/CAD's medium-term direction than next week's ECB decision.
Technically, further rise is expected in EUR/CAD as long as 1.6040 support holds. Rise from 1.5941 is expected to continue to 1.6148 resistance first. Firm break there will strength the case that consolidation from 1.6247 has completed, and rise from 1.5610 is ready to resume.
Yet a sustained move beyond that 1.6247ceiling will likely require more than a June rate hike. It will require either a more hawkish ECB than markets currently anticipate or a meaningful decline in oil prices towards $80 that weakens the Canadian Dollar's fundamental support.
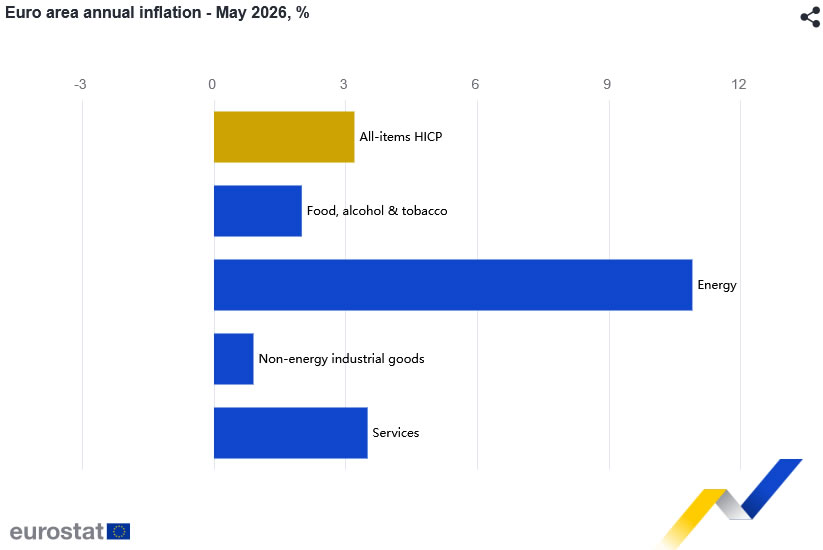
Eurozone CPI Rises to 3.2%, Core Inflation Tops Forecasts
Eurozone inflation accelerated in May, reinforcing expectations that the ECB will raise interest rates at next week's meeting. Headline CPI rose from 3.0% yoy to 3.2% yoy, matching market expectations, while core CPI, which excludes energy, food, alcohol and tobacco, accelerated from 2.2% yoy to 2.5% yoy, exceeding expectations of 2.4% yoy. The stronger core reading is likely to be of particular interest to policymakers given growing concerns that inflation pressures are broadening beyond energy.
The composition of the report highlights those concerns. Energy inflation remained the largest contributor, rising slightly from 10.8% yoy to 10.9% yoy. More importantly, services inflation accelerated sharply from 3.0% yoy to 3.5% yoy, suggesting higher costs are increasingly spreading through the domestic economy. By contrast, food, alcohol and tobacco inflation slowed from 2.4% yoy to 2.0% yoy, helping to offset some of the upward pressure from energy and services.
The data support the increasingly hawkish rhetoric from ECB officials in recent weeks. Policymakers including Isabel Schnabel have argued that the central bank can no longer simply look through the inflationary effects of higher energy prices if they begin feeding into broader price-setting behavior. With both headline and core inflation moving higher, the latest figures strengthen the case for a June rate hike and may keep markets alert to the possibility of further tightening if underlying price pressures remain persistent.
| Indicator | April | May | Market Expectation |
|---|---|---|---|
| Headline CPI YoY | 3.0% | 3.2% | 3.2% |
| Core CPI YoY | 2.2% | 2.5% | 2.4% |
| Energy Inflation YoY | 10.8% | 10.9% | |
| Services Inflation YoY | 3.0% | 3.5% | |
| Food, Alcohol & Tobacco YoY | 2.4% | 2.0% | |
| Non-Energy Industrial Goods YoY | 0.8% | 0.9% |
GBP/USD in a State of Uncertainty: Risks Remain, but Market Reactions Are Muted
GBP/USD showed little movement on Tuesday, holding steady at 1.3453. The pound remains within its established trading range as investors continue to assess the progress of negotiations between the US and Iran and their potential impact on the global economy.
Talks between Washington and Tehran are ongoing, but fresh incidents in the Persian Gulf have renewed doubts about the swift restoration of normal shipping through the Strait of Hormuz. The waterway remains one of the most important routes for global oil and gas supplies.
Oil prices rose on Monday, although Brent crude recorded its largest monthly decline since March 2020 in May, falling nearly 20%. Despite this correction, oil prices remain approximately 30% higher than pre-conflict levels, keeping inflation risks elevated.
This dynamic is particularly significant for the UK. The British economy is considerably more dependent on energy imports than the US, meaning higher oil and gas prices are transmitted more quickly into business costs and consumer spending.
The pound continues to benefit from relatively high interest rates. Earlier in the year, markets had expected two rate cuts from the Bank of England. However, following the surge in energy prices, investors have begun pricing in the possibility of further policy tightening to contain inflation.
The market is now factoring in roughly one Bank of England rate increase before the end of the year and is partially pricing in the possibility of a second move.
However, Bank of England Governor Andrew Bailey struck a more dovish tone last week. He suggested that a temporary overshoot of the Bank’s 2% inflation target does not necessarily warrant an immediate increase in interest rates. This shift in tone has reduced expectations of aggressive policy action in the coming months.
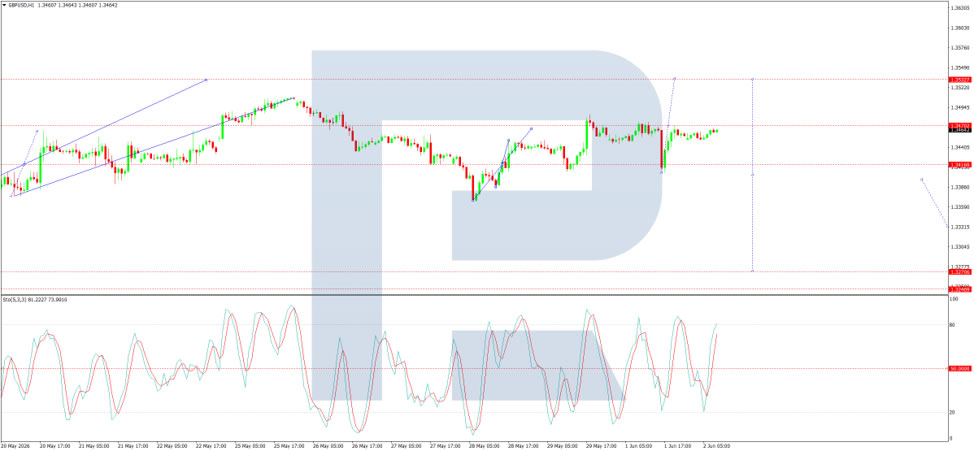
Technical Analysis
On the H4 GBP/USD chart, the pair is trading within a broad consolidation range above 1.3417, currently extending up to 1.3508 and down to 1.3406. A breakout above the range could open the way for further gains towards 1.3533, while a downside breakout could pave the way for a move towards 1.3290. The MACD indicator supports this scenario, with its signal line above zero and pointing firmly upwards.
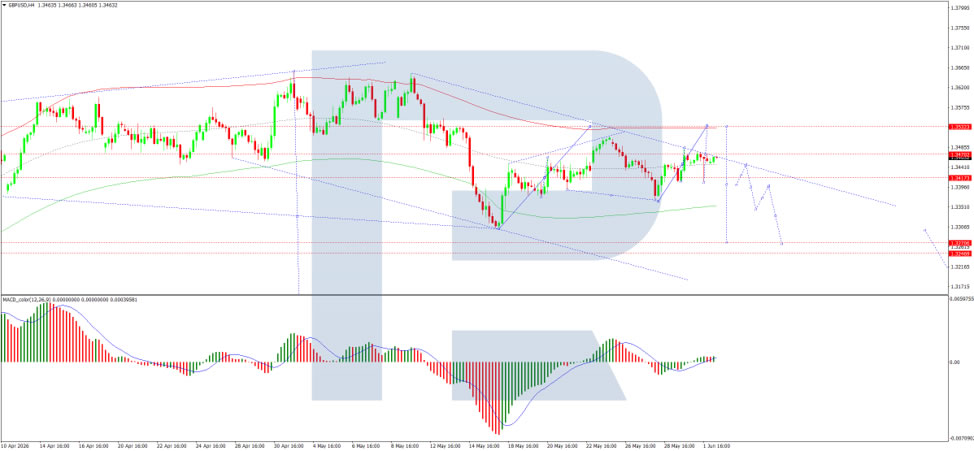
On the H1 chart, GBP/USD is trading within a narrower consolidation range around 1.3470, recently extending down to 1.3406. The next expected move is a rise towards 1.3533. The Stochastic oscillator supports this scenario, with its signal line above 50 and pointing upwards towards 80.
Conclusion
GBP/USD remains range-bound as investors weigh geopolitical risks, energy-driven inflation concerns, and the outlook for Bank of England policy. While the pound continues to draw support from expectations of relatively high interest rates, the market remains cautious, awaiting clearer signals from both policymakers and global developments.
EUR/GBP: June ECB Meeting Could Bring the Period of Equilibrium to an End
Fundamental backdrop
The divergence in the monetary policy paths of the ECB and the Bank of England is creating a mixed outlook for the pair. Having completed a cycle of eight consecutive rate cuts in 2025, the ECB left its deposit rate unchanged at 2.0% at its April meeting. At the same time, according to Trading Economics, markets are assigning a high probability to a 25-basis-point rate increase as early as 11 June.
The Bank of England, by contrast, remains in wait-and-see mode. On 29 May, Governor Andrew Bailey suggested that inflation could temporarily exceed its target level, indicating that a rate increase from the current 3.75% is unlikely in the near term. As a result, the interest-rate differential between the two central banks could narrow as early as June, and this scenario is weighing on sterling.
Technical picture
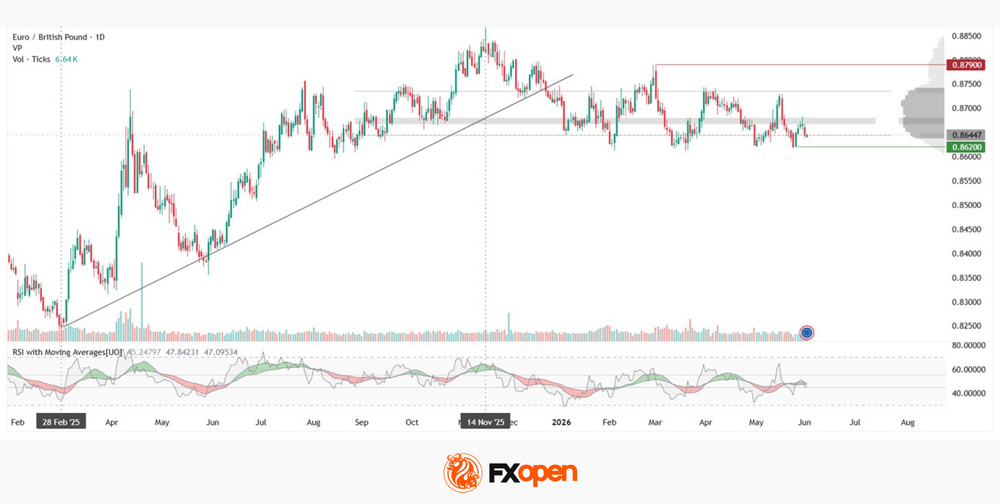
On the daily chart, EUR/GBP has completed the bullish structure that began near 0.8250 in February 2025. The advance reached the 0.8850 area in November before giving way to a decline. The trendline drawn from the February low was broken in early January, after which the pair entered a sideways phase within the current horizontal volume profile. The profile boundaries are located around 0.8735 on the upside and 0.8645 on the downside. The point of control is concentrated within the 0.8670–0.8675 range and is positioned close to the lower boundary of the profile.
At present, the price is testing the lower boundary of the profile, and a break below it could shift market attention towards the 0.8620 area. Should buyers succeed in overcoming the upper boundary of the profile, the next resistance level is located near 0.8790.
The RSI and its moving averages are currently reading 45, 47 and 47. All three measures remain below the 50 mark; however, the strength of the bearish impulse has yet to receive convincing confirmation from the oscillator.
Key takeaways
The break of the ascending trendline and the ongoing test of the lower boundary of the profile are creating a tense technical backdrop. The key event of the coming weeks remains the ECB meeting on 11 June, with a potential rate increase capable of shifting the balance of power within the pair.
Trade over 50 forex markets 24 hours a day with FXOpen. Take advantage of low commissions, deep liquidity, and spreads from 0.0 pips (additional fees may apply). Open your FXOpen account now or learn more about trading forex with FXOpen.
This article represents the opinion of the Companies operating under the FXOpen brand only. It is not to be construed as an offer, solicitation, or recommendation with respect to products and services provided by the Companies operating under the FXOpen brand, nor is it to be considered financial advice.
Sunrise Market Commentary
Markets
Iran yesterday suspended talks with the US over the ongoing war between Israel and the Lebanon-based Hezbollah. It threatened to attack Israel in response and warned for the “axis of resistance” to become active on all fronts. That would include a full closure of the Hormuz Strait as well as the Bab-el-Mandab Strait, another critical waterway that could disrupt flows from the Red Sea to the Mediterranean via the Suez Channel and to the Indian Ocean via the Gulf of Aden. Oil prices shot up to nearly $98/b compared to the $92 close on Friday. Brent then eased from the highs to currently trade around $94 after president Trump said Israeli president Netanyahu agreed not to strike Lebanon’s capital Beirut in return for Hezbollah to stop its own attacks on northern Israel. The situation remains very much in flux with different interpretations complicating the matter. Netanyahu for his part said the campaign in southern Lebanon would simply continue, probably not to Iran’s liking. Anyway, Trump’s intervention caused the oil turnaround and with it US Treasuries, which saw yields spike to around 7 bps at some point. The curve eventually finished up to 3.1 bps higher in a bear flattening move. European yields missed out on most of the screeching U-turn with net changes still amounting to 10 bps at the front. Bund futures suggest a further decline at the open. Stock markets showed similar swings. EUR/USD dropped from as high as 1.166 to a 1.1608 low and in the end settled around 1.163. DXY closed above the 99 barrier while USD/JPY nudged higher towards the 160 barrier. That level has triggered FX interventions in the past. EUR/GBP slid to 0.8644 with the YtD low (0.8609) steadily approaching.
Economic data yesterday included the ECB’s inflation survey which showed consumer expectations at elevated levels at all horizons. Together with the European inflation figures on tap today (expected at 3.2% headline and 2.4% core vs the KBC nowcast of 3.3% and 2.4%) it keeps the pressure on the ECB going into next week’s policy meeting. More policymakers meanwhile are hinting at action with Schnabel doubling down on her message of last week that the central bank can no longer look through the energy shock. The US manufacturing ISM was strong, rising from 52.7 to a better-than-expected 54 in May. Rising output levels (54.3), new orders (56.8), elevated supplier deliveries (partially due to the Middle East disruption, though) and less drag from the employment component supported the headline index. The US eco calendar today centers around the JOLTS job openings report as the amuse-bouche to the more important labour market gauge, the US payrolls on Friday. Trading is likely to be dominated by the ongoing geopolitical sage though.
News & Views
Bloomberg reports that the European Commission is weighing plans to grant member states additional fiscal flexibility to cope with the impact of higher energy costs due to the Iran war. People familiar with the discussions say that they want to smart copy the current escape clause for the defense carve-out. Governments would be able to spend around 0.3% of GDP on energy-related spending outside of the EU’s fiscal framework.
The pace of South Korean inflation held steady in May at 0.5% M/M whereas consensus expected a slowdown to 0.2%. Annual inflation picked up further and more than forecast, from 2.6% to 3.1%, and matching the fastest pace since December 2023. Underlying core inflation picked up as well, from 2.2% to 2.5% which was also the strongest price pressure since end 2023. Price pressure was broad-based with inflation in industrial goods excluding oil products accelerating to 1.6% from 1.4%. Personal services inflation rose from 3.2% to 3.7%. Today’s hot inflation prints come after the Bank of Korea took a hawkish turn last week under its new governor Shin Hyun Song. Two MPC members (out of seven) already preferred a rate hike following upward revisions to growth and inflation numbers. Apart from the energy shock, the domestic economy is firing at all cylinders thanks to a booming semiconductor sector. With inflation drifting away from the 2% target, it’s clear that rate hikes are coming soon. The Korean won is still trading historically weak above USD/KRW 1500.
Euro Area Inflation to Affirm June ECB Hike
In focus today
In the US, the April JOLTS report is due for release in the afternoon. The Fed follows the number of job openings as a key measure of labour demand. Back in March, the number of hires also showed tentative signs of a recovery. Moreover, the Fed's Beth Hammack (voter, hawk) will be on the wires.
In the euro area, today brings the aggregate HICP inflation for May. We have already received 75% of the index from individual country releases, which came in slightly lower than expected. Importantly, the country releases did not indicate that rising prices from the energy shock was broadening beyond energy components. We expect headline inflation at 3.1% y/y and core at 2.4% y/y.
In Denmark, Danmarks Nationalbank's press release on the May FX reserve will be published, providing insight into whether the central bank intervened in the FX market during May, where EUR/DKK hit a historic high level of 7.4741.
In Poland, the National Bank of Poland will announce its rate decision. We expect the policy rate to be kept unchanged at 3.75%, in line with consensus.
Economic and market news
What happened since yesterday
In the Oil market, Brent crude reversed much of last week's ceasefire-driven decline, briefly trading above USD 97/bbl, after Iran reportedly halted negotiations with the US over continued fighting in Lebanon. Prices later eased after President Trump said negotiations with Tehran were continuing and signalled expectations of a deal to extend the ceasefire and reopen Hormuz "over the next week". Trump also claimed Israel and Hezbollah had agreed to stop shooting, helping Brent slip back below USD 95/bbl.
In the US, ISM Manufacturing surprised on the upside in May and signals a more positive outlook for the economy than the PMI. The headline index rose to 54.0 (cons: 53.0, prior: 52.7), driven by strong new orders at 56.8 (prior: 54.1) and higher employment. The prices index edged marginally lower but remains historically elevated. The details suggest solid demand across both domestic and export orders, while an improved order‑inventory balance often points to further gains in production.
In the euro area, inflation expectations in the ECB's consumer survey stabilised in April following the large uptick in March. The 3Y median expectation ticked down to 2.9% from 3.0%, while the 1Y median remained unchanged at 4.0%. Although the still elevated expectations support the ECB's hike in June, the stabilisation buys the ECB more time to assess the impact of the shock before embarking on a second hike.
Also in the euro area, the unemployment rate remained at 6.3% in April similar to March. It was above the expected 6.2%, but the historical data was revised up while the actual number of unemployed persons fell from March to April. Hence, the rise in the unemployment rate should not be seen as a sign of new weakening in the labour market from the war in Iran.
In OPEC+, several member countries are reportedly leaning towards a modest 188,000 bpd increase in their July oil output target at Sunday's meeting, mirroring the June hike excluding the UAE. However, with production still well below target due to export cuts and the SOH closure, the move is unlikely to affect oil prices unless it results in higher realised exports.
In Denmark, Social Democrat leader Mette Frederiksen has agreed to form a new centre-left minority coalition government, securing a third consecutive term as prime minister after the March election. The government will be presented this week and will include the Social Democrats, Social Liberals, Left Greens and Moderates.
Equities: Global equities rose yesterday and several indices set new all-time highs, but the move was extremely narrow. Leadership came almost entirely from energy and, needless to say, tech. The narrow leadership was certainly not something one could blame on the macro data. Rather, renewed tensions around Iran and a 5 percent jump in oil prices was the reason that 9 out of 11 sectors were lower yesterday. However, given the strong performance in tech, large cap cyclicals outperformed while minimum volatility and defensives underperformed.
It has become even more evident recently just how narrow equity market leadership has become. Since the end of March, global equities are up around 17 percent, but this has been driven especially by the tech sector, which globally is up close to 45 percent since the bottom. This reinforces what we have stressed many times this year, and what is becoming increasingly clear for investors across financial markets: 2026 will be a year dominated by AI and the AI buildout. We are seeing earnings growth that is four times what GDP growth would normally imply! From an equity and risk perspective, that means the 2026 story is AI to a much greater extent than oil, Iran, geopolitics and so on. It is more or less all about AI.
This morning, Asian markets are somewhat in the red, led by South Korea, which is down a couple of percent. But note that South Korea's leading equity index is still up around 130 percent year to date. If there was any doubt about what that rhymes with, the answer is of course AI. European futures are marginally higher, while US futures are in the red this morning.
FI and FX: A rebound in the oil price set the tone in FX and fixed income markets yesterday. The rise in the oil price pushed up yields in US and Europe in parallel with 2Y EUR and USD swap rates rising as much as 6bp. EUR/USD fell and USD/JPY rose owing mainly to the rise in oil prices. EUR/SEK also rose and EUR/NOK initially traded back and forth on the news but is also trading at a higher level now.