Sample Category Title
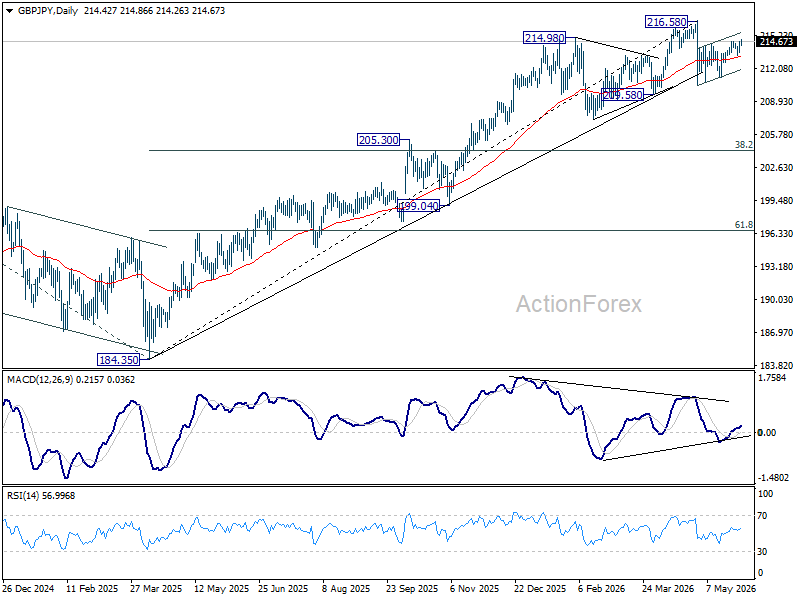
GBP/JPY Daily Outlook
Intraday bias in GBP/JPY is back on the upside with break of 214.66. Rise from 210.43 is resuming and should target a retest on 216.58 high. Strong resistance should be seen there to cap upside, at least on first attempt. On the downside, below 213.29 minor support will turn bias back to the downside for 211.23 support instead.
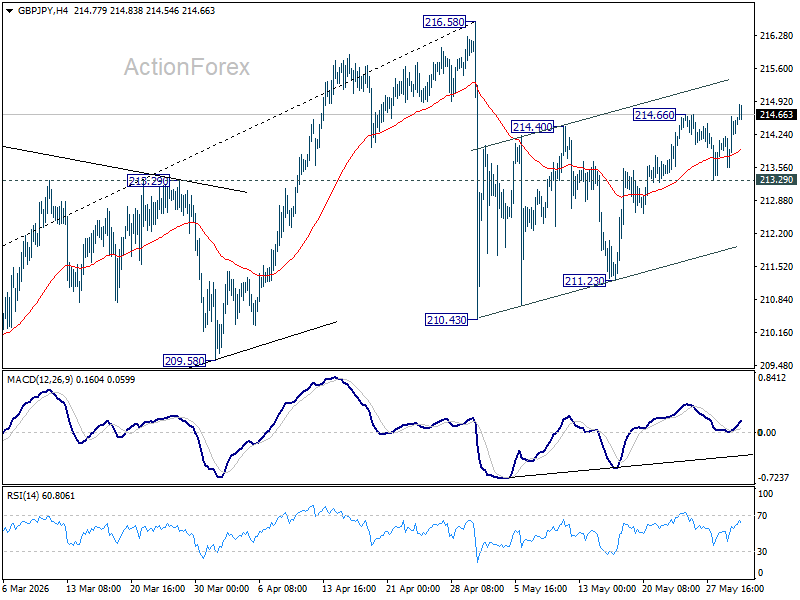
In the bigger picture, while the fall from 216.58 is steep, there is no clear sign of trend reversal yet. The long term up trend could still extend to 61.8% projection of 148.93 (2022 low) to 208.09 (2024 high) from 184.35 at 220.90 on resumption. However, sustained break of 55 W EMA (now at 206.56) will argue that it's already in medium term down trend for 184.35 support.
EUR/JPY Daily Outlook
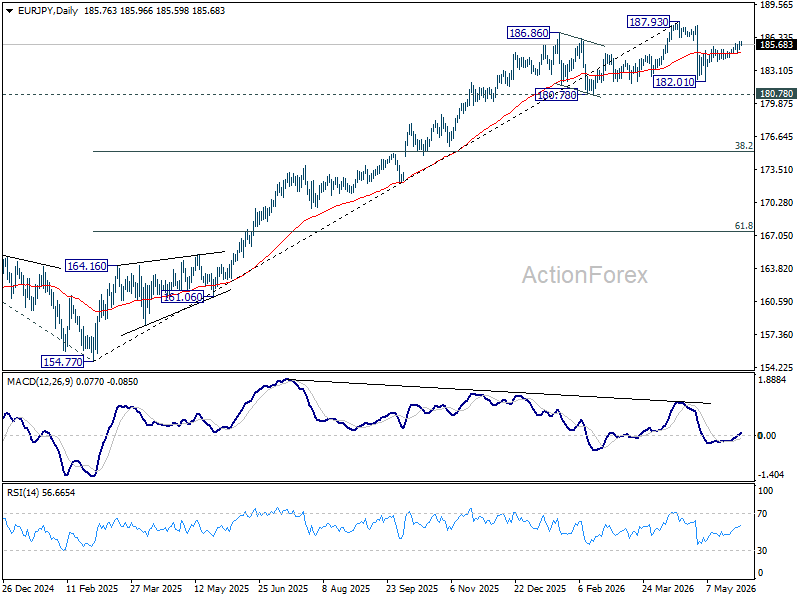
Intraday bias in EUR/JPY remains on the upside at this point. Rise from 182.01 is in progress and should target 187.93 high. Strong resistance would be seen from there to bring reversal, to extend the corrective pattern from 187.93 with another falling leg. For now, risk will stay on the upside as long as 184.42 support holds, in case of retreat.
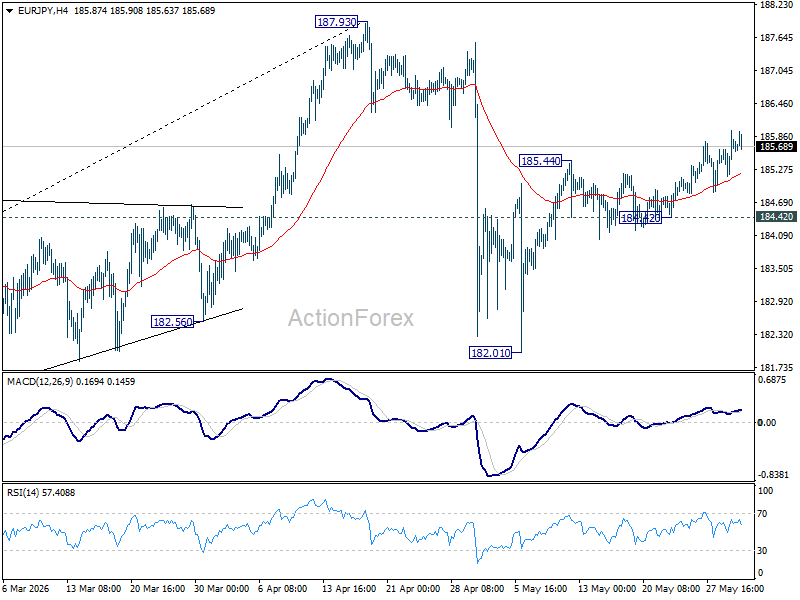
In the bigger picture, the pullback from 187.93 was steep, there is no sign of reversal yet. Uptrend from 114.42 (2020 low) is still expected to resume at a later stage to 78.6% projection of 124.37 (2022 low) to 175.41 (2025 high) from 154.77 at 194.88. However, sustained break of 55 W EMA (now at 178.78) will argue that it's already in a medium term down trend to 175.41 resistance turned support and below.
EUR/GBP Daily Outlook
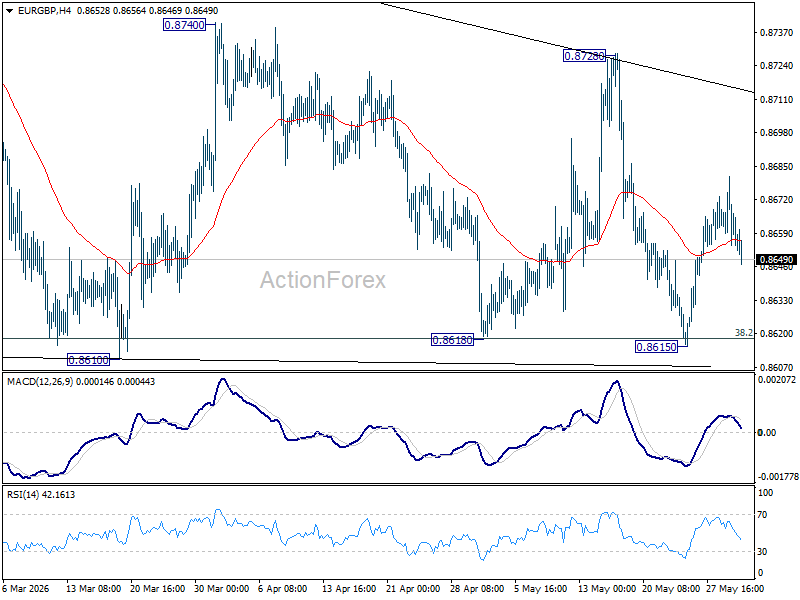
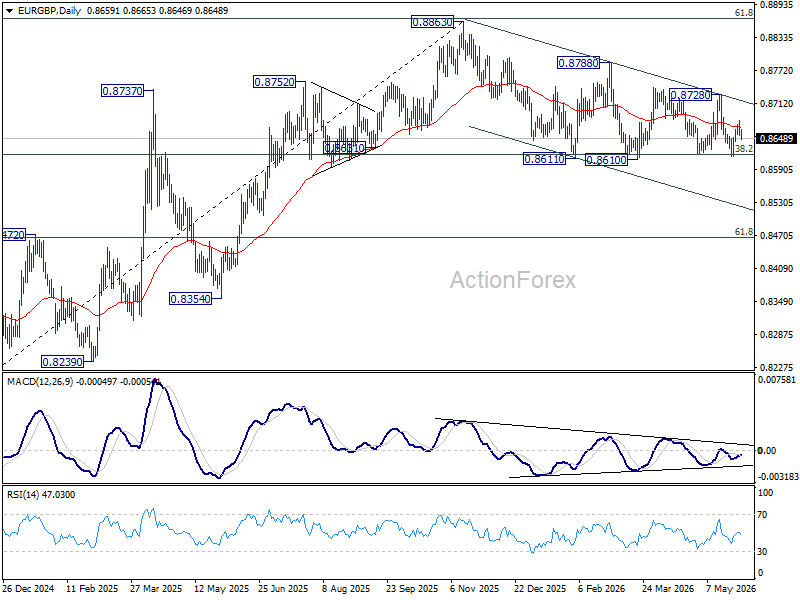
Sideway trading continues in EUR/GBP and intraday bias remains neutral at this point. On the downside, decisive break of 0.8610 support will revive the case of bearish trend reversal. On the upside, break of 0.8728 resistance will bring stronger rally back towards 0.8740 resistance.
In the bigger picture, focus is staying on 38.2% retracement of 0.8821 to 0.8863 at 0.8618. Strong rebound from there will retain medium term bullishness. Rise from 0.8221 should resume through 0.8863 at a later stage. Nevertheless, sustained break of 0.8618 will confirm that whole rise from 0.8221 has completed at 0.8863. Deeper decline should then be seen to 61.8% retracement at 0.8466 at least.
EUR/AUD Daily Outlook
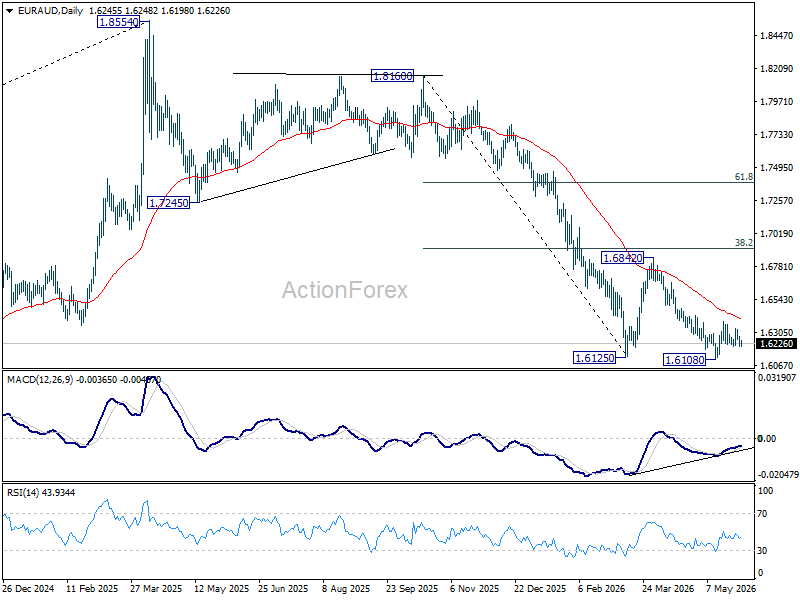
Range trading continues in EUR/AUD and outlook is unchanged. Intraday bias stays neutral. Rise from 1.6108 is seen as the third leg of the corrective pattern from 1.6125. Above 1.6381 will bring stronger rebound to 55 D EMA (now at 1.6404) and above. Nevertheless, firm break of 1.6108 will resume the larger down trend from 1.8554.
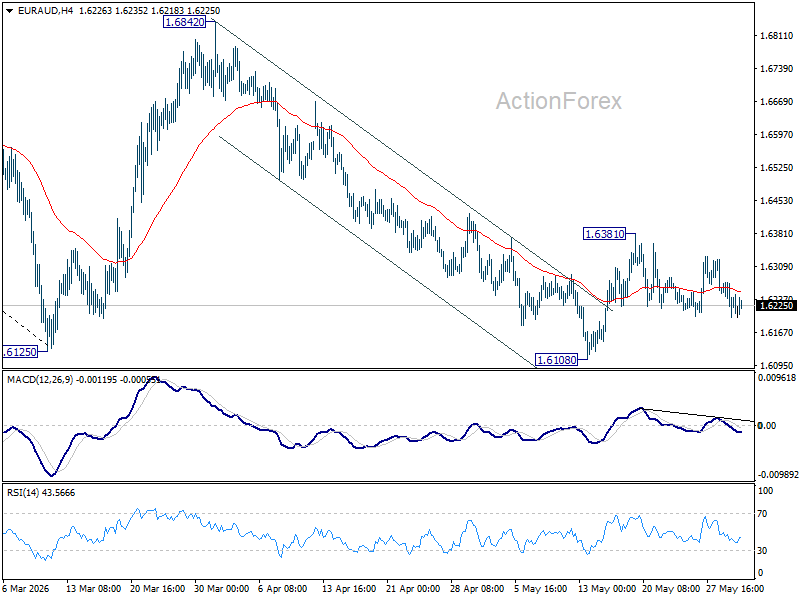
In the bigger picture, fall from 1.8554 (2025 high) is in progress and deeper decline should be seen to 61.8% retracement of 1.4281 to 1.8554 at 1.5913, which is slightly below 1.5963 structural support. Decisive break there will pave the way back to 1.4281 (2022 low). For now, risk will stay on the downside as long as 55 W EMA (now at 1.6956) holds, even in case of strong rebound.
EUR/CHF Daily Outlook
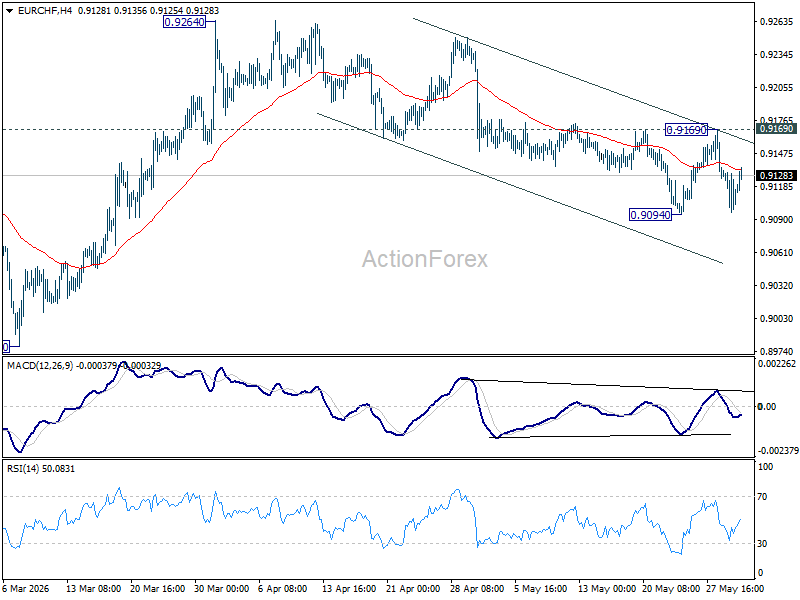
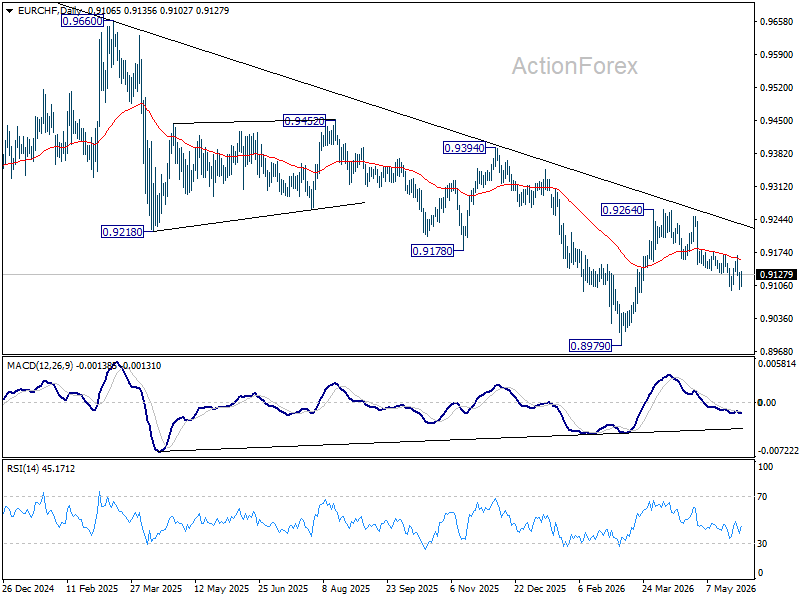
EUR/CHF recovered today as range trading continues above 0.9094. Intraday bias stays neutral for the moment. The favored case remains that rebound from 0.8979 should have completed at 0.9264. Break of 0.9094 will bring deeper fall back to retest 0.8979 low. For now, risk will stay on the downside as long as 0.9169 resistance holds, in case of recovery.
In the bigger picture, the rejection by 55 W EMA (now at 0.9252) suggests that the down trend from 0.9928 (2024 high) is still in progress. Firm break of 0.8979 will confirm down trend resumption. Outlook will stay bearish as long as 0.9394 resistance holds, in case of another rebound.
ECB Survey Shows Inflation Expectations Stable but Growth Concerns Deepen
Eurozone consumers remained concerned about inflation in April, even as longer-term price expectations showed signs of modest improvement. According to the ECB's latest Consumer Expectations Survey, median inflation expectations for the next 12 months held steady at 4.0%, while expectations three years ahead eased from 3.0% to 2.9%. Expectations for inflation five years ahead were unchanged at 2.4%, suggesting households still expect inflation to settle above the ECB's 2% target over the longer term.
The data suggest inflation expectations have not become unanchored, but they also show that consumers remain unconvinced inflation will return quickly to target.
The survey painted a more cautious picture on economic growth. Expectations for economic growth over the next 12 months deteriorated from -2.1% to -2.2%, reflecting growing pessimism about the economic outlook.
At the same time, expectations for the unemployment rate edged down from 11.3% to 11.2%, indicating consumers still see labor market conditions holding up relatively well.
| Indicator | Previous | Latest | Comments |
|---|---|---|---|
| Inflation Expectations (1 Year Ahead) | 4.0% | 4.0% | Unchanged, remains elevated |
| Inflation Expectations (3 Years Ahead) | 3.0% | 2.9% | Slight improvement |
| Inflation Expectations (5 Years Ahead) | 2.4% | 2.4% | Stable, still above ECB target |
| Inflation Uncertainty (1 Year Ahead) | Elevated | Elevated | No improvement |
| Economic Growth Expectations (Next 12 Months) | -2.1% | -2.2% | More pessimistic outlook |
| Unemployment Expectations (Next 12 Months) | 11.3% | 11.2% | Slight improvement |
USD/JPY Approaches 160.00: Is Another Intervention Coming?
USD/JPY continued its advance on Monday, reaching 159.46. The Japanese yen therefore remains under pressure near the key 160.00 level against the US dollar. This was the threshold that previously triggered currency market interventions by the Japanese authorities.
Data released on Friday confirmed that Japan spent JPY 11.7 trillion supporting its national currency at the end of April. As a result, the market received official confirmation of the large-scale intervention that traders had previously only suspected.
With the exchange rate approaching 160.00 once again, investors continue to assess the likelihood of further action from the Bank of Japan. The market remains divided over whether the central bank will opt for another interest rate increase this month. Uncertainty is being amplified by risks associated with the situation in the Middle East and its potential impact on the global economy.
Investor attention is now focused on upcoming speeches by Bank of Japan Governor Kazuo Ueda. His comments could provide fresh clues regarding the future direction of monetary policy.
Additional pressure on the yen came from disappointing corporate investment data. Capital expenditure by Japanese companies in the first quarter showed no growth compared with the previous year. This points to slowing business investment activity and raises concerns about the sustainability of domestic economic growth.
Technical Analysis
On the H4 chart, USD/JPY has formed a consolidation range around the 159.00 level. A breakout to the upside is developing a growth wave towards 159.77. We expect this target to be reached today, followed by a pullback towards 159.00. This scenario is supported by the MACD indicator, whose signal line remains above zero and is pointing firmly upwards, indicating potential for further gains.
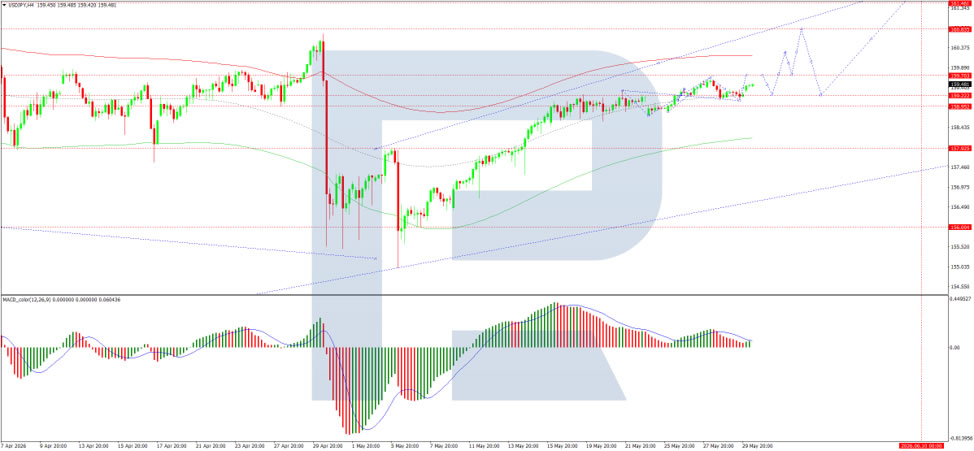
On the H1 chart, the market is forming an upward structure towards 159.60. A corrective move to 159.20 may follow before another advance towards 159.60 and potentially 159.77. The Stochastic oscillator supports this outlook, with its signal line above the 50 level and rising towards 80, suggesting that bullish momentum remains intact in the short term.
Conclusion
USD/JPY remains firmly supported as the yen struggles against weak domestic fundamentals and ongoing global uncertainty. With the pair approaching the critical 160.00 level, traders are increasingly focused on the risk of renewed intervention by Japanese authorities and any policy signals from the Bank of Japan.
Japan Spent ¥11.7 Trillion Defending USD/JPY 160. Traders May Test It Again This Week
For a few days in early May, it looked as though Japan had successfully pushed back against Yen weakness. The Ministry of Finance has now confirmed that impression came at a hefty cost. Official figures released Friday showed authorities spent ¥11.7 trillion supporting the currency after USD/JPY breached 160 during the Golden Week holidays. Yet with the pair already back near 159, markets are once again asking whether intervention can do more than temporarily slow the trend.
The challenge facing Japan is that the forces driving Yen weakness is broader than interest-rate differentials alone. A powerful AI-driven equity boom is attracting capital across the region, boosting demand for risk assets while reducing interest in traditional safe havens. The Nikkei's break above 67,000 this week highlighted that shift. SoftBank's announcement of a €75 billion AI infrastructure investment in Europe triggered a 14% surge in its share price and propelled the company past Toyota as Japan's most valuable listed firm. Similar AI enthusiasm has fueled fresh record highs in both South Korea's KOSPI and Taiwan's Taiex.
Against that backdrop, even further BoJ tightening may struggle to generate a lasting recovery in Yen. One or two additional rate hikes would narrow yield differentials only marginally, while investors continue to pour money into technology, semiconductors, and AI-related assets. The result is a market increasingly willing to fund risk positions through Yen, amplifying downward pressure on the currency.
The next major test could arrive this week. Traders know 160 is a politically sensitive level, but they also understand intervention is most effective when market moves appear detached from fundamentals. Strong US economic data would provide the opposite signal. If Friday's Non-Farm Payrolls report surprises to the upside, investors could use stronger growth and inflation expectations as justification for renewed Dollar buying.
That possibility places Japan in a difficult position. Officials may be forced to decide whether defending 160 remains worthwhile if the move is being driven by stronger US fundamentals rather than speculative flows. The more often the market returns to the same intervention level, the more likely traders become to question how aggressively authorities are willing to respond.
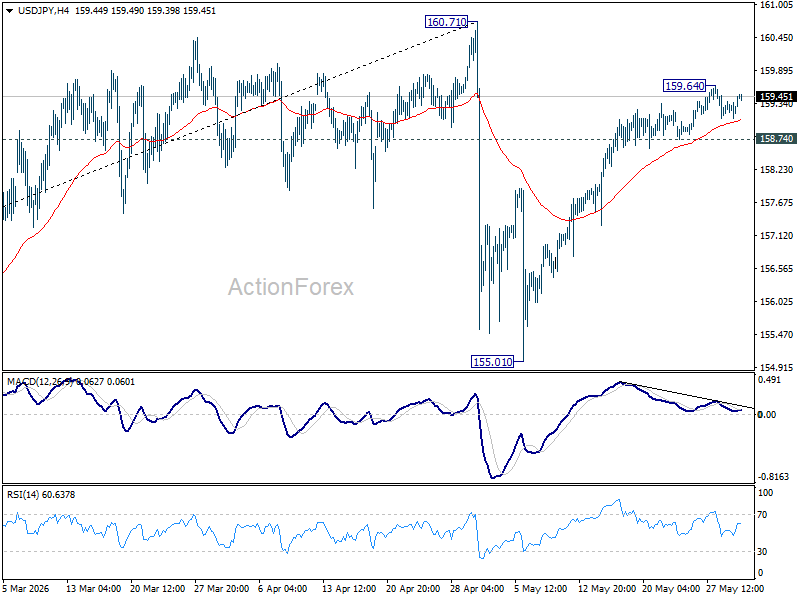
Technically, USD/JPY's rise from 155.01 is clearly losing momentum as seen in bearish divergence condition in 4H MACD. While further rally cannot be ruled out with 158.74 support intact, strong resistance should be seen from 160.71 to limit upside. On the downside, break of 158.74 support will suggest that the rebound from 155.01 has completed. The corrective pattern from 160.71 couild have then started the third, and target 155.01 again.
However, if 160 is cleanly and powerfully taken out, USD/JPY could quickly jump to the next possible "redline" at 165.
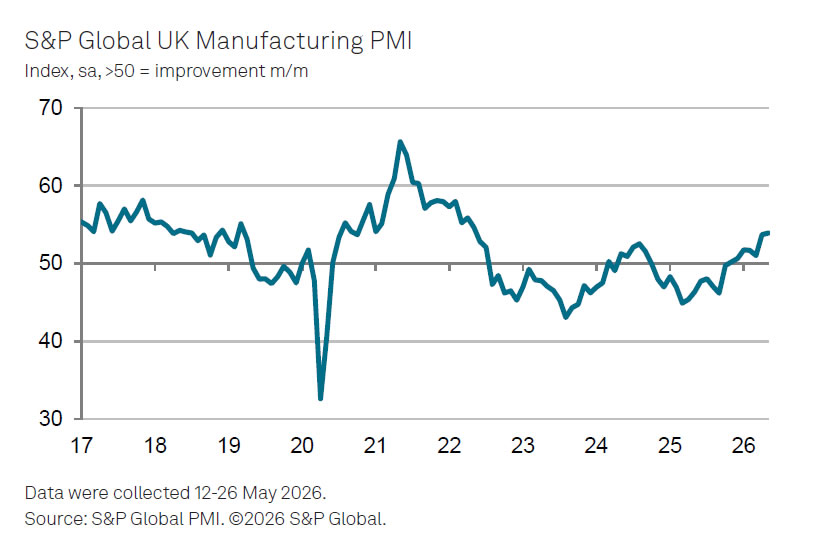
UK PMI Manufacturing at 53.9, Expansion Extends to Seven Months, but Sustainability Questioned
UK manufacturing activity continued to strengthen in May, with PMI Manufacturing finalized at 53.9, up from 53.7 in April and marking a seventh consecutive month of expansion. The latest survey showed production growth and business confidence both reached three-month highs, suggesting manufacturers have so far weathered the challenging global environment better than many had expected.
However, much of the recent strength appears linked to precautionary buying rather than a sustained improvement in underlying demand. According to S&P Global's Rob Dobson, manufacturers and their customers have been accelerating purchases to guard against potential price increases and supply disruptions stemming from the conflict in the Middle East. Dobson warned that the recent recovery in order books is "heavily reliant on both manufacturers and their clients front-loading purchases" and that the boost is likely to fade once firms have accumulated sufficient inventories.
The survey also highlighted mounting inflationary pressures. Manufacturers reported cost inflation rising to a near four-year high as supply-chain disruptions created material shortages and extended delivery times. Dobson noted that these challenges will continue to constrain the sector as long as geopolitical uncertainty, the conflict in the Middle East, and risks to key shipping routes such as the Strait of Hormuz persist. The data therefore point to a manufacturing sector that is still expanding, but one increasingly exposed to the same inflation and supply risks confronting economies across Europe.
| Indicator | Previous | Latest |
|---|---|---|
| PMI Manufacturing | 53.7 | 53.9 |
| Production Growth | Expansion | Three-month high |
| Business Optimism | Positive | Three-month high |
| New Orders | Improving | Improving |
| Inventory Building | Elevated | Elevated |
| Input Cost Inflation | High | Near 4-year high |
| Supply Chain Delays | Elevated | Elevated |
| Material Availability | Stable | Deteriorating |
| Demand Outlook | Positive | Uncertain |
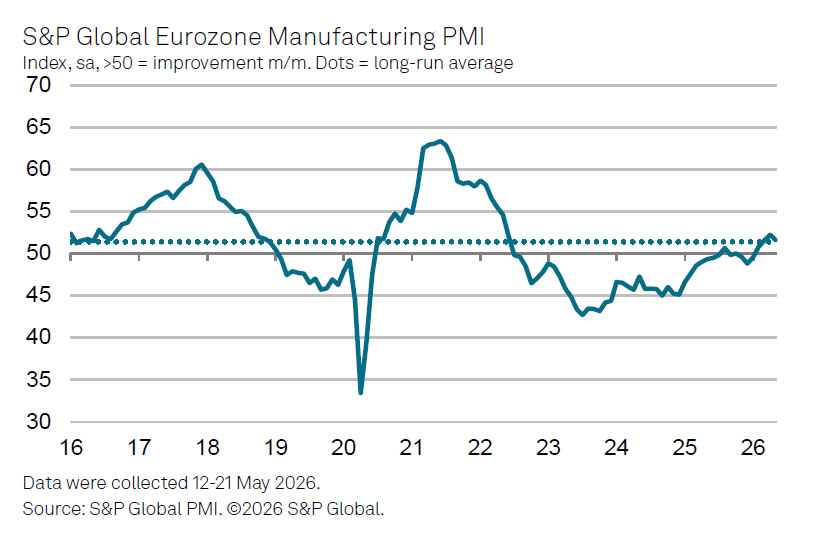
Eurozone PMI Manufacturing at 51.6, Growth Slows as Middle East Inflation Pressures Build
Eurozone manufacturing activity remained in expansion territory in May, but momentum softened as rising energy costs and supply disruptions linked to the Middle East conflict began weighing on the sector. PMI Manufacturing was finalized at 51.6, down from 52.2 in April, while the output index eased from 52.3 to 51.3. Although the figures marked a fourth consecutive month of expansion, they also suggest the recovery is losing some strength as inflation pressures intensify.
According to S&P Global's Chief Business Economist Chris Williamson, manufacturers are increasingly struggling under the impact of higher input costs and worsening supply chain conditions. He noted that energy and raw material prices surged again in May, driving the largest monthly increase in production costs in four years.
At the same time, supply-chain delays rose to their highest level since the pandemic-related disruptions of 2022, adding further pressure on firms. Williamson warned that factories are being forced to pass higher costs onto customers, a process that will "inevitably drive up inflation in the coming months."
The challenge for policymakers is that inflation and growth signals are moving in opposite directions. While higher costs strengthen the case for further ECB tightening, demand is already showing signs of fatigue. After three months of improvement, order books stalled in May as customers became more cautious in response to rising prices.
| Indicator | Previous | Latest |
|---|---|---|
| PMI Manufacturing | 52.2 | 51.6 |
| PMI Manufacturing Output | 52.3 | 51.3 |