
Sample Category Title
Australia Q1 GDP Grows 0.3% qoq, Misses Forecasts as Exports and Mining Drag Growth
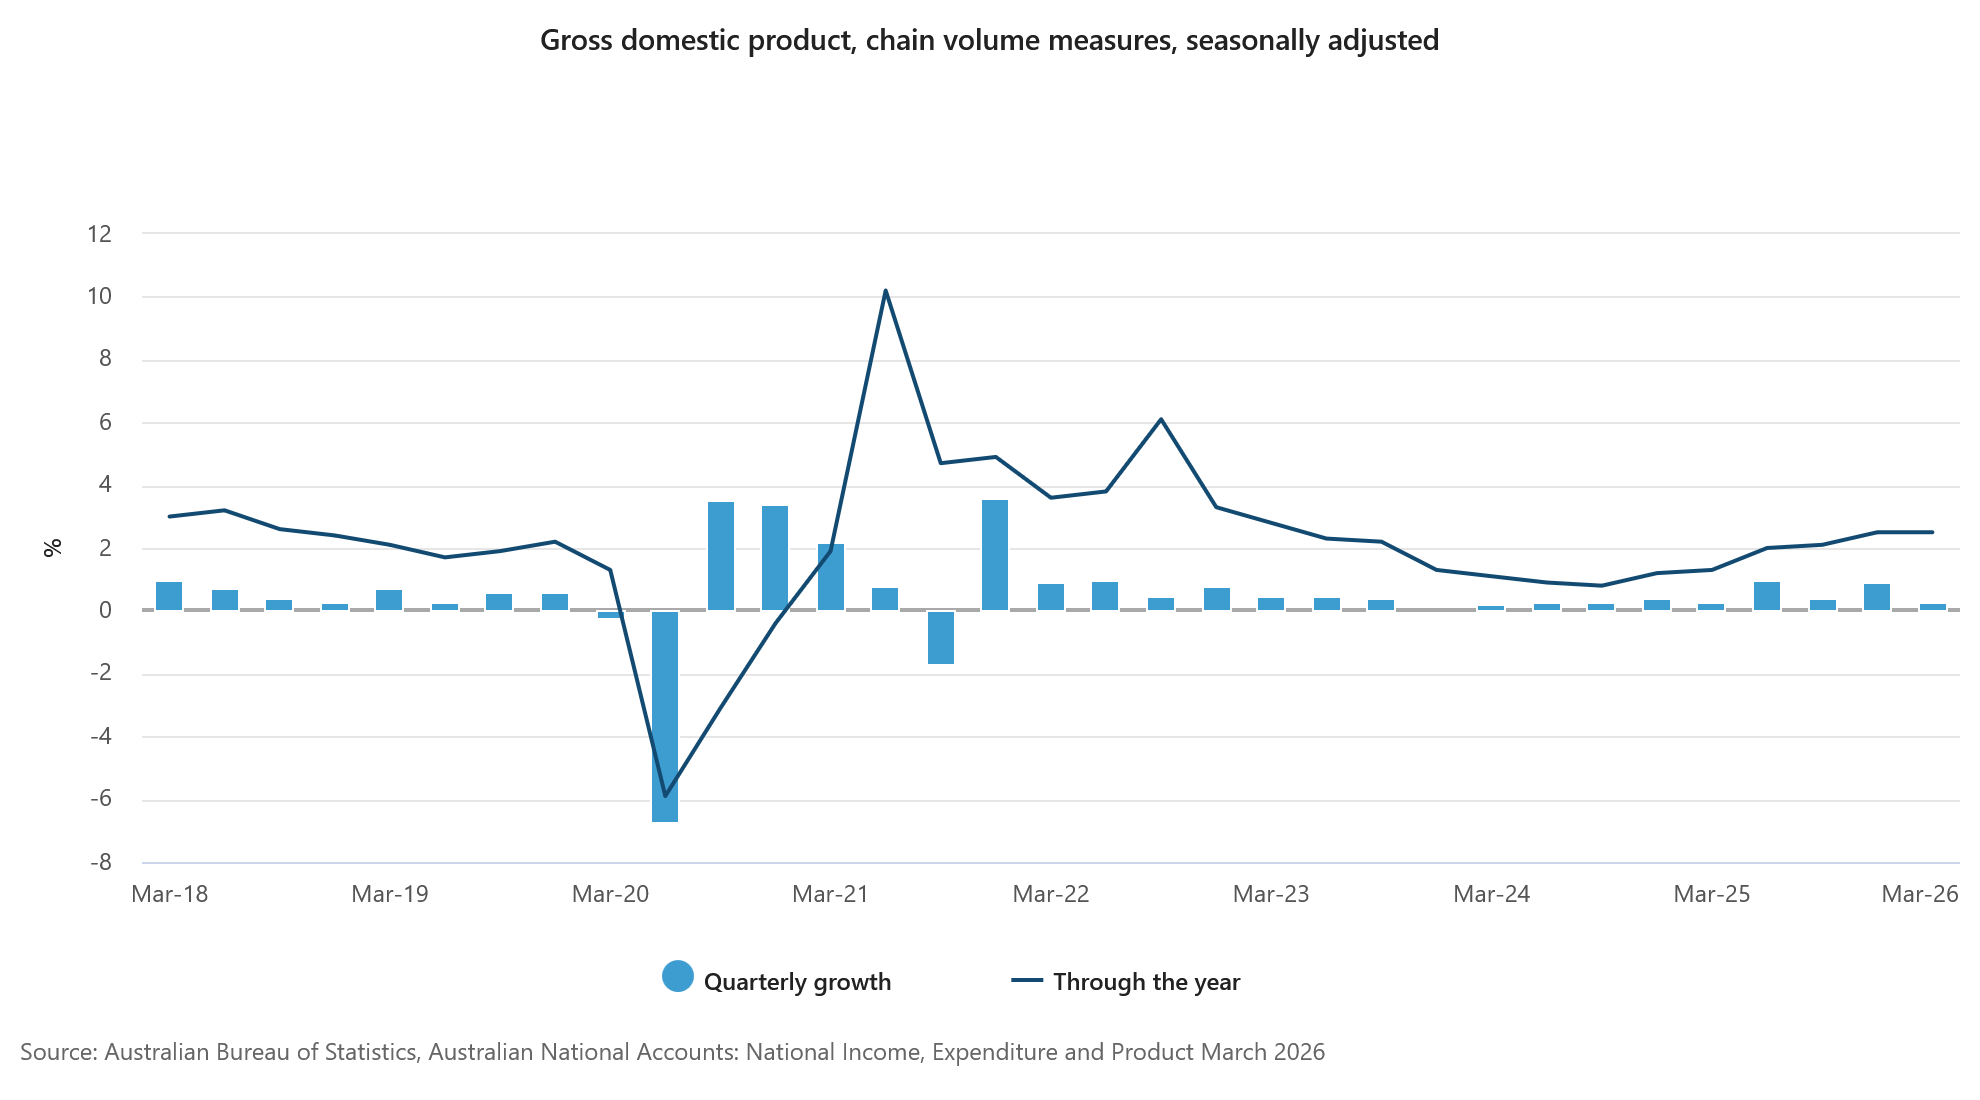
Australia's economy grew by just 0.3% qoq in the first quarter, missing expectations of 0.5% qoq and signaling a loss of momentum at the start of 2026. Annual growth held at 2.5%. According to the Australian Bureau of Statistics, weaker household spending, softer public expenditure and weather-related disruptions all contributed to the slowdown.
ABS Head of National Accounts Grace Kim said, "Economic growth slowed in the March quarter, with modest household and public sector expenditure as well as cyclone disruptions to mining and export activities."
A key drag came from the external sector. Exports fell -1.1%, the largest quarterly decline in two years, led by a -6.8% drop in coal exports and a -1.3% decline in mineral ores. Mining production fell -1.5%, while transport, postal and warehousing activity declined -1.3% as severe weather disrupted export-dependent industries. Combined with a 2.1% rise in imports, net trade subtracted a substantial -0.8 percentage points from GDP growth.
The brighter spot was business investment. Private investment rose 6.0%, driven by a remarkable 16.3% surge in machinery and equipment spending. Kim noted that investment in data centres across New South Wales and Victoria helped generate the largest increase in machinery and equipment investment in 30 years. However, much of the equipment was imported, limiting the positive impact on GDP.
| Indicator | Q4 2025 | Q1 2026 | Expectation |
|---|---|---|---|
| GDP Q/Q | 0.2% | 0.3% | 0.5% |
| GDP Y/Y | 2.6% | 2.5% | 2.7% |
| Component | Q1 2026 | Contribution / Comment |
|---|---|---|
| Household Spending | +0.5% | Supported by higher utility spending |
| Government Consumption | -0.2% | Weakest growth since Q3 2022 |
| Private Business Investment | +6.0% | Strongest area of the economy |
| Machinery & Equipment Investment | +16.3% | Largest increase in 30 years |
| Mining Production | -1.5% | Hit by cyclone disruptions |
| Transport, Postal & Warehousing | -1.3% | Impacted by weaker export activity |
Japan’s PMI Services Stagnates While Cost Pressures Surge
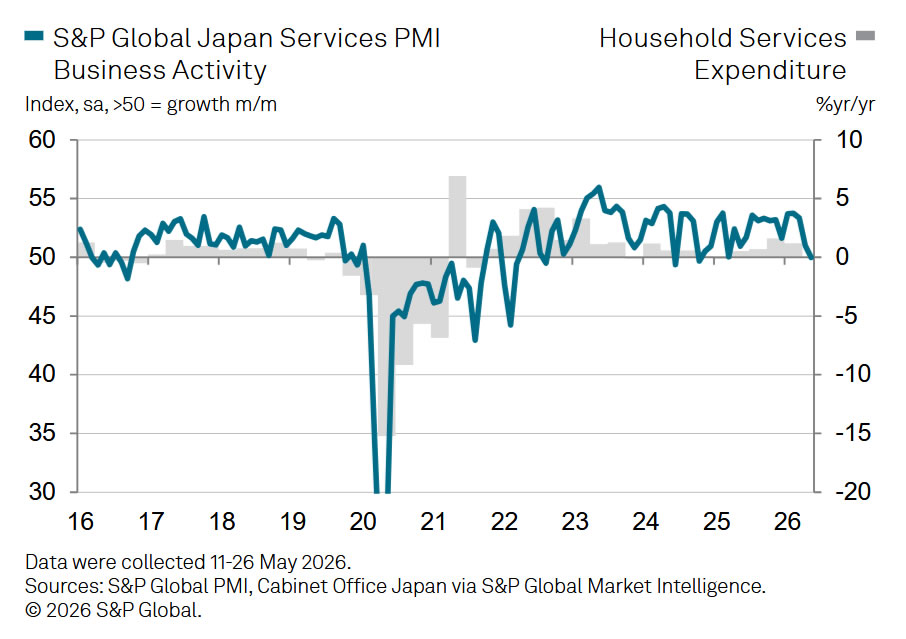
Japan's service sector lost momentum sharply in May as rising costs linked to the Middle East conflict weighed on business activity and household spending. PMI Services (final) fell from 51.0 to 50.0, indicating stagnation after more than a year of continuous expansion. PMI Composite eased from 52.2 to 51.1. The figures suggest the strong growth seen in the first quarter, which was confirmed by recent GDP data, is beginning to fade as the economy enters the second quarter.
According to S&P Global's Annabel Fiddes, the ongoing war in the Middle East is exerting increasing pressure on Japanese businesses through higher energy costs, supplier price hikes, labor expenses, and supply chain disruptions. She noted that price indicators pointed to a record increase in selling prices for goods and services alongside a near-unprecedented rise in business costs. Those higher prices are increasingly affecting demand, particularly in the services sector, as households face growing pressure on their budgets.
The survey suggests that overall private-sector growth is now being sustained primarily by manufacturing, where firms continue to build inventories as a precaution against future shortages and higher prices. However, Fiddes cautioned that this support may prove temporary once stockpiling activity fades. Looking ahead, she warned that much will depend on developments in the Middle East and their impact on global supply chains and inflation.
| Indicator | April | May |
|---|---|---|
| PMI Services Final | 51.0 | 50.0 |
| PMI Composite Final | 52.2 | 51.1 |
Bitcoin Plunges Under $70K As Bears Unleash Fresh Selling
Key Highlights
- Bitcoin declined heavily below $70,000 before the bulls emerged.
- A bearish trend line is forming with resistance at $72,500 on the 4-hour chart of BTC/USD.
- Ethereum remains in a bearish zone below $2,150.
- Gold could start another decline if it dips below $4,400.
Bitcoin Price Technical Analysis
Bitcoin price failed to stay above $75,000 against the US Dollar. BTC reacted to the downside below $72,000 and $70,000.
Looking at the 4-hour chart, the price settled below the $70,000 handle, the 100 simple moving average (red, 4-hour), and the 200 simple moving average (green, 4-hour). It even spiked below $67,500. If the bulls attempt a recovery wave, they could face resistance at $69,500 and the 23.6% Fib retracement level of the recent decline from the $77,988 swing high to the $66,925 low.
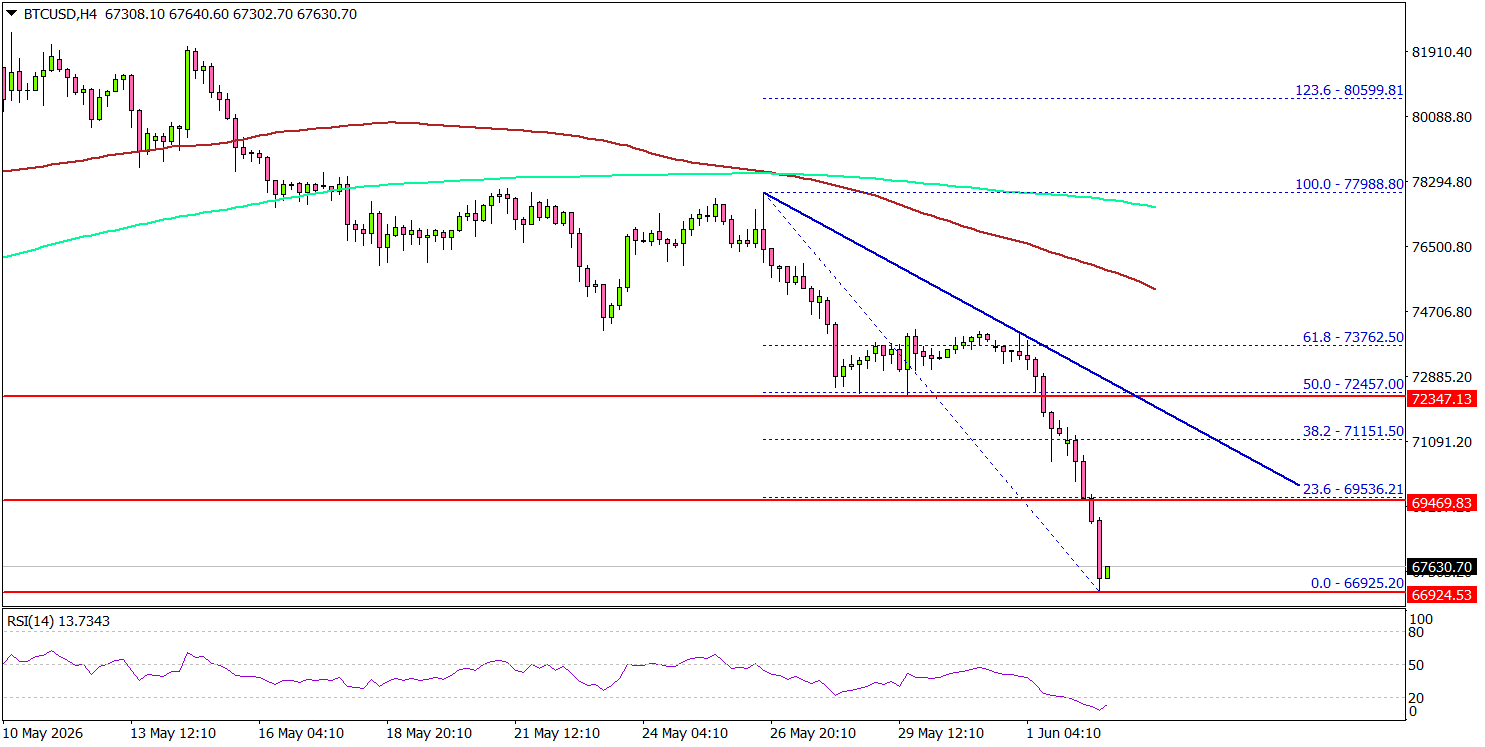
The first major resistance could be $71,200. The main resistance might be near the trend line at $72,500 and the 50% Fib retracement level of the recent decline from the $77,988 swing high to the $66,925 low.
A close above $72,500 could send the price toward $74,200. Any more gains might call for a test of $75,000. If there is a fresh decline, an immediate support might be $66,500.
The first key support could be $65,000. The main breakdown support could be $63,500. A downside break below $63,500 might start another decline. The next major support might be $60,000, below which BTC could decline toward $58,000.
Looking at Ethereum, the price also gained bearish momentum below $2,120 and remains at risk of more downside.
Today’s Key Economic Releases
- US S&P Global Services PMI for May 2026 – Forecast 50.9, versus 50.9 previous.
- US ISM Services Index for Feb 2026 – Forecast 53.8, versus 53.6 previous.
BTCUSD Extends Steep Fall Below Psychological 70K Support
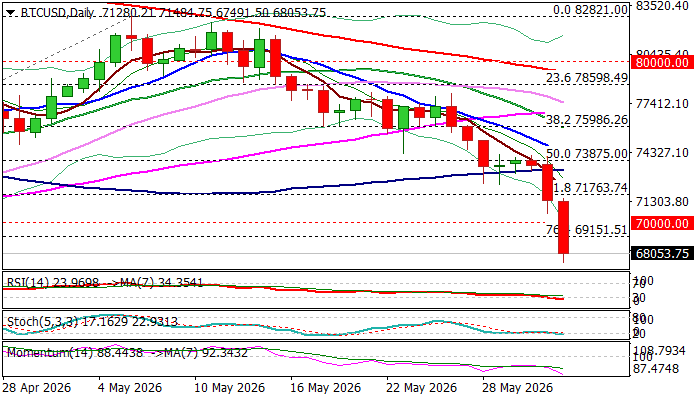
BTCUSD extends steep fall into second straight day, as bears accelerated after emerging below thick daily cloud on Monday (cloud base contained four consecutive attacks before break) to hit the lowest levels in nearly two months.
Fresh weakness broke psychological 70K support as well as Fibo level at 69151 (76.4% of 64929/82463 rally), with close below these levels to generate strong bearish signal for further drop.
Daily MAs turned into full bearish configuration (following Monday break of 100DMA) and formed several bear-crosses that contribute to weakening near-term structure, as negative momentum continues to strengthen.
Bears eye key short-term supports at 65500 and 65000 zone (lows of late March / early April), but oversold daily studies suggest that downtrend is likely to pause for consolidation before resuming.
Broken 70K level reverted to initial resistance which should ideally cap, with broken 100DMA (73252) and cloud base (73875) expected to limit extended upticks and keep larger bears in play.
Res: 69151; 70000; 73252; 73875
Sup: 67000; 66260; 65500; 65000
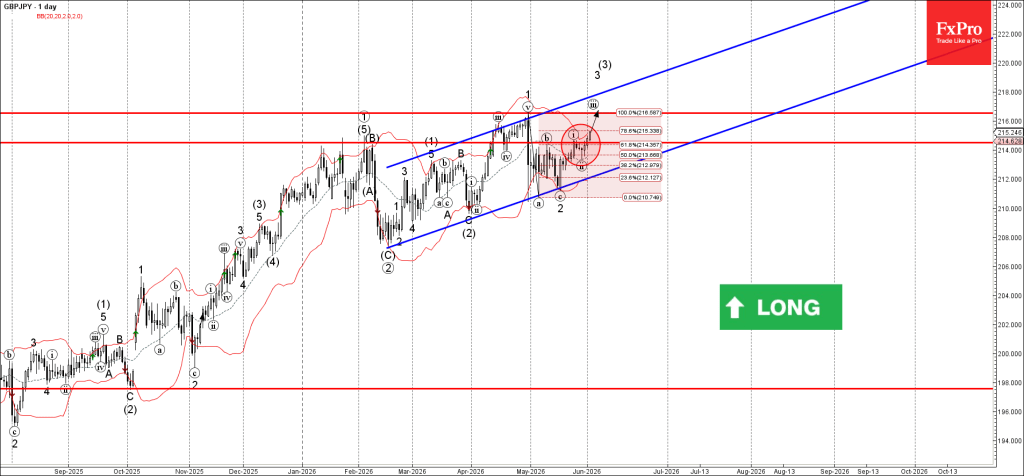
GBPJPY Wave Analysis
GBPJPY: ⬆️ Buy
- GBPJPY broke resistance level 215.00
- Likely to rise to resistance level 216.50
GBPJPY currency pair recently broke the resistance area between the resistance level 215.00 (which stopped the previous waves (b) and i) and the 61.8% Fibonacci correction of wave b from the start of May.
The breakout of this resistance area accelerated the active impulse waves 3 and (3).
Given the strong daily uptrend and the continuation of the bearish yen sentiment, GBPJPY currency pair can be expected to rise to the next resistance level 216.50 (top of the previous impulse wave 1).
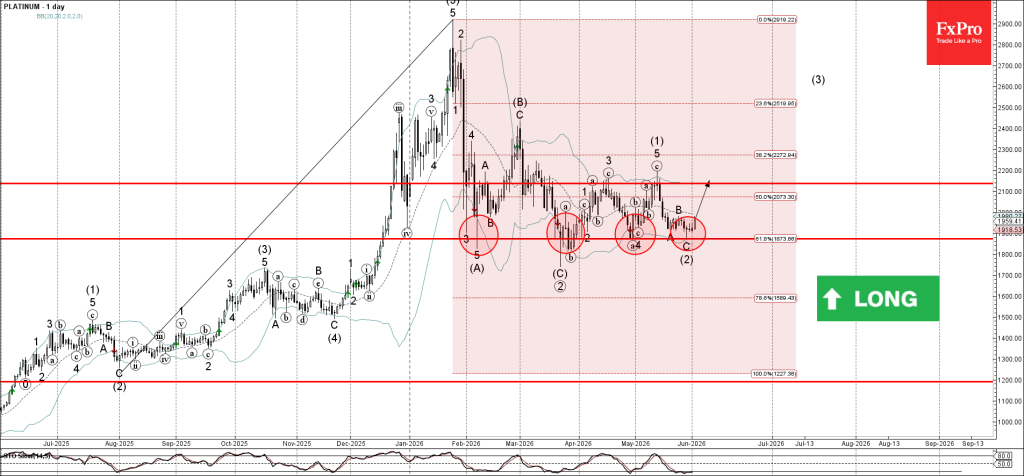
Platinum Wave Analysis
Platinum : ⬆️ Buy
- Platinum reversed from strong support level 1870.00
- Likely to rise to resistance level 2140.00
Platinum recently reversed from the support area between the strong support level 1870.00 (which has been reversing the price from February), 61.8% Fibonacci correction of the upward impulse from July and the lower daily Bollinger Band.
The upward reversal from this support area stopped the previous intermediate ABC correction (2).
Given the strength of the support level 1870.00 and the oversold daily Stochastic, Platinum can be expected to rise to the next resistance level 2140.00 (which stopped earlier waves 3 and (3)).
Eco Data 6/3/26
| GMT | Ccy | Events | Act | Cons | Prev | Rev |
|---|---|---|---|---|---|---|
| 22:45 | NZD | Building Permits Apr | 10.90% | -1.30% | -0.80% | |
| 22:45 | NZD | Terms of Trade Index Q1 | -2.00% | -2.00% | 3.70% | |
| 00:30 | JPY | Services PMI May F | 50 | 50 | 50 | |
| 01:30 | AUD | GDP Q/Q Q1 | 0.30% | 0.50% | 0.80% | 0.90% |
| 01:45 | CNY | RatingDog Services PMI May | 54.4 | 52.3 | 52.6 | |
| 07:50 | EUR | France Services PMI May F | 44.3 | 42.9 | 42.9 | |
| 07:55 | EUR | Germany Services PMI May F | 48.1 | 47.8 | 47.8 | |
| 08:00 | EUR | Eurozone Services PMI May F | 47.7 | 46.4 | 46.4 | |
| 08:30 | GBP | Services PMI May F | 49.3 | 47.9 | 47.9 | |
| 09:00 | EUR | Eurozone PPI M/M Apr | 0.60% | 0.40% | 3.40% | |
| 09:00 | EUR | Eurozone PPI Y/Y Apr | 4.90% | 4.80% | 2.10% | 2.00% |
| 12:15 | USD | ADP Employment Change May | 122K | 110K | 109K | 105K |
| 12:30 | CAD | Labor Productivity Q/Q Q1 | -0.50% | 0.70% | -0.10% | -0.30% |
| 13:45 | USD | Services PMI May F | 50.7 | 50.9 | 50.9 | |
| 14:00 | USD | ISM Services PMI May | 54.5 | 53.6 | 53.6 | |
| 14:00 | USD | Factory Orders M/M Apr | 4.80% | 4.60% | 1.50% | |
| 14:30 | USD | Crude Oil Inventories (May 29) | -8.0M | -2.9M | -3.3M | |
| 18:00 | USD | Fed's Beige Book |
| 22:45 | NZD |
| Building Permits Apr | |
| Actual | 10.90% |
| Consensus | |
| Previous | -1.30% |
| Revised | -0.80% |
| 22:45 | NZD |
| Terms of Trade Index Q1 | |
| Actual | -2.00% |
| Consensus | -2.00% |
| Previous | 3.70% |
| 00:30 | JPY |
| Services PMI May F | |
| Actual | 50 |
| Consensus | 50 |
| Previous | 50 |
| 01:30 | AUD |
| GDP Q/Q Q1 | |
| Actual | 0.30% |
| Consensus | 0.50% |
| Previous | 0.80% |
| Revised | 0.90% |
| 01:45 | CNY |
| RatingDog Services PMI May | |
| Actual | 54.4 |
| Consensus | 52.3 |
| Previous | 52.6 |
| 07:50 | EUR |
| France Services PMI May F | |
| Actual | 44.3 |
| Consensus | 42.9 |
| Previous | 42.9 |
| 07:55 | EUR |
| Germany Services PMI May F | |
| Actual | 48.1 |
| Consensus | 47.8 |
| Previous | 47.8 |
| 08:00 | EUR |
| Eurozone Services PMI May F | |
| Actual | 47.7 |
| Consensus | 46.4 |
| Previous | 46.4 |
| 08:30 | GBP |
| Services PMI May F | |
| Actual | 49.3 |
| Consensus | 47.9 |
| Previous | 47.9 |
| 09:00 | EUR |
| Eurozone PPI M/M Apr | |
| Actual | 0.60% |
| Consensus | 0.40% |
| Previous | 3.40% |
| 09:00 | EUR |
| Eurozone PPI Y/Y Apr | |
| Actual | 4.90% |
| Consensus | 4.80% |
| Previous | 2.10% |
| Revised | 2.00% |
| 12:15 | USD |
| ADP Employment Change May | |
| Actual | 122K |
| Consensus | 110K |
| Previous | 109K |
| Revised | 105K |
| 12:30 | CAD |
| Labor Productivity Q/Q Q1 | |
| Actual | -0.50% |
| Consensus | 0.70% |
| Previous | -0.10% |
| Revised | -0.30% |
| 13:45 | USD |
| Services PMI May F | |
| Actual | 50.7 |
| Consensus | 50.9 |
| Previous | 50.9 |
| 14:00 | USD |
| ISM Services PMI May | |
| Actual | 54.5 |
| Consensus | 53.6 |
| Previous | 53.6 |
| 14:00 | USD |
| Factory Orders M/M Apr | |
| Actual | 4.80% |
| Consensus | 4.60% |
| Previous | 1.50% |
| 14:30 | USD |
| Crude Oil Inventories (May 29) | |
| Actual | -8.0M |
| Consensus | -2.9M |
| Previous | -3.3M |
| 18:00 | USD |
| Fed's Beige Book | |
| Actual | |
| Consensus | |
| Previous | |
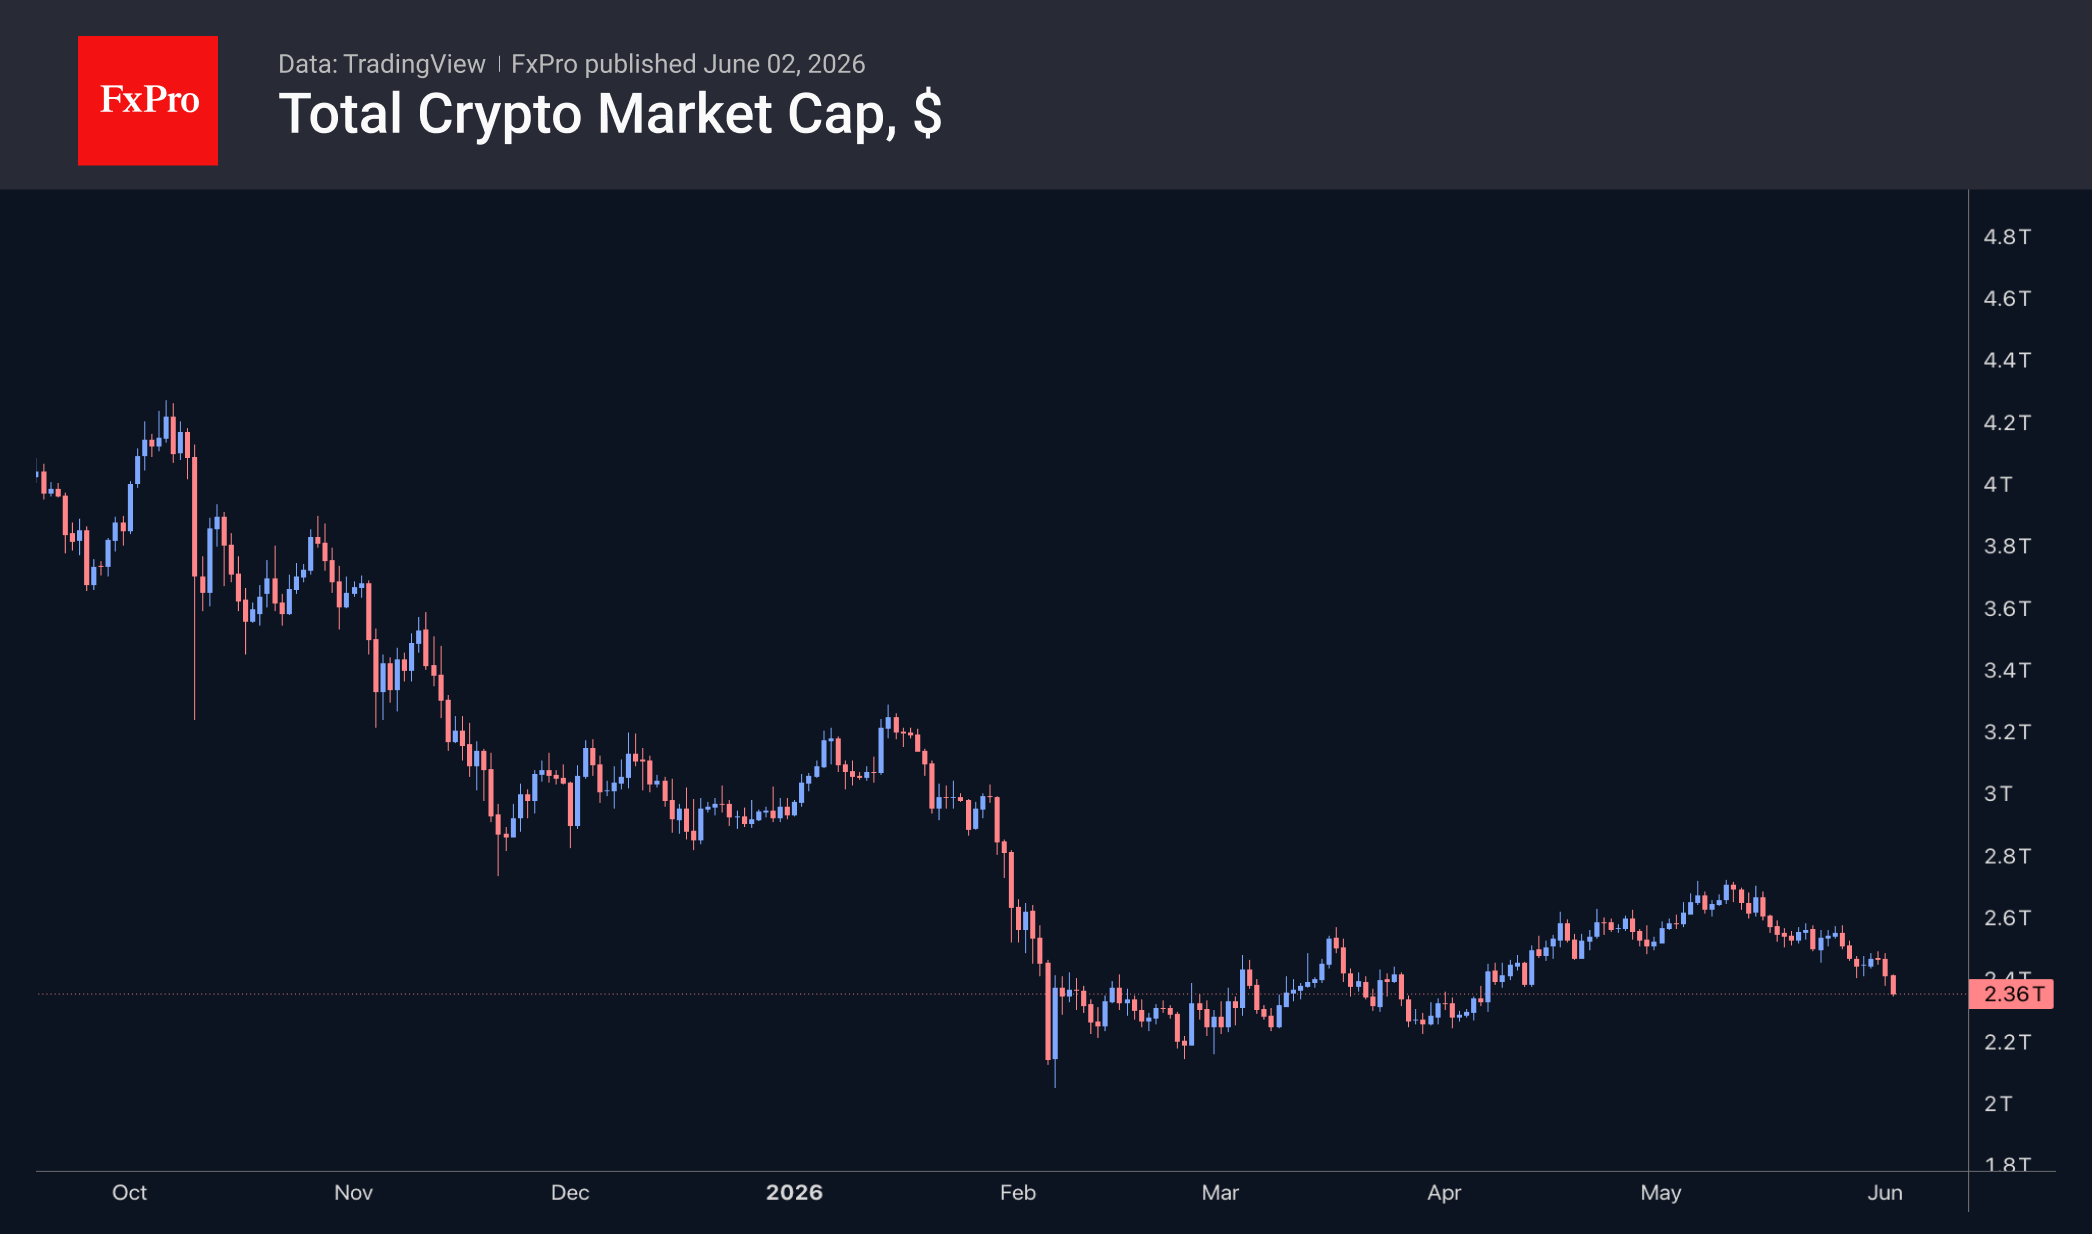
Bitcoin Losing Confidence of Major Holders
Market Overview
The crypto market capitalisation has been rapidly shrinking since the start of the new week, falling by 5% to $2.38 trillion, its lowest level since early April. It appears that confidence in the prospects of cryptocurrency has fallen sharply following reports of a largely symbolic BTC sale from Strategy’s balance sheet, which may be followed by more active selling from other holders.
We also cannot rule out an ‘Iranian connection’, as reports of seizures of Iranian cryptocurrency undermine the notion of anonymity and untraceability that has long underpinned the crypto market. The solid performance of supposedly anonymous coins fits neatly into this hypothesis. Thus, over the past 24 hours, the top performers have been NEAR Protocol (+14.8%), Internet Computer (+10.2%) and Zcash (+5%). The three worst performers are Stellar (-13.2%), Basic Attention Token (-10%) and Bitcoin (-4.3%).
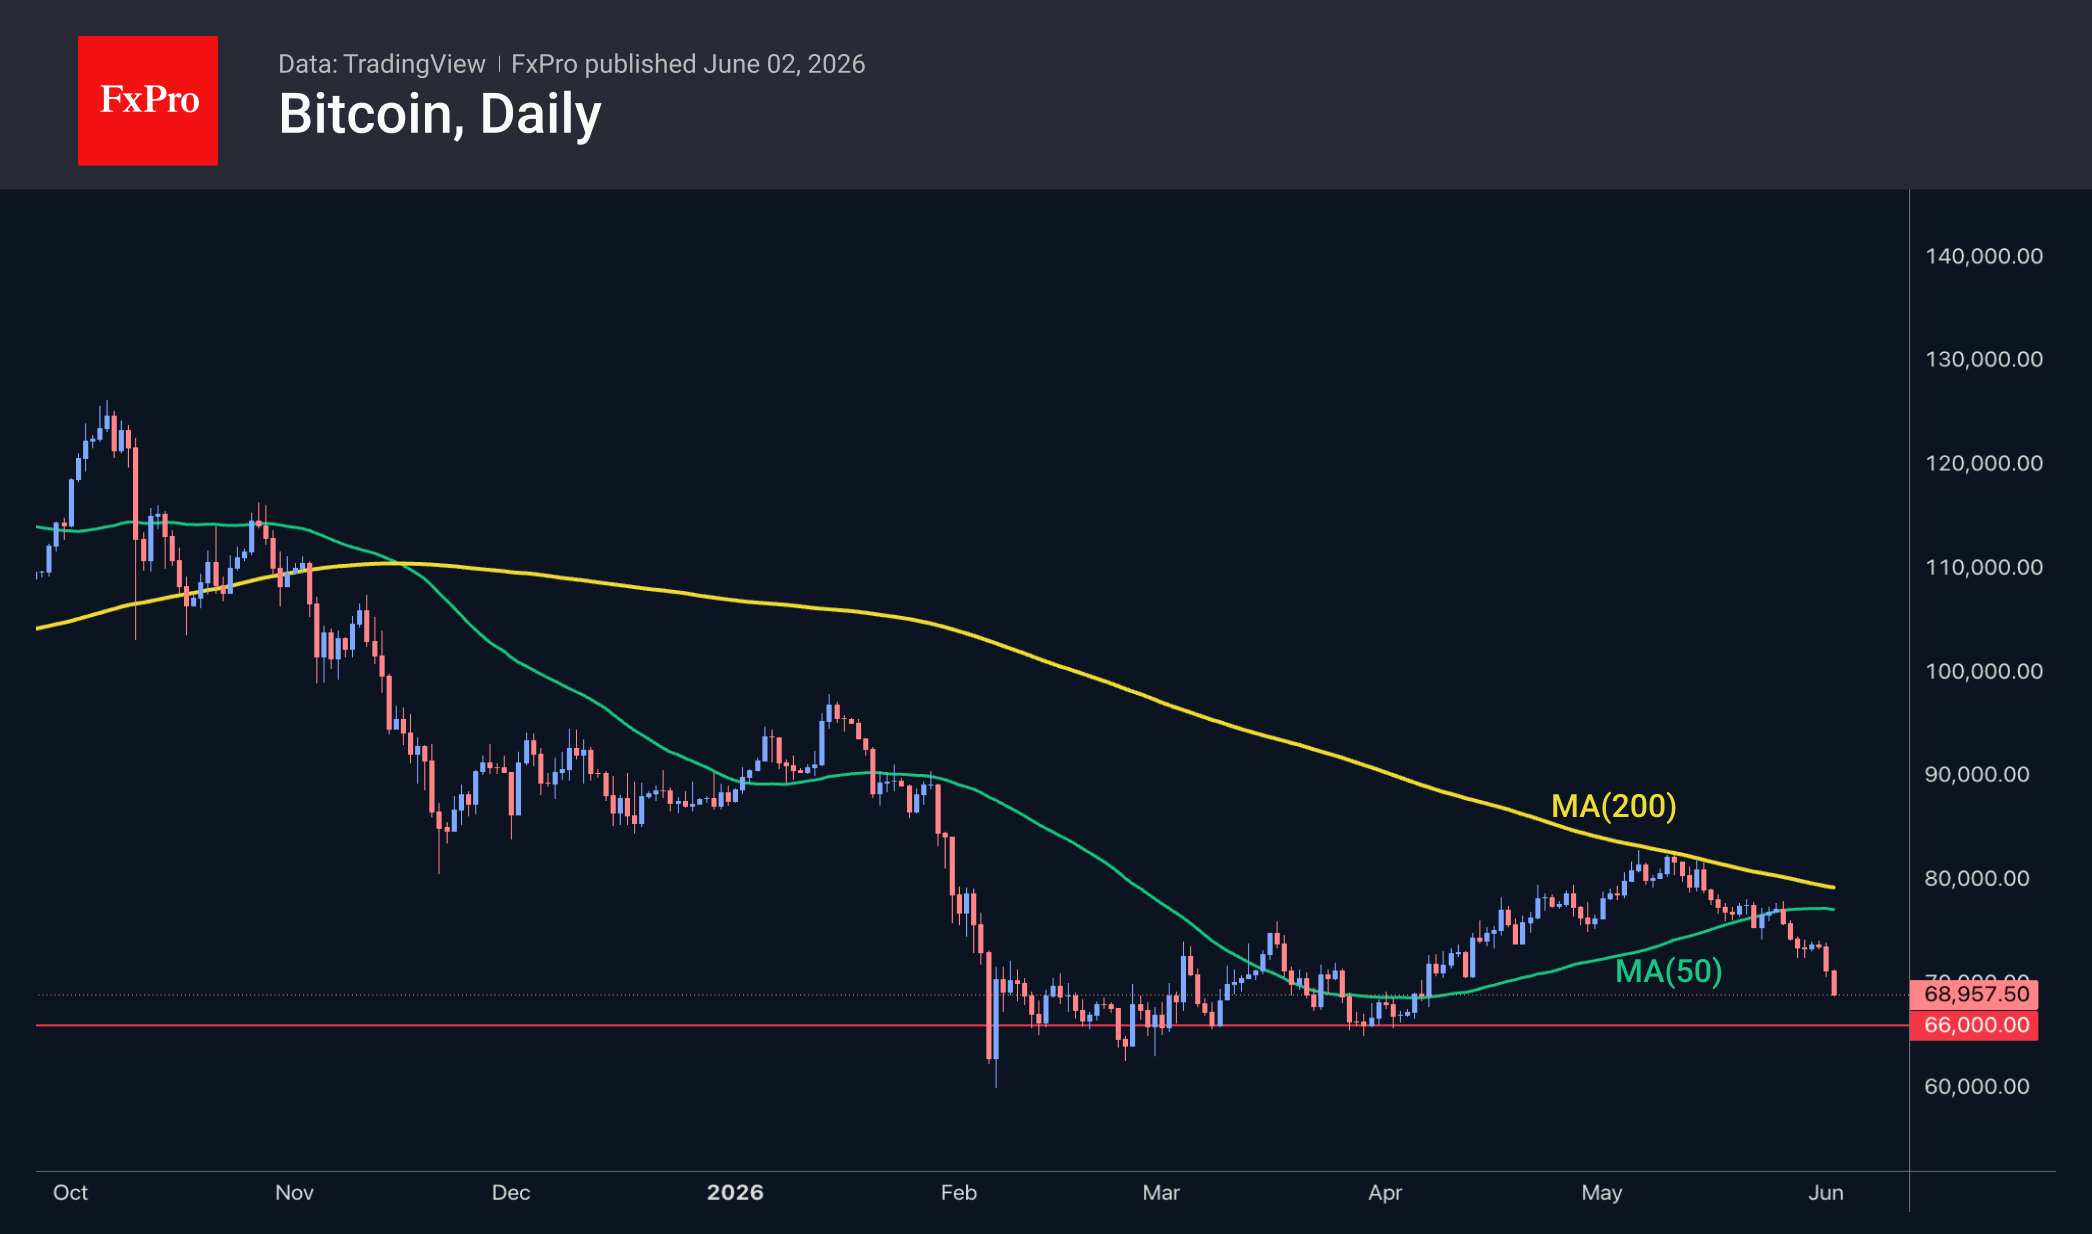
Bitcoin is accelerating its decline, having fallen to $69K, even though it started the week just above $74K. As expected, the drop below the 50-day moving average a week ago followed more than a week of selling pressure at that level. Technically, the leading cryptocurrency faces relatively few obstacles on its way down to the $65-66K range, but further down, longer-term support may come into play, having halted the decline in February and March.
News Background
According to CoinShares, global investment in crypto funds fell by $1.671 billion last week, marking the largest outflow since January. Investments in Bitcoin fell by $1.438 billion (the largest outflow from BTC this year), in Ethereum by $257 million, in Solana by $1 million, and in Sui by $1 million. Investments in altcoins rose by $20 million in XRP, $11 million in Hyperliquid, and $8 million in Near.
Sentiment towards Bitcoin on social media has reached its most positive level since the start of the year, despite the crypto market’s decline in May, Santiment notes. In the past, such surges in optimism have often coincided with local price highs for the asset.
Strategy has sold Bitcoin for the first time since 2022. Last week, 32 BTC were sold for approximately $2.5 million at an average price of $77,135 per coin. The largest corporate holder of Bitcoin, which had previously promised never to sell the asset, will use the proceeds to pay dividends on preference shares.
As a result of the latest adjustment, Bitcoin’s mining difficulty rose by 1.72% to 138.96 T. The figure has returned to its April highs.
Telegram founder Pavel Durov has renamed the cryptocurrency Toncoin (TON) to Gram (GRAM), describing the rebranding as a return to its roots. The blockchain will retain the name TON (The Open Network). No action is required from token holders.
Sunset Market Commentary
Markets
EMU May flash CPI data were close to/tentatively higher than expected, rubberstamping expectations for the ECB to raise its policy rate next week by 25 bps. Headline inflation increased 0.1% m/m and 3.2% Y/Y, the first time the measure printed north of 3% since September 2023. Core inflation (2.5% from 2.2%) and the by the ECB closely monitored services inflation (3.5% from 3%) were slightly higher than expected. Food price inflation slowed (0.0% M/M and 2% from 2.4%Y/Y). Energy prices eased slightly in a monthly perspective (-1.1%) but remain substantially higher Y/Y (10.9%). The data hardly changed market expectations on the ECB rate path throughout summer with a June rate hike 95% discounted and a next step in September 90% discounted. Markets currently apparently see two 25 bps ECB rate hikes as a good balance to show determination to clamp down inflation and maintain credibility and at the same time avoid unnecessarily hurting growth. A more aggressive stance might still be needed if the conflict in the Middle East drags on and/or supply disruption filters through deeper and longer than expected. However, maybe for now it’s a bit too early for investors to play this card as long as oil holds south of $100/b. The post-September era in the current environment whatsoever is a very long call. In the meantime, global (interest rate) markets are still ‘conditioned’ by the ‘deal/no-deal’ headline sequence. After a rise in oil, yields and the dollar yesterday on Iran reportedly suspending negotiations due to Israel’s military operations in Lebanon, sentiment today again is a bit milder as President Trump late yesterday suggested negotiations can still continue as he asked Israeli Prime Miniter Netanyahu not to go into a major raid on Beirut. Confusion on the hart of the matter remains high. Even so, hope still was enough for oil to reverse most of yesterday’s rebound (Brent currently $94/b). EMU swap yields in this process also eased back between 2 bps (2-y) and 3.5 bps (10-y). US yields also followed this trend, be it at a distance, easing 1-2 bps. US yields are still a bit less affected by the geopolitical narrative and US data apparently might again have a slightly bigger role to play. Especially if this week’s data (Labour market and ISM’s) show ongoing resilience of the US economy. Combined with inflation further drifting away from target, it reinforces the case for the Fed to leave its easing bias and maybe even to raise its policy rate somewhere further down the down the road. This position today at least was endorsed by Fed’s Hammack. No big moves in the major USD cross rates. EUR/USD hover near 1.165. USD/JPY (159.75) is inching ever closer to the 160 (intervention?) reference.
News & Views
The UK’s Office for Budget Responsibility (OBR) said it’ll take into account the sticky inflation experience from 2022’s energy crunch when it updates its forecasts later this year. Since inflation back then came in higher than the OBR expected, this suggests an upward revision to the projections is likely. The previous set was released on March 3 and hadn’t factored in the Iran crisis yet. The OBR forecasts determine how much leeway the UK government has for public spending while staying compliant with the self-imposed fiscal rules and draw close attention from (bond) markets. The £24bn estimated room for maneuvering is bound to be lower in an unchanged policy scenario.
The ECB in its annual assessment said the euro’s international role had risen moderately in 2025. The euro’s share across a broad set of indicators of international use rose to around 20%, continuing a gradual but steady upward trend observed since Russia’s invasion of Crimea in 2014, the ECB reported. It repeated president Lagarde’s end-May 2025 call for the euro to seize the opportunity to enhance its global appeal. European policymakers to that end need to reinforce the three key pillars that underpin its potential: economic resilience, legal and institutional integrity and geopolitical credibility. The annual report also noted that issuance of international debt in euro reached its highest level since the introduction of the single currency, rising by around 30% compared with 2024 to close to €1tn. In addition, the euro became the leading currency in the green and sustainable international bond market for the first time while foreign portfolio inflows to the euro area were close to historical highs. But the ECB also warned for fragmentation that could hamper the euro’s aspired rise to dominance. Gold, for one, is still being bought in large quantities, with its share in FX reserves even surpassing that of US Treasuries (also due to valuation effects, though). Several countries are also advancing digital technology-based alternatives to traditional cross-border payments. Finally, the central bank stressed that the use of the Chinese renminbi is still low overall but gaining traction in other areas such as daily FX-trading and trade financing.
Hammack Warns Fed May Need to Act Soon as Inflation Moves Higher
Federal Reserve Bank of Cleveland President Beth Hammack delivered one of the more hawkish messages from a Fed official in recent weeks, warning that inflation risks are becoming increasingly difficult to ignore. While she stopped short of advocating an immediate rate hike, Hammack said the central bank may need to respond if current inflation trends persist. "If recent trends continue, it may soon be appropriate to act," she said, even as she acknowledged that holding rates steady for now remains a reasonable course.
A key concern for Hammack is that inflation pressures are broadening rather than fading. She argued that "inflation is too high and is moving higher," pointing to rising costs across goods and services as well as higher energy prices stemming from disruptions linked to the Iran conflict. According to Hammack, "there is a growing risk that inflation could remain elevated" if businesses continue passing higher costs through to consumers. She also questioned whether current policy settings are restrictive enough, saying she is increasingly concerned that monetary policy "may not be sufficiently restrictive to bring inflation down to 2 percent."
The remarks suggest that inflation has once again become the dominant concern inside parts of the Fed. Hammack explicitly said she is "more concerned about the growing risks of persistently elevated inflation than the risks to full employment," a notable statement given recent debates about growth and labor market conditions. With unemployment still near full-employment levels and financial conditions supportive of activity, the hurdle for discussing rate cuts remains extremely high. Instead, markets may need to pay closer attention to the possibility that the Fed's next move, while not imminent, could eventually be another hike.