
Sample Category Title
Swiss Inflation Misses Expectations, unchanged at 0.6% in May
Swiss inflation remained subdued in May, underscoring the country's unique position at a time when many major economies are grappling with renewed price pressures. Headline CPI held steady at 0.6% yoy, missing expectations for an increase to 0.8% yoy. Core inflation was also unchanged at 0.6% yoy, suggesting underlying price pressures remain remarkably contained despite rising energy costs and inflation concerns elsewhere in the global economy.
The monthly figures painted a similar picture. CPI rose 0.2% mom, below expectations of 0.3% mom, while core prices increased just 0.1% mom.
Domestic product prices showed some modest firming, rising 0.6% yoy from 0.5% yoy previously, while imported product inflation eased from 0.9% yoy to 0.7% yoy. On a monthly basis, imported prices actually fell by -0.1%, a sharp contrast to April's 1.5% increase.
The data reinforce the Swiss National Bank's view that price stability remains intact. Switzerland continues to enjoy one of the lowest inflation rates in the developed world. With headline and core inflation both anchored at 0.6%, markets are likely to maintain expectations that the SNB will keep its policy rate unchanged at 0% for the remainder of the year.
| Indicator | April | May | Expectation |
|---|---|---|---|
| CPI Y/Y | 0.6% | 0.6% | 0.8% |
| Core CPI Y/Y | 0.6% | 0.6% | — |
| CPI M/M | 0.3% | 0.2% | 0.3% |
| Core CPI M/M | 0.0% | 0.1% | — |
| Component | April | May |
|---|---|---|
| Domestic Product Prices M/M | -0.1% | 0.2% |
| Domestic Product Price Y/Y | 0.5% | 0.6% |
| Imported Product Prices M/M | 1.5% | -0.1% |
| Imported Product Prices Y/Y | 0.9% | 0.7% |
More US Jobs Data to Fuel Fed Hike Speculation
In focus today and Friday
In the US, the May Challenger Report for layoff announcements is due. While AI-driven layoffs have increased so far in 2026, the overall number of cuts has remained modest in historical context.
In Sweden, May flash CPI will be published. Our forecast is that core inflation will be 0.22% y/y, CPIF 1.28% y/y and CPI 0.5% y/y. We do not yet expect any clear increase in underlying inflation as a result of the conflict in the Middle East. From 1 May, the tax on fuel was reduced by SEK 1, which is partly restraining the increase in energy prices.
In the US on Friday, the May Jobs Report is released in the afternoon. We forecast nonfarm payrolls at +110k, slightly above consensus, the unemployment rate at 4.2%, and average hourly earnings at 0.3% m/m. A solid report could tilt the Fed's balance of risks further towards a tightening bias.
In the euro area on Friday, focus turns to the third estimate of Q1 GDP, which will also include the ECB's preferred wage measure, compensation per employee. The first indicators for Q1 point to easing wage pressures, which is putting a downward pressure on services inflation amid the energy shock.
Economic and market news
What happened overnight
In Japan, Bank of Japan Governor Ueda signalled that "we must discuss the pros and cons of raising the policy rate if we judge that upside risks to prices outweigh downside risks to economic activity," effectively cementing market bets on a June rate hike. This marks a shift toward more conventional inflation-targeting with scope for more frequent and possibly faster rate increases.
In the US-Iran war, Israel and Lebanon agreed to implement a US-brokered ceasefire, contingent on Hezbollah halting all attacks and withdrawing from southern Lebanon. The deal follows an earlier failed April ceasefire and continued heavy fighting and displacement in Lebanon, leaving the truce fragile.
What happened yesterday
In the US, ADP's National Employment Report for May landed close to expectations at 122k (cons: 117k), but it was noteworthy how the jobs growth was very broad-based across sectors and firm sizes. Moreover, the ISM services index ticked higher to 54.5 (cons: 53.8, prior: 53.6), driven largely by accelerating growth in new orders. The prices subindex reached its highest level since August 2022, while higher oil prices add to the upside risks for inflation.
Against this backdrop, Fed member Lorie Logan noted she is increasingly concerned that higher interest rates could be necessary later this year, echoing recent similar language from other FOMC participants. We continue to expect Fed hikes in December and March and forecast EUR/USD trending lower towards 1.12 over the coming year.
In the euro area, the final May services PMI was revised significantly up to 47.7 from 46.4 in the flash estimate, lifting the composite PMI to 48.5 from 47.5. While still in contractionary territory and pointing to weak underlying activity, the outturn is less negative than suggested by the flash release. Yesterday we published an updated forecast for the euro area economy. We expect near-term stagnation with real GDP at 0.0% q/q in Q2 and 0.1% q/q in Q3 before a rebound from Q4 and have revised down our 2026 growth outlook to 0.7% y/y due to higher energy costs. Read more in Nordic Outlook - Ripple effects from the Strait, 3 June.
In Sweden, services PMI increased to 53.9 in May from 52.6, while the composite PMI rose to 54.9 from 53.9. New orders increased, and delivery times rose to 65.7. Longer delivery times contribute positively to the PMI as they normally tend to reflect strong demand. However, it is reasonable to assume that the current increase in delivery times is instead driven by supply chain disruptions. Prices increased to 80.1, which is historically very high and has been at a similar level only during 2021/2022.
In the oil market, US commercial crude stocks fell by 8 million barrels in the week ending 29 May to 433.7 million barrels (about 3% below the five‑year average), even though a further 8 million barrels were released from the Strategic Petroleum Reserve into the market. Taken together, this implies a roughly 16 million‑barrel weekly draw across commercial and strategic crude holdings - a very large draw that helps ease the supply disruption from the Middle East.
Equities: Equity markets fell yesterday, not because macro data disappointed, quite the opposite, but partly on negative news from the Middle East and a further rise in oil prices.
In our view, however, the pullback should be seen just as much in the context of the exceptionally strong rally over recent months. A modest setback does not change the underlying direction or the broader sentiment picture. When a rally has been so heavily led by tech and AI, a negative surprise from Broadcom will typically be enough to trigger some profit-taking. That looks more like a pause than a change in trend.
The fact that small caps outperformed large caps on a negative day is also telling. Right now, the market direction and the rotation beneath the surface remain heavily dependent on what happens in tech.
Most Asian markets are lower this morning, while European and US futures are also trading in negative territory.
FI and FX: Energy prices rose yesterday amid renewed tensions in talks between US and Iran. The price increase pushed up rates and yields in both the US and the euro area with the 10Y US Treasury yield inching back towards 4.50%. The USD outperformed the rest of the G10 with EUR/USD falling to 1.16, USD/JPY rising to 160 and USD/SEK climbing above 9.40.
RBA’s Bullock Warns Second-Round Inflation Risks Are Emerging
RBA Governor Michele Bullock said there are growing signs that higher interest rates are helping to slow domestic inflation pressures, but warned that rising fuel costs linked to the Middle East conflict are creating a new challenge for policymakers. Speaking before the Senate Economics Committee, Bullock noted that "we've already seen some signs that this tightening is starting to work," while cautioning that the full effects of recent rate increases could take "around one to two years" to flow through the economy.
At the same time, Bullock stressed that monetary policy cannot reverse inflation that is already being driven by higher oil prices. "The recent increases in interest rates will have no impact on the increase in inflation already in train following the increases in the prices of oil and related commodities," she said. Instead, the role of higher rates is to "help to contain the domestic inflationary pressures and second-round effects from higher oil and commodity prices."
Bullock highlighted evidence that the process may already be underway. She noted that inflation accelerated in the second half of 2025 before receiving another boost from fuel-price increases following the outbreak of the Middle East conflict earlier this year. More importantly, she warned that "higher fuel-related costs may have been passed through into the cost of other goods and services, including new dwelling costs," adding that "there are indications that there are likely to be second-round effects on the prices of goods and services more broadly." The remarks reinforce the RBA's concern that while domestic demand pressures may be easing, the fight against inflation is far from over.
EUR/CHF and GBP/CHF Gain Breakout Momentum as US-Iran Stalemate Keeps Oil Elevated
Swiss Franc has emerged as one of the weakest major currencies this week. As US-Iran negotiations drag on without a clear resolution, markets are steadily pricing out a swift agreement. Brent crude remains well above $90 and is threatening a return to triple-digit territory. While the situation has not escalated into a broader regional conflict, the persistence of high energy costs is increasingly feeding inflation concerns across Europe and North America.
This is where Switzerland's problem begins. For the ECB, BoE, and even the Fed, oil above $90 is a policy headache. Every week that energy prices stay elevated increases the risk that businesses pass higher costs on to consumers, workers demand higher wages, and inflation becomes embedded again. Central bankers across Europe are increasingly talking about "second-round effects" and the need to act preemptively. Markets are now treating a June ECB hike as almost certain and continue to debate how many additional hikes could follow. Even the Fed is seeing growing discussion about whether another increase might eventually be needed.
The SNB, by contrast, is living in a different world. May CPI to be released today is expected at just 0.8%. Not 2.8%. Not 3.8%. Just 0.8%. That number would still sit comfortably within the SNB's target range and near the lower end of what policymakers consider desirable. While other central banks are worrying about inflation becoming entrenched, the SNB is worrying about almost nothing at all. Chairman Martin Schlegel has signaled this week that medium-term inflation pressures remain broadly unchanged and that price stability is maintained.
Quick update: Swiss CPI was unchanged at 0.6% yoy in May, below expectation of 0.8% yoy. More.
Ironically, that stability is becoming a weakness. Currency markets reward central banks that are expected to tighten. They punish central banks that have no reason to do anything. Every additional day of elevated oil prices strengthens the argument for tighter policy elsewhere while reinforcing expectations that the SNB can remain comfortably parked at 0.00%. In effect, the US-Iran stalemate is widening monetary-policy divergence even without a single additional missile being fired.
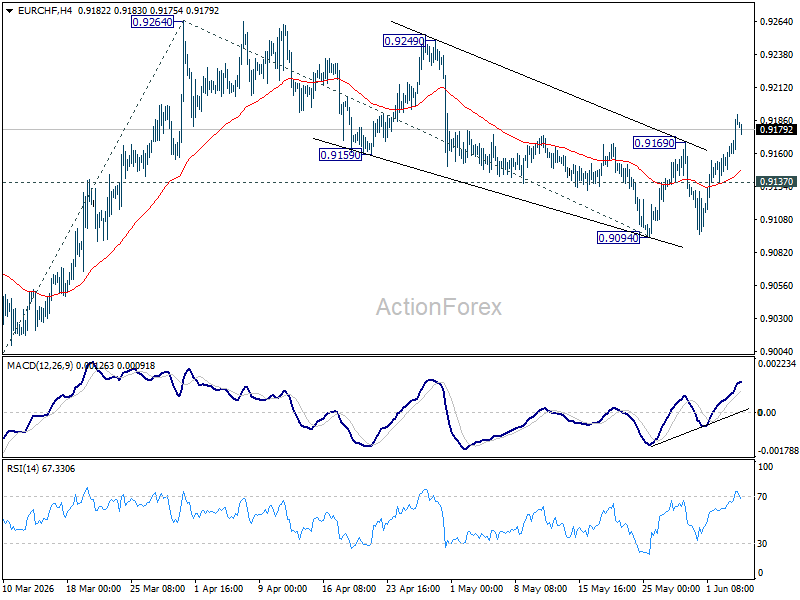
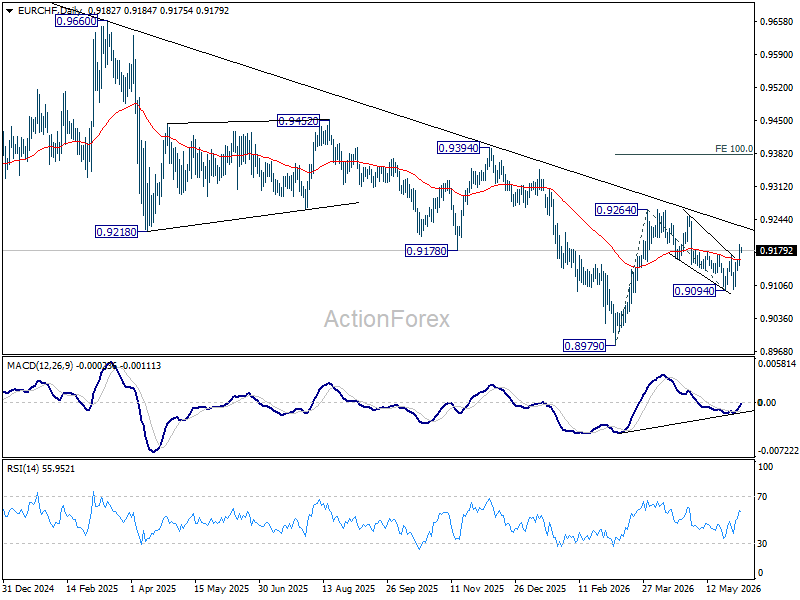
That divergence is increasingly showing up in the charts. EUR/CHF's break above 0.9169 resistance suggests the pullback from 0.9264 has already completed at 0.9094. As long as 0.9137 minor support holds, a retest of 0.9264 should be seen. Firm break there resume the rally from 0.8979 and target 100% projection of 0.8979 to 0.9264 from 0.9094 at 0.9379. Break of 0.9137, however, will dampen this bullish view and mix up the outlook.
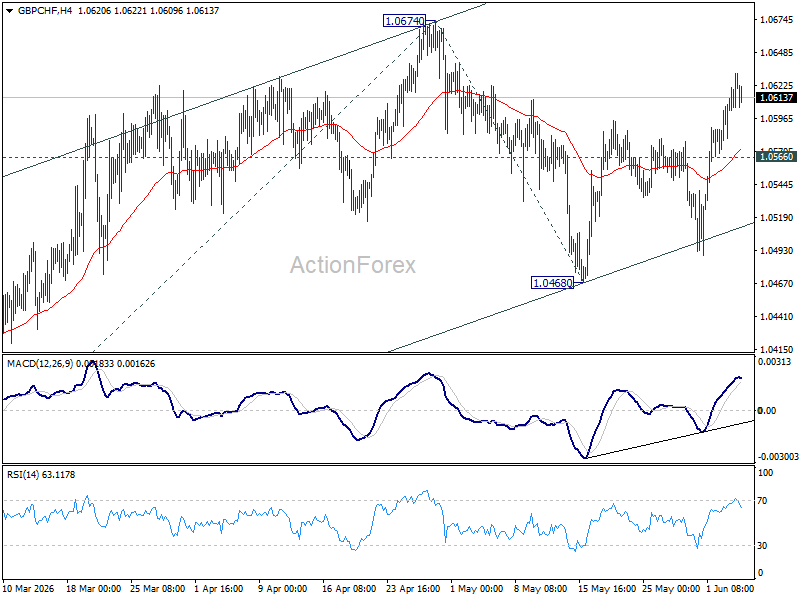
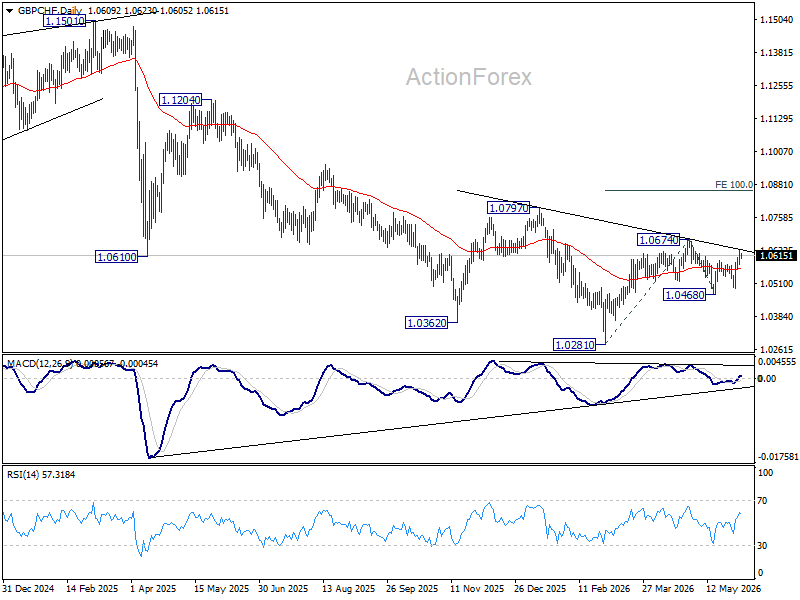
GBP/CHF is showing a similar structure, with the correction from 1.0674 likely ending at 1.0468. A move back to 1.0674 should be seen first. Firm break there will resume the rally from 1.0281 and target 100% projection of 1.0281 to 1.0674 from 1.0468 at 1.0861. However, below 1.0566 minor support turn bias neutral again first.
The key risk to this view remains a sudden collapse in oil prices. A breakthrough in US-Iran negotiations that rapidly removes geopolitical risk premiums from energy markets would immediately reduce inflation concerns in Europe and the UK. That would diminish the need for further policy tightening and narrow the divergence that is currently weighing on Swiss Franc. Until such a development occurs, however, the path of least resistance appears to favor higher EUR/CHF and GBP/CHF.
Fed’s Logan Questions Whether Current Rates Are Restrictive Enough
Dallas Fed President Lorie Logan delivered one of the most hawkish messages from a Fed official this year, warning that policymakers may ultimately need to raise rates again if inflation remains stubbornly elevated. While she stopped short of advocating an immediate move, Logan said she is "increasingly concerned that higher interest rates could be necessary later this year to fully restore price stability." Her remarks come amid rising oil prices, stronger-than-expected economic data, and growing debate within the Fed over whether inflation is settling above the 2% target.
A central theme of Logan's speech was that current policy may not be restraining the economy as much as many investors assume. She pointed to strong consumer spending, booming corporate profits, and robust AI-related investment activity as evidence that demand remains healthy. "These conditions indicate that monetary policy is not restraining the economy," Logan said. She also argued that financial conditions remain accommodative, with AI investment supporting growth today even if the hoped-for productivity gains and disinflationary benefits have yet to materialize.
On inflation, Logan warned that progress toward the Fed's target appears to be stalling. Rather than returning to 2%, she said inflation appears to be trending toward the mid 2's. Rising energy costs linked to the Iran conflict, lingering effects from tariffs, and broader underlying price pressures are all contributing to the challenge. The remarks reinforce a growing theme among Fed officials that inflation risks are increasingly outweighing employment risks. With labor markets remaining resilient and growth holding up, the possibility of another Fed hike later this year is becoming harder for markets to ignore.
Fed Reports Stable Labor Market, Rising Costs, and Strained Consumers
The Federal Reserve's latest Beige Book painted a picture of an economy that continues to grow but is increasingly feeling the effects of higher energy costs and persistent inflation pressures. Economic activity expanded at a "slight to moderate pace" in ten of the twelve Fed districts, while consumer spending was uneven and increasingly divided along income lines. One notable observation was that middle-income households are now "squeezing more life out of every dollar before deciding to spend it," while lower-income consumers are showing greater financial strain through increased credit card use and a focus on necessities.
Despite softer consumer trends, the labor market remained remarkably stable. Employment showed little or no change across eleven districts, with most regions describing a "low-hire, low-fire environment." Manufacturing hiring remained one of the stronger areas, supported by defense-related demand and the ongoing expansion of data-center investment. Wage growth was generally described as "modest to moderate", but businesses increasingly reported cost-of-living adjustments and more frequent wage reviews as workers faced higher fuel and household expenses.
The strongest message from the report came on inflation. The Beige Book noted that prices increased at a "moderate to strong pace overall," with most districts reporting higher inflation than in the previous survey. Energy-related costs linked to the Middle East conflict were identified as the primary source of pressure, with spillovers into shipping, packaging, groceries, and fertilizer. Importantly for policymakers, businesses reported that non-labor costs were rising faster than selling prices, creating margin pressure that could eventually lead to further price increases.
Ethereum Joins Bitcoin In A Brutal Selloff Across Crypto
Key Highlights
- Ethereum failed to stay above $2,000 and declined heavily.
- A bearish trend line is forming with resistance at $2,000 on the daily chart of ETH/USD.
- Bitcoin price declined and settled below the $68,000 pivot zone.
- XRP also dipped over 5% and traded below $1.18.
Ethereum Technical Analysis
Ethereum attempted an upside break above $2,200 but failed. ETH started a fresh decline and traded below the $2,000 support.
Looking at the daily chart, the price failed to stay above the 76.4% Fib retracement level of the recovery wave from the $1,739 swing low to the $2,462 high. The price also settled below the 100-day simple moving average (red).
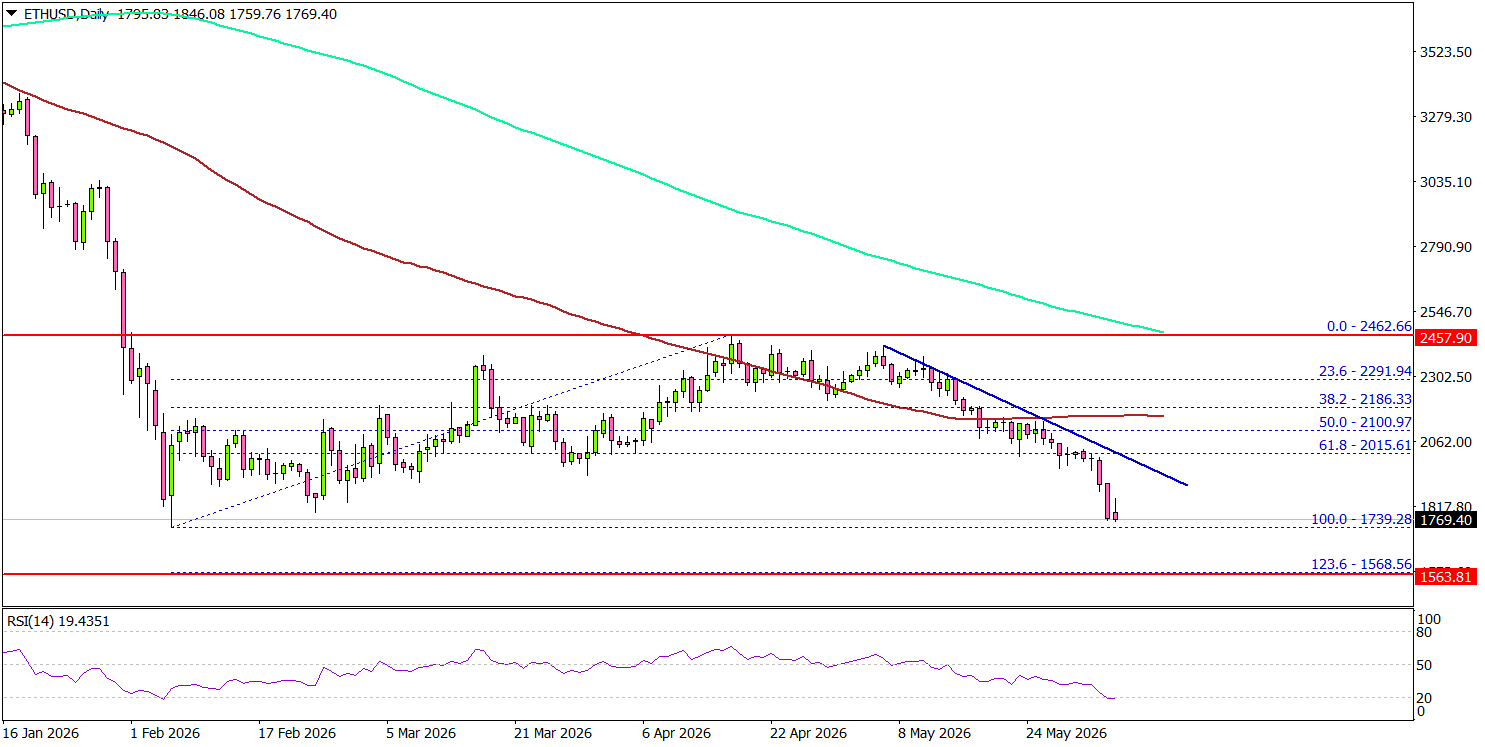
On the downside, the bulls might be active near $1,720 and $1,700. Any more losses might call for a move toward $1,650. The main support could be $1,565 or the 1.236 Fib extension level of the recovery wave from the $1,739 swing low to the $2,462 high.
On the upside, the bears might remain active near $1,880. The first key resistance could be near the $1,920 level. The main hurdle for bulls sits near $2,000.
A close above the $2,000 level could open doors for a larger upward movement. In the stated case, ETH could rise toward $2,200.
Looking at Bitcoin, the price failed to continue higher, trimmed gains, and is now struggling below the $68,000 support zone.
Economic Releases
- US Initial Jobless Claims - Forecast 213K, versus 215K previous.
DAX Index Wave Analysis
DAX: ⬇️ Sell
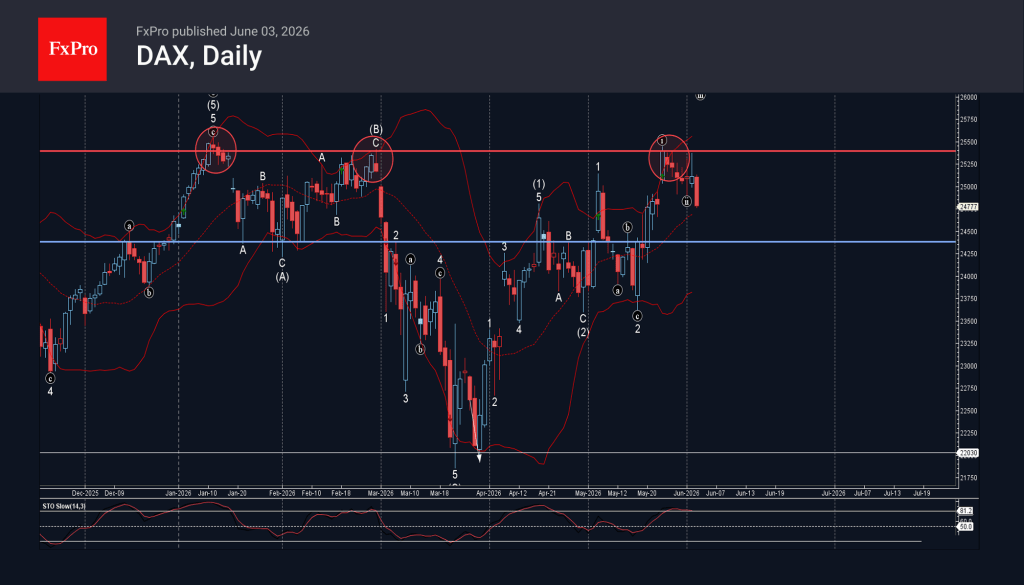
- DAX reversed from multi-month resistance level 25395.00
- Likely to fall to support level 24290.00
DAX index recently reversed from the resistance area between the multi-month resistance level 25395.00 (which has been reversing the price from January) and the upper daily Bollinger Band.
The downward reversal from this resistance area created the daily Japanese candlesticks reversal pattern Shooting Star.
Given the strength of the resistance level 25395.00 and the overbought daily Stochastic, DAX index can be expected to fall to the next support level 24290.00.
NZDCAD Wave Analysis
NZDCAD: ⬇️ Sell
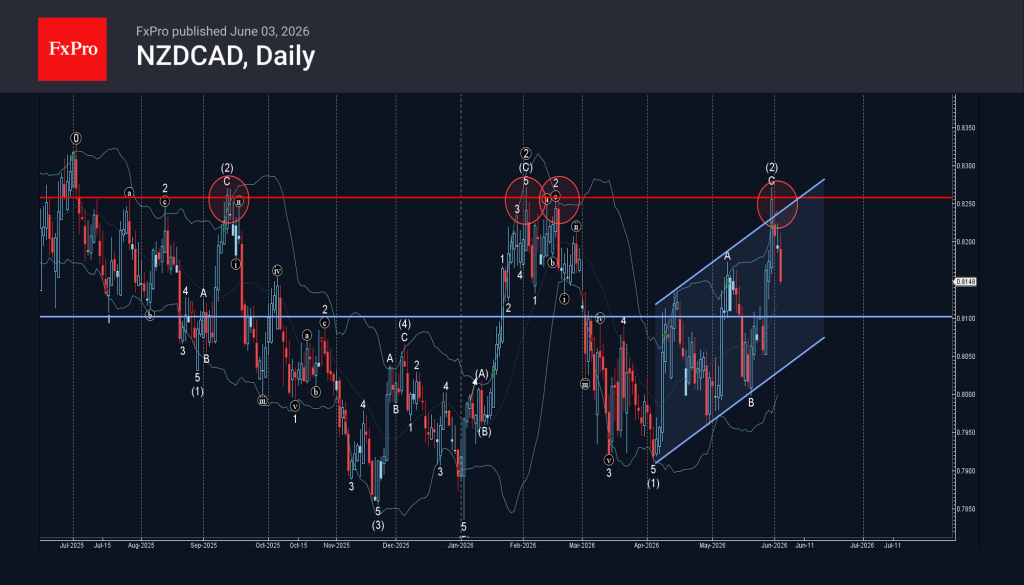
- NZDCAD reversed from resistance area
- Likely to fall to support level 0.8100
NZDCAD currency pair recently reversed from the resistance area between the strong resistance level 0.8260 (which has been reversing the price from last July), resistance trendline of the daily up channel from April and the upper daily Bollinger Band.
The downward reversal from this resistance area stopped the previous intermediate ABC correction (2) from the start of last month.
Given the strength of the resistance level 0.8260, NZDCAD currency pair can be expected to fall to the next support level 0.8100.
Eco Data 6/4/26
| GMT | Ccy | Events | Act | Cons | Prev | Rev |
|---|---|---|---|---|---|---|
| 01:30 | AUD | Trade Balance (AUD) Apr | 1.79B | -1.61B | -1.84B | |
| 06:30 | CHF | CPI M/M May | 0.20% | 0.30% | 0.30% | |
| 06:30 | CHF | CPI Y/Y May | 0.60% | 0.80% | 0.60% | |
| 07:00 | CHF | Unemployment Rate M/M May | 3.10% | 3.00% | 3.00% | |
| 08:30 | GBP | Construction PMI May | 38.2 | 40.1 | 39.7 | |
| 10:00 | EUR | Eurozone Retail Sales M/M Apr | -0.40% | -0.30% | -0.10% | 0.80% |
| 12:30 | USD | Initial Jobless Claims (May 29) | 225K | 211K | 215K | 212K |
| 12:30 | USD | Nonfarm Productivity Q1 | 0.30% | 0.70% | 0.80% | |
| 12:30 | USD | Unit Labor Costs Q1 | 1.80% | 2.40% | 2.30% | |
| 14:30 | USD | Natural Gas Storage (May 29) | 95B | 99B | 92B |
| 01:30 | AUD |
| Trade Balance (AUD) Apr | |
| Actual | 1.79B |
| Consensus | -1.61B |
| Previous | -1.84B |
| 06:30 | CHF |
| CPI M/M May | |
| Actual | 0.20% |
| Consensus | 0.30% |
| Previous | 0.30% |
| 06:30 | CHF |
| CPI Y/Y May | |
| Actual | 0.60% |
| Consensus | 0.80% |
| Previous | 0.60% |
| 07:00 | CHF |
| Unemployment Rate M/M May | |
| Actual | 3.10% |
| Consensus | 3.00% |
| Previous | 3.00% |
| 08:30 | GBP |
| Construction PMI May | |
| Actual | 38.2 |
| Consensus | 40.1 |
| Previous | 39.7 |
| 10:00 | EUR |
| Eurozone Retail Sales M/M Apr | |
| Actual | -0.40% |
| Consensus | -0.30% |
| Previous | -0.10% |
| Revised | 0.80% |
| 12:30 | USD |
| Initial Jobless Claims (May 29) | |
| Actual | 225K |
| Consensus | 211K |
| Previous | 215K |
| Revised | 212K |
| 12:30 | USD |
| Nonfarm Productivity Q1 | |
| Actual | 0.30% |
| Consensus | 0.70% |
| Previous | 0.80% |
| 12:30 | USD |
| Unit Labor Costs Q1 | |
| Actual | 1.80% |
| Consensus | 2.40% |
| Previous | 2.30% |
| 14:30 | USD |
| Natural Gas Storage (May 29) | |
| Actual | 95B |
| Consensus | 99B |
| Previous | 92B |