Sample Category Title
Nasdaq 100 Technical: Eyeing a New Fresh All-Time High, Supported by Momentum and Flattening US Treasury Yield Curve
Risk-on sentiment was on full display since the start of this week, as optimism around the US technology boom driven by Artificial Intelligence (AI) once again overshadowed more worrisome global developments on tariffs and growth.
AI optimism triggered another bullish impulsive move on US equities
On Wednesday, 6 August, U.S. equities rallied on news that OpenAI—the creator of ChatGPT and a leading force in the ongoing AI boom—is considering a stock sale that could value the company at $500 billion, a significant leap from its current $300 billion valuation.
Meanwhile, President Trump’s announcement of a proposed 100% tariff on semiconductor imports was largely shrugged off by investors. The impact was softened by incentives: U.S. corporations could be exempt from the levy if they commit to reshoring production. Apple Inc. was cited as a model example.
The S&P 500 and Nasdaq 100 extended their short-term bullish momentum that began on Monday, 4 August, posting intraday gains of 0.7% and 1.3%, respectively. The Dow Jones Industrial Average underperformed slightly with a modest 0.2% gain.
Asian markets followed the positive sentiment today, with bullish momentum persisting. S&P 500 and Nasdaq 100 E-mini futures advanced a further 0.7% by the end of the Asia trading session.
Let’s now decipher the US Nasdaq 100 CFD Index from a technical analysis perspective and construct a medium-term (multi-week) trading set-up.
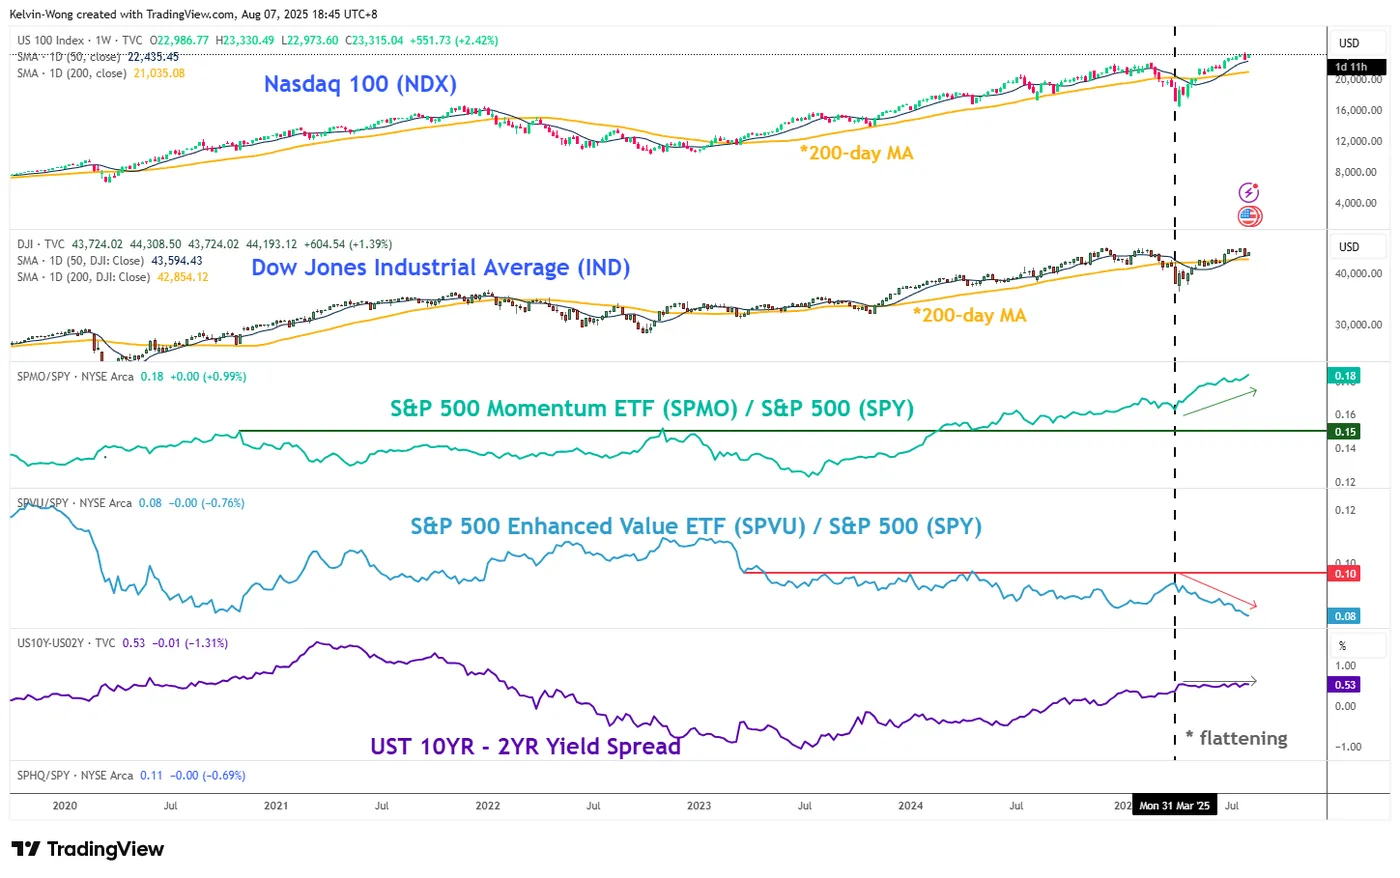
Fig. 1: US Nasdaq 100 CFD Index medium-term trend as of 7 Aug 2025 (Source: TradingView)

Fig. 2: Nasdaq 100 major trend with S&P 500 momentum/S&P 500 relative strength & US Treasury yield curve as of 6 Aug 2025 (Source: TradingView)
Preferred trend bias (1-3 weeks)
The minor corrective decline of -4.4% from 31 July 2025 high to 1 August 2025 low is likely to have ended. The US Nasdaq 100 CFD Index is now in the process of shaping a potential bullish impulsive up move sequence within its medium-term uptrend phase.
Bullish bias with key medium-term pivotal support at 22,945 for the next medium-term resistances to come in at 23,820 and 24,164/24,220 (Fibonacci extension cluster and upper boundary of a medium-term ascending channel in place since 19 June 2025 low) (see Fig. 1).
Key elements
- Price actions of the US Nasdaq 100 CFD Index have reintegrated above and retested the 20-day moving average on Wednesday, 6 August 2025, indicating the potential start of another bullish impulsive up move sequence.
- The 4-hour MACD trend indicator of the US Nasdaq 100 has just trended upwards above its centreline, which suggests the potential start of a new medium-term (multi-week) uptrend phase.
- The S&P 500 Momentum factor exchange-traded fund (ETF) has continued to outperform the S&P 500 ETF since the end of March 2025. Based on past observations, this momentum outperformance has supported the medium-term and major uptrend phases of the US Nasdaq 100 CFD Index (see Fig. 2).
- The US Treasury yield curve (10-year yield of the US Treasury note minus the 2-year yield of the US Treasury note) has flattened since early April 2025. This observation suggests falling US interest rates, which directly increase bond prices and returns in the short run. However, higher bond prices mean lower yields and lower returns for bonds in the future, which in turn, drive investors into the US stock market. An indirect medium-term positive driver to support further potential upside in the US Nasdaq 100 CFD Index (see Fig. 2).
Alternative trend bias (1 to 3 weeks)
Failure to hold the 22,945 key support invalidates the bullish tone to open scope for another corrective decline to expose the next medium-term supports at 22,670 and 22,410 (also close to the 50-day moving average).
FTSE 100 Technical Outlook: Range Holds Firm as BOE Meeting Approaches
The FTSE 100 edged higher this morning ahead of the highly anticipated Bank of England (BoE) interest rate meeting.
Markets are expecting a rate cut from the BoE today which could help propel the FTSE 100 to fresh all-time highs,
Looking at a sector breakdown for the FTSE and consumer non-cyclicals leads the way with gains of 0.23% with only consumer cyclicals, financials,and technology (marginal) in the green as well. All other sectors are in the red at the time of writing.
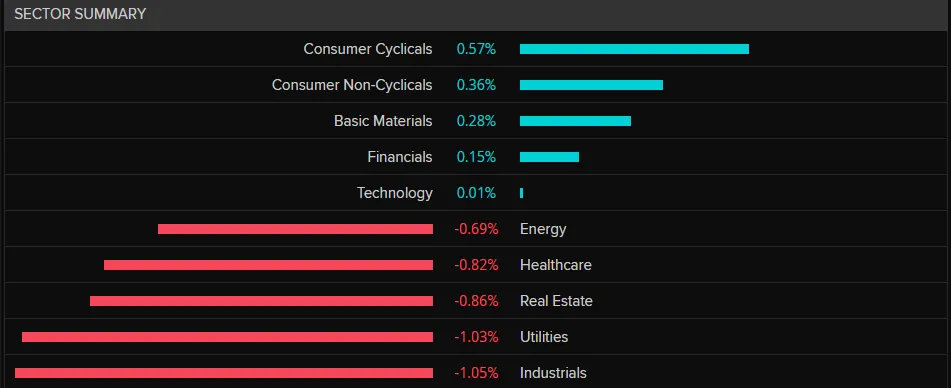
Source: LSEG
Looking at companies, BAE Systems and Hikma Pharmaceuticals are weighing on the index with losses of 4.1% and 7.1% respectively. This was however offset thanks to significant gains from the Intercontinental Hotel Group which is trading around 7.% higher on the day.
In other news, Halifax data was released this morning and showed UK house prices went up by 0.4% in July, the biggest monthly increase this year, helped by lower mortgage rates making homes more affordable.
Technical Analysis - FTSE 100
From a technical standpoint, the FTSE has been rangebound since July 23.
Having broken above crucial resistance at 9048 the index has held above this level with previous attempts to break lower met with significant buying pressure.
Such an example occurred on Friday last week and saw the index find support at the 200-day MA on the H2 chart.
Price is currently reston on the 100-day MA and attempts to push higher have thus far stalled.
Immediate resistance is at 9144 before the 9157 and 8183 handles come into focus.
Looking at the downside picture, support may be found at 9120 before 9082 and 9048 come into view.
FTSE 100 (UK100) H2 Chart, August 7, 2025
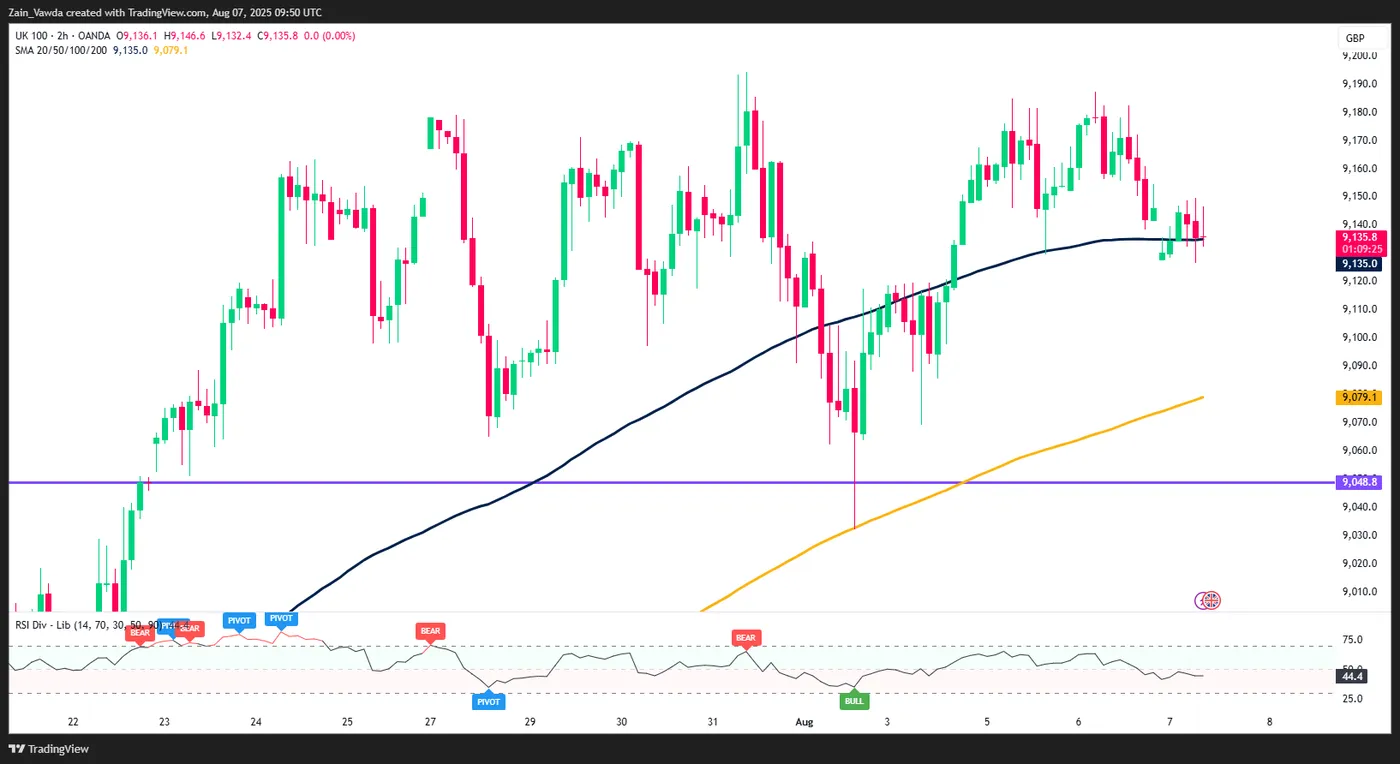
Source: TradingView (click to enlarge)
BoE cuts to 4.00%, hawkish 5-4 vote lifts Sterling
BoE delivered a widely expected 25 basis point rate cut, lowering the Bank Rate to 4.00% and continuing its cautious easing cycle. However, a hawkish four-member minority, including Chief Economist Huw Pill, Megan Greene, Clare Lombardelli, and Catherine Mann voted to hold rates steady, reflecting continued concern over lingering inflation pressures.
Governor Andrew Bailey led the five-member majority in favor of the reduction, and no member supported a larger reduction (Alan Taylor voted to cut bank rate by 50 bps in first round but changed to 25 bps in second round to avoid hold).. This signals that while easing continues, the BoE is far from embracing a more aggressive cutting path.
The BoE's updated projections show inflation expected to rise temporarily, peaking around 4.0% in September before falling back toward the 2% target. However, the MPC noted that upside risks to medium-term inflation "have moved slightly higher" since May, citing concerns that temporary price increases could entrench wage and pricing behaviors. This inflation vigilance likely explains the hawkish vote split and continued pushback against front-loading cuts.
On the growth side, the MPC noted that underlying GDP "remains subdued", with slack emerging in the labor market. While domestic and global uncertainties persist, the committee acknowledged that trade policy risk has “diminished somewhat”—a nod to easing tensions after recent UK-U.S. tariff agreements.
Even with economic momentum fading, the MPC maintained that policy is “not on a pre-set path,” emphasizing a “gradual and careful approach” to further easing.
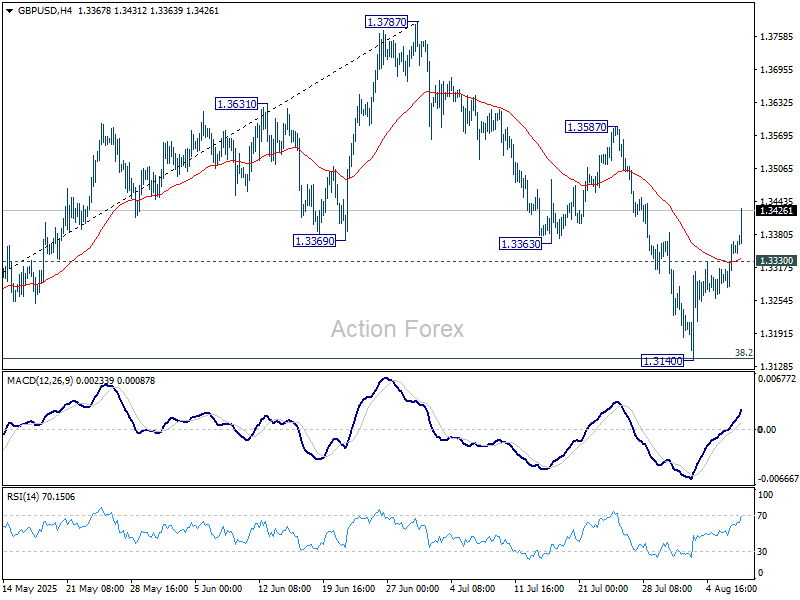
Sterling responded positively to the rate cut and the hawkish tilt in the vote. GBP/USD's rally from 1.3140 accelerates after the announcement. Current development further affirms the case that correction from 1.3787 has completed with three waves down to 1.3140. Further rise should be seen to 1.3587 resistance first. Firm break there will target a retest on 1.3787 high.
(BOE) Bank Rate reduced to 4%
Monetary Policy Summary, August 2025
The Monetary Policy Committee (MPC) sets monetary policy to meet the 2% inflation target, and in a way that helps to sustain growth and employment. The MPC adopts a medium-term and forward-looking approach to determine the monetary stance required to achieve the inflation target sustainably.
At its meeting ending on 6 August 2025, the MPC voted by a majority of 5–4 to reduce Bank Rate by 0.25 percentage points, to 4%, rather than maintaining it at 4.25%.
There has been substantial disinflation over the past two and a half years, following previous external shocks, supported by the restrictive stance of monetary policy. That progress has allowed for reductions in Bank Rate over the past year. The Committee remains focused on squeezing out any existing or emerging persistent inflationary pressures, to return inflation sustainably to its 2% target in the medium term.
The path of disinflation in underlying domestic price and wage pressures has generally continued, albeit to different degrees. Twelve-month CPI inflation increased to 3.5% in 2025 Q2, owing to developments in energy, food and administered prices. Pay growth remains elevated, but has declined further recently, and is still expected to slow significantly over the rest of the year. Services consumer price inflation has been broadly flat over recent months. The Committee continues to be vigilant about the extent to which easing pay pressures will feed through to consumer price inflation.
CPI inflation is forecast to increase slightly further to peak at 4.0% in September. Inflation is expected to fall back thereafter towards the 2% target, although the Committee remains alert to the risk that this temporary increase in inflation could put additional upward pressure on the wage and price-setting process. Overall, the MPC judges that the upside risks around medium-term inflationary pressures have moved slightly higher since May.
Underlying UK GDP growth has remained subdued, consistent with a continued, gradual loosening in the labour market. A margin of slack is judged to have emerged in the economy. Downside domestic and geopolitical risks around economic activity remain, although trade policy uncertainty has diminished somewhat.
At this meeting, the Committee voted to reduce Bank Rate to 4%. A gradual and careful approach to the further withdrawal of monetary policy restraint remains appropriate. The restrictiveness of monetary policy has fallen as Bank Rate has been reduced. The timing and pace of future reductions in the restrictiveness of policy will depend on the extent to which underlying disinflationary pressures continue to ease. Monetary policy is not on a pre-set path, and the Committee will remain responsive to the accumulation of evidence.
Minutes of the Monetary Policy Committee meeting ending on 6 August 2025
1: Before turning to its immediate policy decision, the Committee discussed: the international economy; monetary and financial conditions; demand and output; and supply, costs and prices. The latest data on these topics were set out in the accompanying August 2025 Monetary Policy Report.
2: The Committee discussed recent developments in international trade policies and their implications for the UK. US tariff rates had remained at higher levels than in the period preceding the initial announcements by the US administration in April. However, uncertainty around trade had reduced since the May Monetary Policy Report as the US had reached trade agreements with some countries. The reduction in tariff rates relative to those assumed in the May Report implied that global demand would be slightly stronger in the baseline projection. Global developments had, nevertheless, not played a large role in the policy discussions at this MPC meeting.
3: Developments in international trade policies had also generally supported sentiment in financial markets, such that financial conditions had loosened a little since the MPC’s June meeting. Measures of financial market volatility had either remained stable or fallen somewhat. UK and US equity prices had increased, with estimates of equity risk premia across advanced economies falling. Spreads on investment grade corporate bonds had tightened.
4: The near-term market-implied path for Bank Rate was relatively little changed since the Committee’s June meeting but was a little higher than the path assumed in the May Report. Almost all respondents to the Bank’s latest Market Participants Survey (MaPS) expected a reduction in Bank Rate at this meeting, similar to market pricing. The median profile in the August MaPS implied a cumulative 50 basis point reduction in Bank Rate by the end of this year, broadly in line with market pricing.
5: Monthly UK GDP growth in April and May had been -0.3% and -0.1% respectively. These outturns suggested that stronger GDP growth earlier in the year had, in part, been driven by international tariff or domestic tax-related front-loading. The S&P Global UK PMI future output index had risen over past months, and the output index had also risen but by less. Bank staff estimated that GDP growth had been 0.1% in 2025 Q2, in line with the projection in the May Report, and growth was expected to pick up to 0.3% in Q3.
6: The Committee discussed the extent to which developments in activity had fed through to spare capacity in the economy. There had continued to be a gradual loosening in the labour market. Weak underlying employment growth in recent quarters had largely been ascribed to weakness in underlying demand and, more recently, an increase in firms’ costs. The LFS unemployment rate had increased further in the three months to May, as expected. Vacancies had remained below their estimated equilibrium levels, with other indicators and statistical models pointing to further increases in spare capacity.
7: The evidence from a range of sources and Bank staff analysis suggested that disinflation in underlying price and wage pressures had generally continued, albeit to different degrees. Annual private sector regular AWE growth had declined further in the most recent data, to just below 5%. This was weaker than expected in the May Report, but consistent with a range of other indicators. AWE growth nevertheless remained above what Bank models could explain. Developments in pay settlements, the latest DMP Survey and Agents’ intelligence suggested a further weakening in pay growth in coming quarters, to around 3¾% by the end of the year.
8: Twelve-month CPI inflation had increased to 3.6% in June, slightly above expectations at the time of both the May Report and the Committee’s June meeting, reflecting upside news in food, energy and services prices. Services price inflation had remained unchanged at 4.7% in June. Underlying services price inflation had continued to moderate, but at a slower pace than last year based on some measures.
9: CPI inflation was expected to rise a little further, to just over 3¾% in 2025 Q3, before falling back towards the 2% target. The return of inflation towards target would be supported by an expected gradual reduction in food price inflation next year. Box E in the August Report discussed the risks related to food price inflation, including the potential for it to have an outsized influence on households’ formation of inflation expectations. The Committee discussed the extent to which the lag from wage growth through to services price inflation was operating in line with historical trends. Looking beyond the temporary factors putting upward pressure on prices this year, wage and services price disinflation would be key drivers of CPI inflation settling sustainably at the target.
The immediate policy decision
10: The MPC sets monetary policy to meet the 2% inflation target, and in a way that helps to sustain growth and employment. The MPC adopts a medium-term and forward-looking approach to determine the monetary stance required to achieve the inflation target sustainably.
11: The Committee’s policy deliberations at this meeting had focused on a number of factors, including the extent to which disinflation was continuing, the degree of slack building in the economy, and the current and future restrictiveness of the monetary policy stance.
12: Disinflation in underlying domestic price and wage pressures had generally continued, albeit to different degrees. Core CPI and services price inflation had been broadly unchanged in recent months. Continued moderation in wage growth was likely to feed through to lower services price inflation, although this process could take time and Committee members varied in their confidence in it. Headline inflation had risen and was projected to rise slightly further in the near term, although in the baseline projection this was not expected to lead to additional second-round effects on underlying domestic inflationary pressures. The increase in headline inflation was explicable by factors such as supply issues in certain food items and changes in administered prices. However, increases in food and energy price inflation might prove salient for households’ formation of inflation expectations. As illustrated in the inflation persistence scenario set out in the May Monetary Policy Report, this could place upward pressure on the wage and price-setting process. Overall, the MPC judged that the upside risks around medium-term inflationary pressures had moved slightly higher since May.
13: UK economic activity had remained subdued. A margin of spare capacity was estimated to have opened up, which was expected to act against some continuing inflationary persistence. There was a range of views around the extent to which it had opened and would continue to build. The labour market was continuing to loosen gradually. For some members, weak employment growth pointed to further spare capacity building. For others, potential structural changes in the labour market meant that sufficient slack might not have emerged and might not build further to weigh on inflation. Members concurred that there were generally downside risks around consumption growth in the baseline forecast and upside risks around the path of the saving ratio, including from the risk of greater precautionary saving behaviour by households.
14: The Committee considered Bank staff’s latest assessment of monetary policy restrictiveness, as set out in Box A in the accompanying August Report. Reflecting the usual lags of policy, past restrictiveness was estimated to be weighing on the current level of demand, which would contribute to the disinflationary process. For those members placing greater weight on downside risks to inflation, the impact of past and current restrictiveness was likely to be sufficient to lean against inflationary pressures and less restrictiveness was probably required going forward. Those members who were more concerned about inflationary pressures persisting judged that a more prolonged period of policy restrictiveness was likely to be warranted.
15: In considering the approach to removing remaining policy restraint at this meeting and beyond, all members were balancing various considerations. This included risks in different directions to growth and inflation, the degree of continued impact from past tightening in policy, the costs of loosening policy too quickly or too slowly, and whether and how long to wait and observe further incoming evidence before reducing Bank Rate further.
16: Five members preferred a reduction in Bank Rate at this meeting.
17: Four of these five members preferred a 0.25 percentage point reduction in Bank Rate at this meeting. There had been sufficient progress in underlying disinflation albeit, for some of these members, with a risk that this momentum could slow. There remained greater signs of disinflation from labour market quantities and wages, than from developments in domestic prices. Activity remained weak. The pace of disinflation from here would help inform these members’ views on how quickly to remove remaining policy restraint. On the one hand, higher food prices could raise inflation expectations and generate greater inflation persistence. On the other hand, signs of weaker demand, for example as a result of the impact of continued high saving on consumption, could lead to a more rapid opening up of slack in the labour market.
18: One of these five members preferred a 0.5 percentage point reduction in Bank Rate at this meeting. Underlying disinflation continued. Absent external shocks, domestic inflation, especially in services, was tightly linked to wages. The labour market had slack and was deteriorating further. Wage settlements had fallen to around 3.5% in the first half of 2025 and were expected to fall further in the second half. The inflation hump was expected to normalise, being dominated by one-off changes in tax and administered prices, and food inflation in a limited set of items, neither related to demand pressure. Energy futures curves were flat. With a US average tariff rate near 20%, trade diversion would slowly permeate, pushing down on inflation. UK sentiment was weak, with subdued consumption and investment. This picture was one of downside risks in coming years, namely: inflation below forecast, and activity weak or an increased risk of recession. For insurance against this balance of risks, a less restrictive policy was warranted.
19: Four members preferred to hold Bank Rate at 4.25% at this meeting. The disinflationary process had slowed and the risk of inflation expectations feeding through to second-round effects had risen. Business and household inflation expectations remained elevated, inflation was expected to peak at 4% and much of the recent near-term upside news in inflation had been driven by highly salient food and energy prices. Firms’ own-price expectations remained more sensitive to upside inflation surprises as well. These members would continue to assess the pace of disinflation, being alert to downside pressures on pricing power from domestic demand and global forces, alongside the risk of greater inflation persistence from structural changes in goods and labour markets. A slower loosening of policy would reduce the risk of inflation not meeting the target sustainably.
20: The Committee judged that a gradual and careful approach to the further withdrawal of monetary policy restraint remained appropriate. The restrictiveness of monetary policy had fallen as Bank Rate had been reduced. The timing and pace of future reductions in the restrictiveness of policy would depend on the extent to which underlying disinflationary pressures would continue to ease. Monetary policy was not on a pre-set path, and the Committee would remain responsive to the accumulation of evidence.
21: The Chair invited the Committee to vote on the proposition that:
- Bank Rate should be reduced by 0.25 percentage points, to 4%.
22: Four members voted in favour of the proposition (Andrew Bailey, Sarah Breeden, Swati Dhingra and Dave Ramsden). Four members (Megan Greene, Clare Lombardelli, Catherine L Mann and Huw Pill) preferred to maintain Bank Rate at 4.25%. One member (Alan Taylor) preferred to reduce Bank Rate by 0.5 percentage points, to 3.75%.
23: In order to secure a majority decision on Bank Rate, the Chair invited the Committee to vote on whether:
- Bank Rate should be reduced by 0.25 percentage points, to 4%, or Bank Rate should be maintained at 4.25%.
24: Five members (Andrew Bailey, Sarah Breeden, Swati Dhingra, Dave Ramsden and Alan Taylor) voted to reduce Bank Rate by 0.25 percentage points, to 4%. One of these members (Alan Taylor), who would otherwise have preferred to reduce Bank Rate by 0.5 percentage points, voted for a 0.25 percentage points reduction rather than maintaining Bank Rate. Four members (Megan Greene, Clare Lombardelli, Catherine L Mann and Huw Pill) voted to maintain Bank Rate at 4.25%.
25: On this basis, the MPC voted by a majority of 5–4 to reduce Bank Rate by 0.25 percentage points, to 4%, rather than maintaining it at 4.25%.
Operational considerations
26: On 6 August, the stock of UK government bonds held for monetary policy purposes was £586 billion.
27: The following members of the Committee were present:
- Andrew Bailey, Chair
- Sarah Breeden
- Swati Dhingra
- Megan Greene
- Clare Lombardelli
- Catherine L Mann
- Huw Pill
- Dave Ramsden
- Alan Taylor
Sam Beckett was present as the Treasury representative.
David Roberts was present on 30 July and 4 August, as an observer for the purpose of exercising oversight functions in his role as a member of the Bank’s Court of Directors.
EUR/GBP Technical: Bullish Impulsive Upleg Intact (EUR Outperformance over GBP) as BoE Looms
Today, the Bank of England (BoE) is set to cut its short-term policy interest rate by 25 basis points to 4%, its lowest level in over two years, based on consensus expectations.
It will be the BoE’s second rate cut this year, as several of its Monetary Policy Committee members were cautious over a sticky inflationary trend that overshadowed growth concerns.
The latest core inflation rate in the UK jumped to 3.7% y/y in June, surpassing May’s print of 3.5%, and market expectations of 3.5%. Since the current inflation print is close to double the central bank's 2% target, the MPC is expected to leave in place guidance steering markets toward more “gradual and careful” interest-rate cuts and a meeting-by-meeting approach.
Let’s now focus on a short-term technical trading set-up on the EUR/GBP cross ahead of the BoE’s monetary policy decision today.
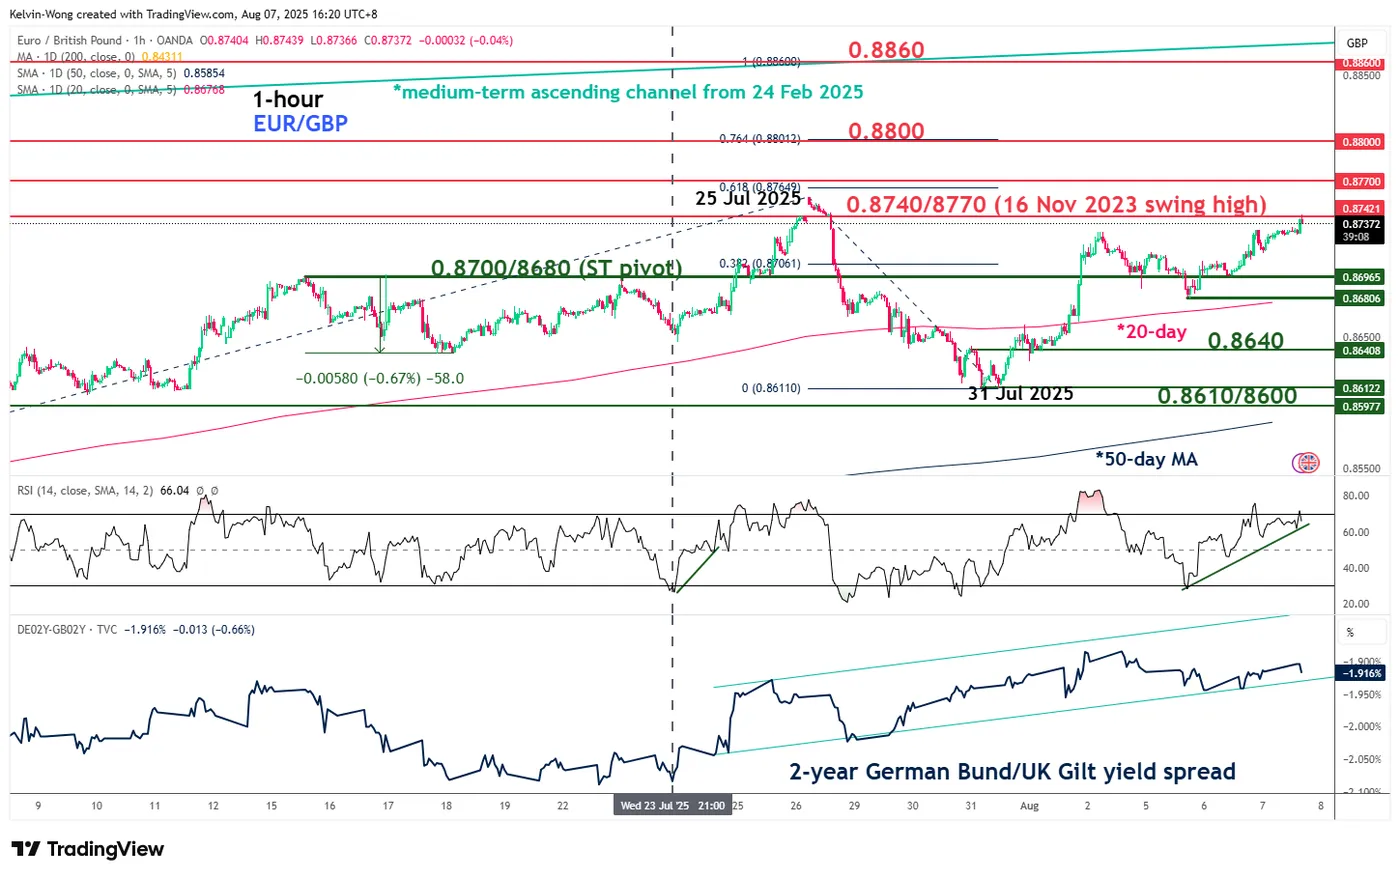
Fig. 1: EUR/GBP minor trend as of 7 Aug 2025 (Source: TradingView)
Preferred trend bias (1-3 days)
The recent minor corrective decline of 145 pips seen in the EUR/GBP from the 25 July high to the 31 July low is likely to have ended.
A potential bullish impulsive up move sequence is unfolding that supports EUR outperformance over GBP within its medium-term uptrend phase.
Bullish bias with 0.8700/8680 as the key short-term pivotal support for the next intermediate resistances to come in at 0.8740/8770, 0.8800, and 0.8860 (Fibonacci extension and upper boundary of the medium-term ascending channel from 24 February 2025) (see Fig. 1).
Key elements
- The price actions of the EUR/GBP have reintegrated back above its upward sloping 20-day and 50-day moving averages, which suggests the medium-term uptrend phase remains intact.
- Its hourly RSI momentum indicator has continued to exhibit a bullish momentum condition that advocates short-term EUR outperformance over GBP.
- The discount yield spread between the 2-year German Bund and 2-year UK Gilt has narrowed from -2.08% to -1.92% which suggests that short-term sovereign bonds in the UK are getting “less attractive” to own than Germany’s short-term sovereign bonds. A positive driver of further potential upside in EUR/GBP.
Alternative trend bias (1 to 3 days)
A break below 0.8680 negates the bullish tone, where the EUR/GBP may see a minor slide to retest the next intermediate supports of 0.8640 and 0.8610/8600 (31 July 2025 minor swing low and 50-day moving average).
EUR/USD Rises 2.3% Since the Beginning of August
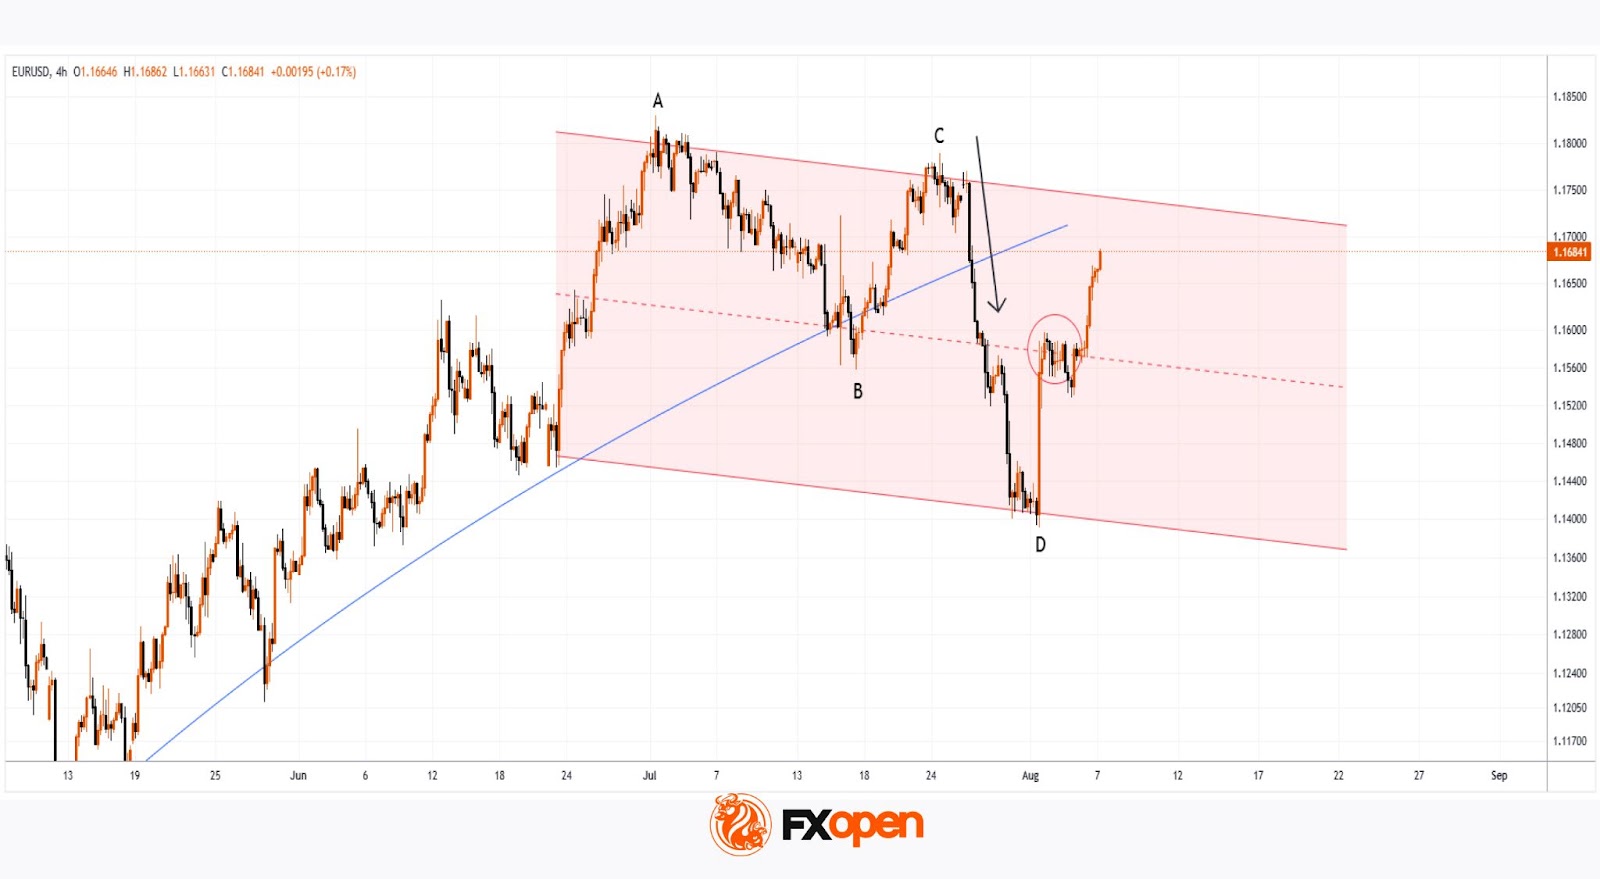
As the EUR/USD chart shows today, the euro has strengthened against the US dollar, climbing above the 1.1670 level, compared to the 1.1400 area at the beginning of the month.
Why Is EUR/USD Rising?
According to Reuters, the US dollar's weakness is being driven by:
→ Expectations of a Federal Reserve rate cut, which intensified following last week's disappointing US labour market data.
→ Anticipation of the upcoming US inflation report, scheduled for release on 12 August at 15:30 GMT+3.
On the other hand, the euro is being supported by growing optimism around a possible resolution of the military conflict in Ukraine, as well as the potential meeting between Donald Trump and Vladimir Putin.
Technical Analysis of the EUR/USD Chart
On 30 July, we noted that after hitting its July low, EUR/USD could stage a recovery — which indeed materialised. But does the chart now look bullish?
A definitive bullish outlook is hindered by the sequence of lower highs and lower lows (A-B-C-D), which continues to form a bearish market structure.
At the same time, the descending channel on the EUR/USD chart has become more pronounced. After a brief period of consolidation near the channel’s median line (marked with a circle), the price moved up towards the upper boundary of the channel. It is worth noting that a sharp decline occurred recently from these same levels (highlighted with an arrow), breaking through the blue support line.
Given these factors, it is reasonable to assume that bearish activity may intensify around current levels, potentially slowing further EUR/USD growth.
Trade over 50 forex markets 24 hours a day with FXOpen. Take advantage of low commissions, deep liquidity, and spreads from 0.0 pips. Open your FXOpen account now or learn more about trading forex with FXOpen.
This article represents the opinion of the Companies operating under the FXOpen brand only. It is not to be construed as an offer, solicitation, or recommendation with respect to products and services provided by the Companies operating under the FXOpen brand, nor is it to be considered financial advice.
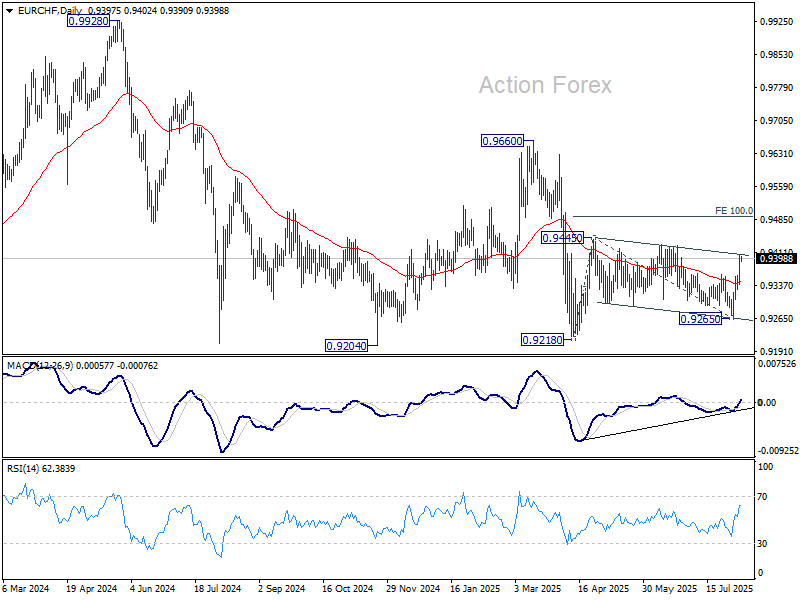
EUR/CHF Daily Outlook
Daily Pivots: (S1) 0.9352; (P) 0.9380; (R1) 0.9430; More....
Intraday bias in EUR/CHF stays on the upside for 0.9428 resistance. Firm break there should confirm that corrective pattern from 0.9445 has completed. Rise from 0.9128 should then be ready to resume to 100% projection of 0.9218 to 0.9445 from 0.9265 at 0.9492. ON the downside, below 0.9359 minor support will turn intraday bias neutral again first.
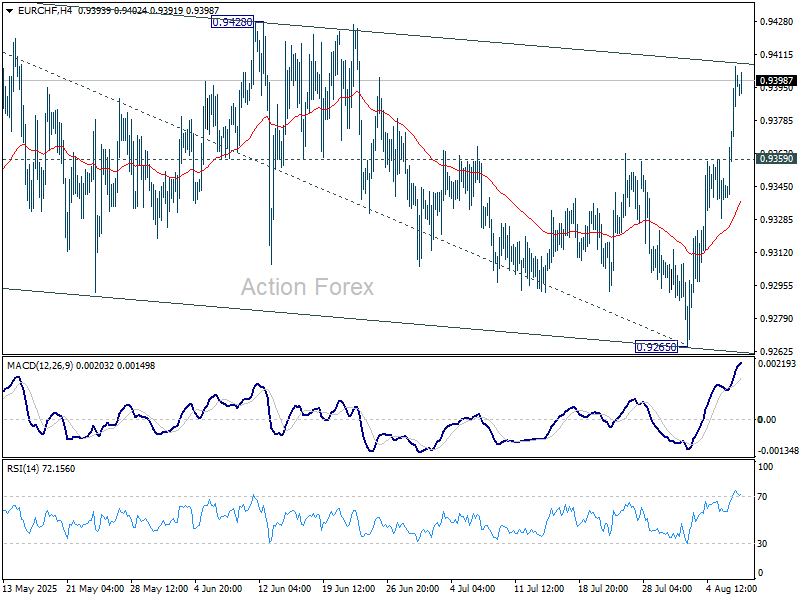
In the bigger picture, the down trend from 0.9204 (2018 high) might still be in progress considering that EUR/CHF is staying well inside the long term falling channel. However, with bullish convergence condition in W MACD, downside position should be limited in case of another fall. Instead, firm break of 0.9660 resistance will be an important sign of medium term bullish trend reversal.
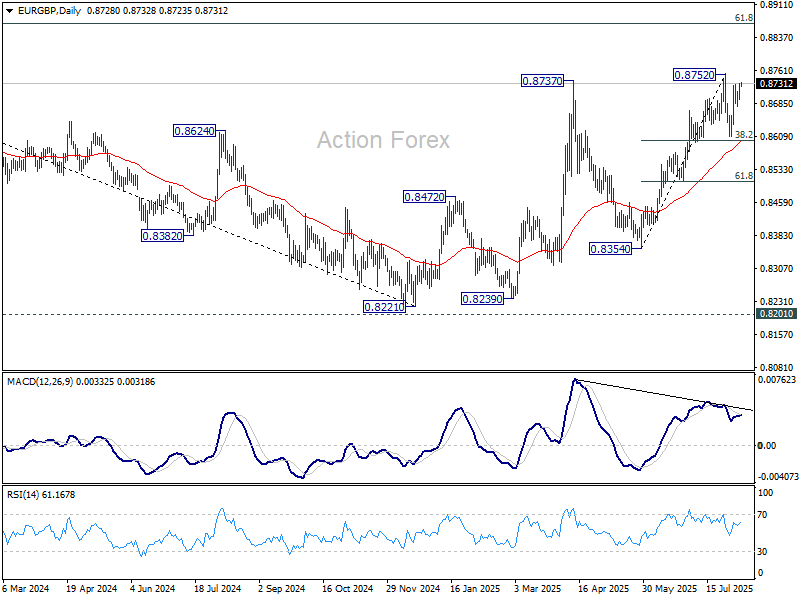
EUR/GBP Daily Outlook
Daily Pivots: (S1) 0.8707; (P) 0.8720; (R1) 0.8742; More...
Range trading continues in EUR/GBP and intraday bias remains neutral On the upside, firm break of 0.8752 will resume the rise from 0.8354 towards 0.8867 fibonacci level. On the downside, below 0.8678 will extend the corrective pattern from 0.8752 with another falling leg. But downside should be contained by 38.2% retracement of 0.8354 to 0.8752 at 0.8600.
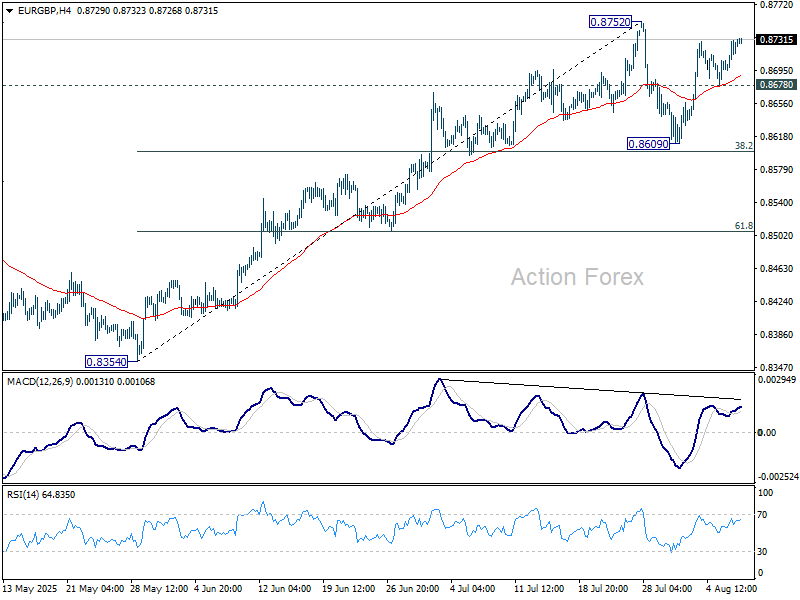
In the bigger picture, the structure from 0.8221 medium term bottom are not impulsive enough to suggest that it's reversing the down trend from 0.9267 (2022 high). But even if it's a correction, further rise is expected to 61.8% retracement of 0.9267 to 0.8221 at 0.8867. This will remain the favored case as long as 55 W EMA (now at 0.8493) holds.
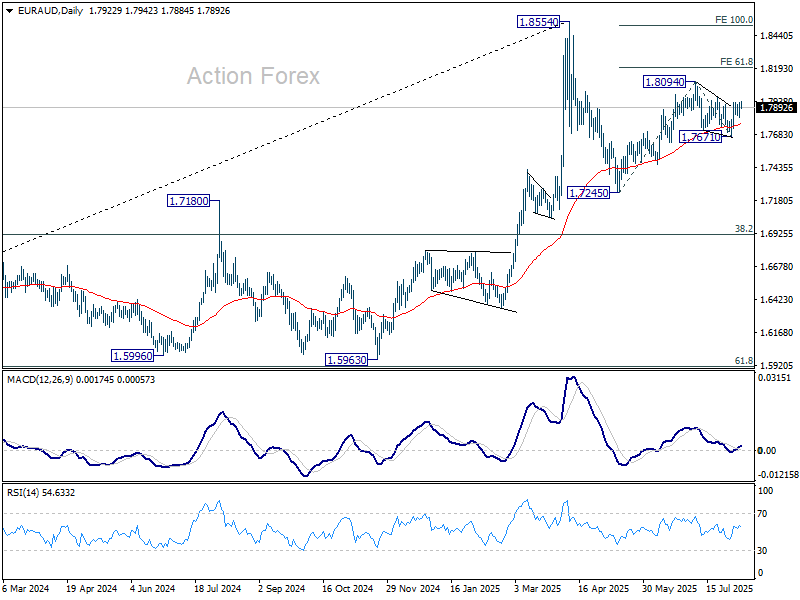
EUR/AUD Daily Outlook
Daily Pivots: (S1) 1.7857; (P) 1.7895; (R1) 1.7968; More...
Intraday bias in EUR/AUD remains neutral for the moment. On the upside, break of 1.7972 resistance should resume the whole rally from 1.7245 through 1.8094 to 61.8% projection of 1.7245 to 1.8094 from 1.7671 at 1.8196. On the downside, below 1.7671 will bring deeper fall back to 1.7459 support instead.
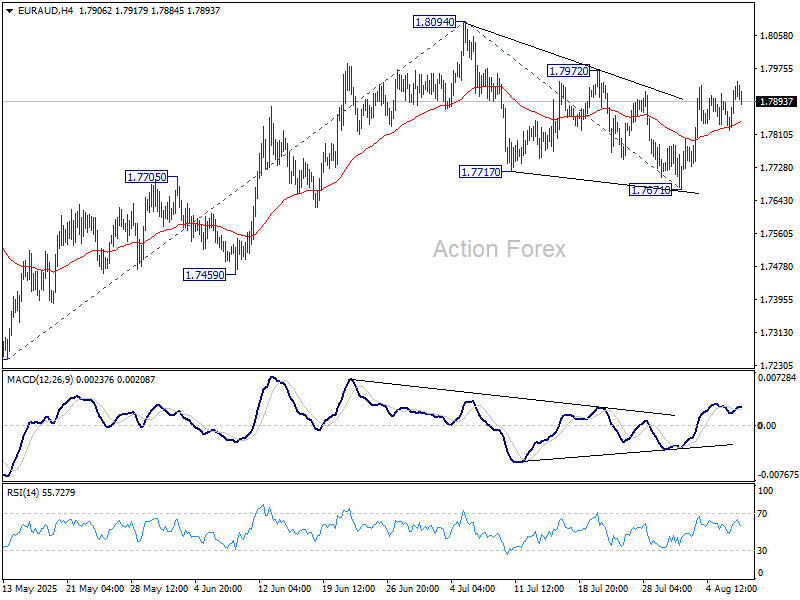
In the bigger picture, price actions from 1.8554 medium term top are seen as a corrective pattern. Such pattern could extend further with another falling leg. But even in that case, downside should be contained by 38.2% retracement of 1.4281 (2022 low) to 1.8554 at 1.6922 to bring rebound. Up trend from 1.4281 is expected to resume at a later stage.
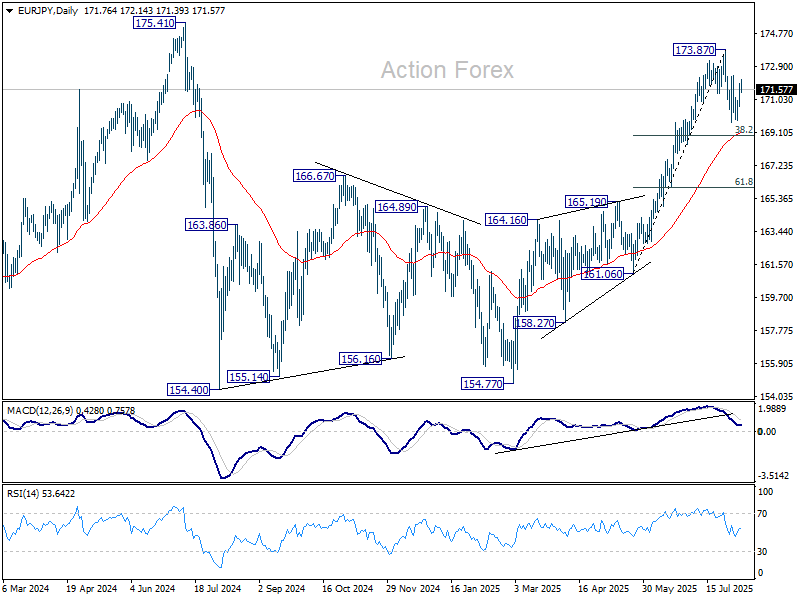
EUR/JPY Daily Outlook
Daily Pivots: (S1) 170.96; (P) 171.48; (R1) 172.34; More...
Intraday bias in EUR/JPY remains neutral for the moment. While fall from 173.87 short term top could extend lower, downside should be contained by 38.2% retracement of 161.06 to 173.87 at 168.97 to bring rebound, at least on first attempt. On the upside, above 172.36 resistance will bring retest of 173.87 first. However, sustained break of 168.97 will raise the chance of near term bearish reversal.
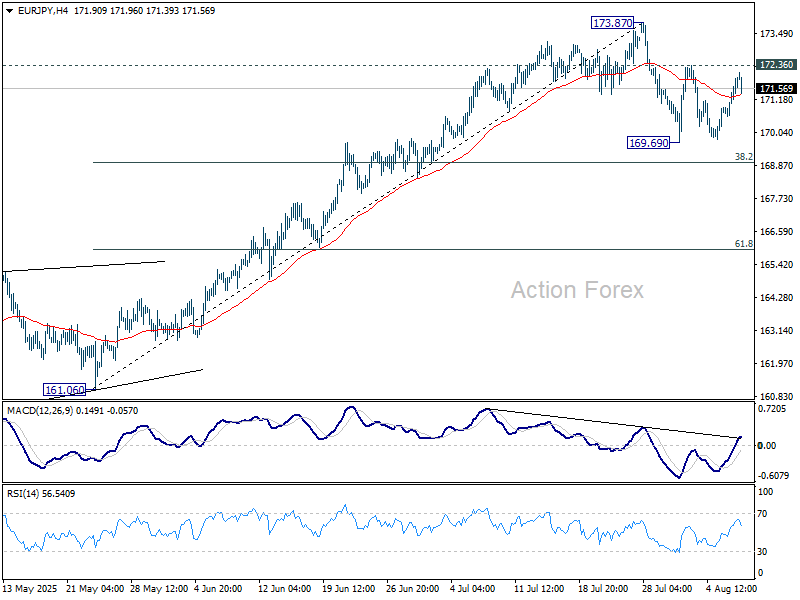
In the bigger picture, considering current strong momentum as seen in the rally from 154.77, corrective pattern from 175.41 could have already completed. Decisive break there will confirm long term up trend resumption. Next target is 61.8% projection of 124.37 to 175.41 from 154.77 at 186.31. However, rejection by 175.41, followed by firm break of 55 D EMA (now at 168.80) will delay this bullish case.