Sample Category Title
EUR/USD Mid-Day Outlook
Daily Pivots: (S1) 1.1593; (P) 1.1631; (R1) 1.1697; More...
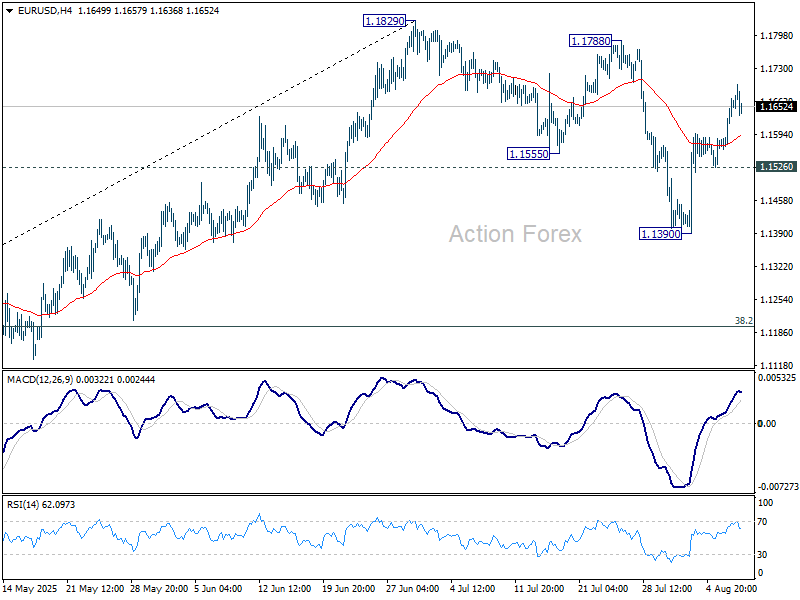
Intraday bias in EUR/USD stays on the upside at this point. As noted before, correction from 1.1829 should have completed with three waves down to 1.1390. Further rally should be seen to retest 1.1788/1820 resistance zone. On the downside, however, break of 1.1526 minor support will dampen this view and bring retest of 1.1390 instead.
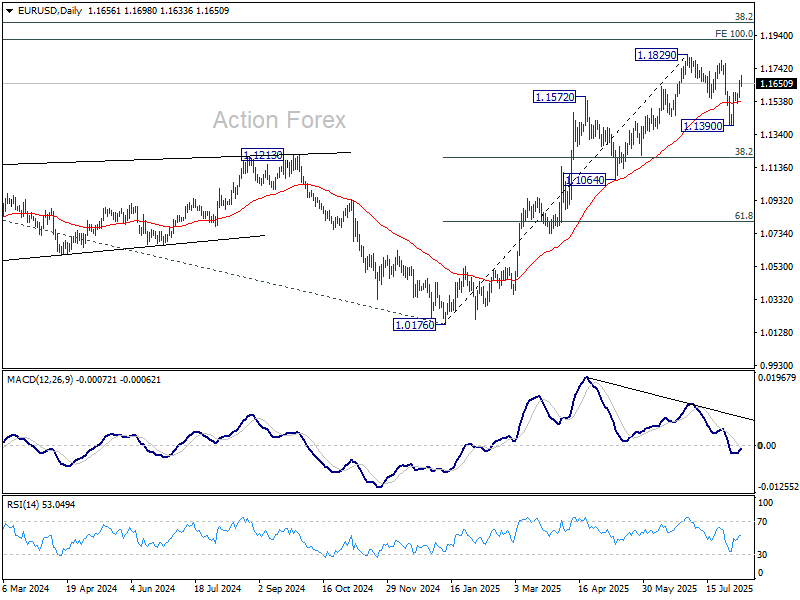
In the bigger picture, rise from 0.9534 long term bottom could be correcting the multi-decade downtrend or the start of a long term up trend. In either case, further rise should be seen to 100% projection of 0.9534 to 1.1274 from 1.0176 at 1.1916. This will remain the favored case as long as 1.1604 support holds.
USD/CHF Mid-Day Outlook
Daily Pivots: (S1) 0.8044; (P) 0.8069; (R1) 0.8089; More….
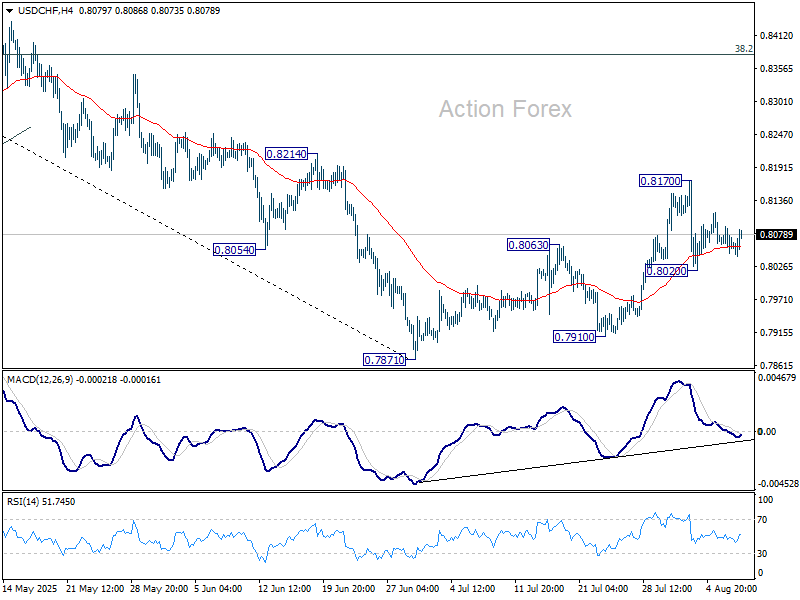
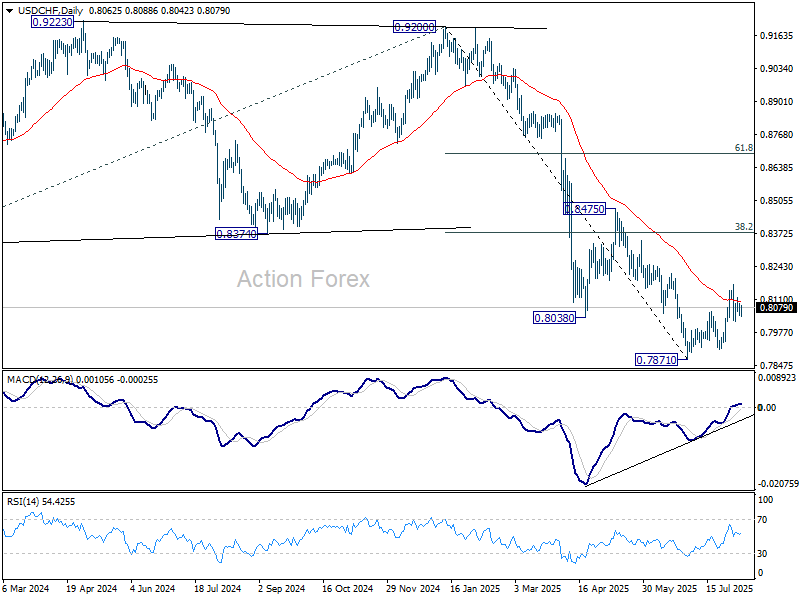
No change in USD/CHF's outlook and intraday bias remains neutral. On the downside, below 0.8020 will affirm that case that corrective bounce from 0.7871 has completed at 0.8170. Bias will be back on the downside for 07871/7910 support zone. On the upside, though, break of 0.8170 will resume the rise from 0.7871 to 38.2% retracement of 0.9200 to 0.7871 at 0.8379 instead.
In the bigger picture, long term down trend from 1.0342 (2017 high) is still in progress. Next target is 100% projection of 1.0146 (2022 high) to 0.8332 from 0.9200 at 0.7382. In any case, outlook will stay bearish as long as 0.8475 resistance holds.
USD/JPY Mid-Day Outlook
Daily Pivots: (S1) 146.93; (P) 147.41; (R1) 147.83; More...
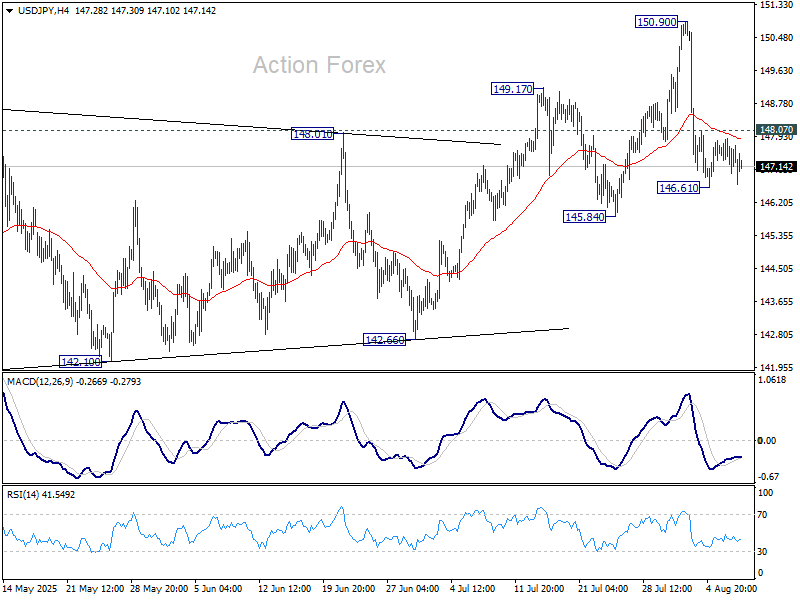
Intraday bias in USD/JPY stays neutral as range trading continues. As long as 145.84 support holds, larger rebound from 139.87 is still in favor to continue. On the upside, above 148.07 minor resistance will bring stronger rebound back to retest 150.90. However, on the downside, firm break of 145.84 support will argue that whole rise from 139.87 might have already completed. Deeper fall should then be seen to 142.66 support for confirmation.
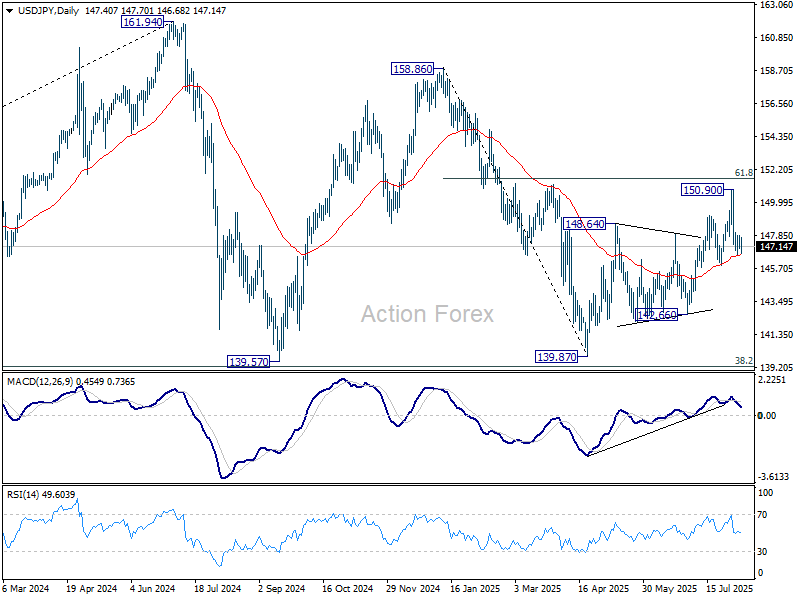
In the bigger picture, price actions from 161.94 (2024 high) are seen as a corrective pattern to rise from 102.58 (2021 low). Decisive break of 61.8% retracement of 158.86 to 139.87 at 151.22 will argue that it has already completed with three waves at 139.87. Larger up trend might then be ready to resume through 161.94 high. In case the corrective pattern extends with another fall, strong support is expected from 38.2% retracement of 102.58 to 161.94 at 139.26 to bring rebound.
GBP/JPY Mid-Day Outlook
Daily Pivots: (S1) 196.25; (P) 196.67; (R1) 197.25; More...
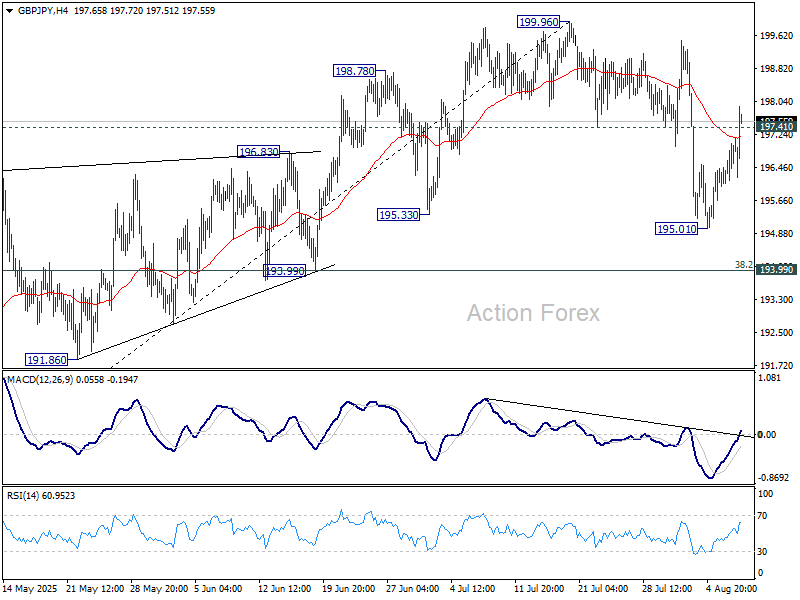
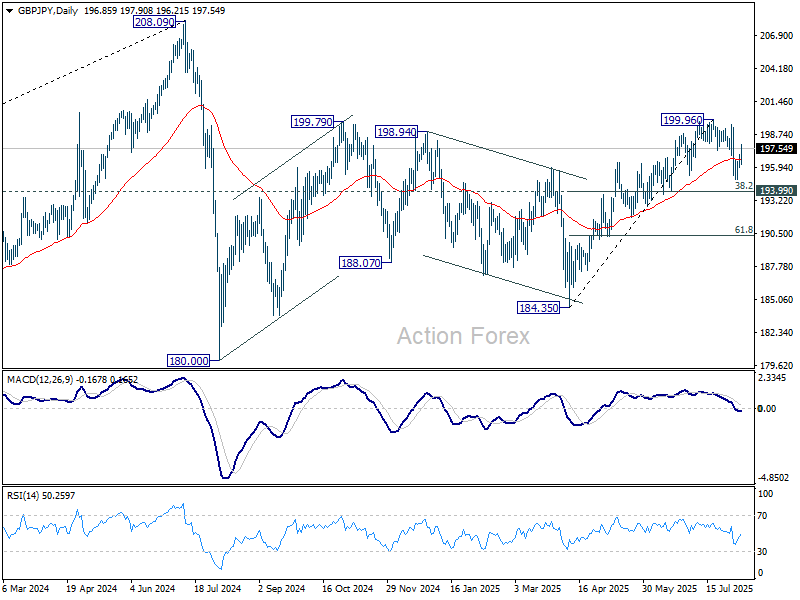
GBP/JPY's break of 197.41 support turned resistance suggests that corrective pullback from 199.96 has already completed at 195.01. Intraday bias in back on the upside for retesting 199.96 high. Firm break there will resume the rally from 184.35. In case of another fall, strong support is expected from 193.99 cluster support (38.2% retracement of 184.35 to 199.96 at 193.99) to bring rebound.
In the bigger picture, price actions from 208.09 (2024 high) are seen as a correction to rally from 123.94 (2020 low). The pattern might still extend with another falling leg. But in that case, strong support should be seen from 38.2% retracement of 123.94 to 208.09 at 175.94 to contain downside. Meanwhile, decisive break of 208.09 will confirm long term up trend resumption.
EUR/GBP Mid-Day Outlook
Daily Pivots: (S1) 0.8707; (P) 0.8720; (R1) 0.8742; More...
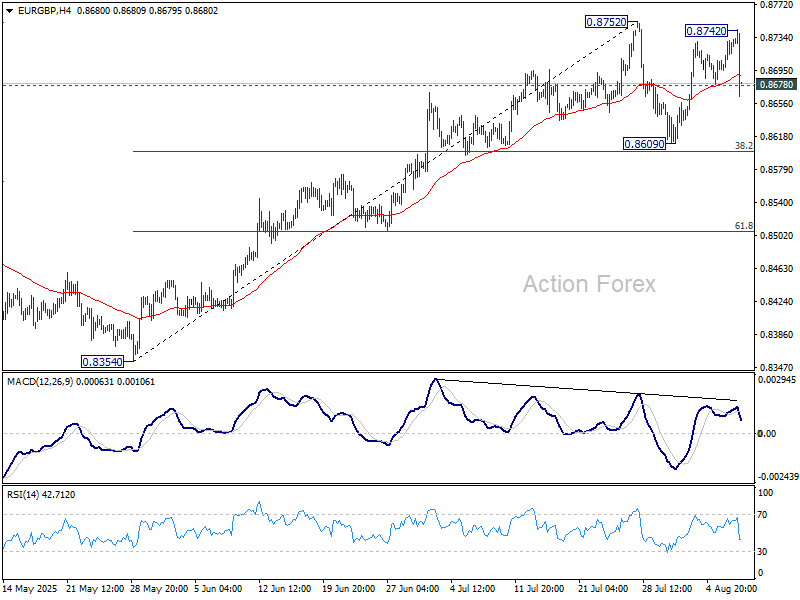
EUR/GBP's steep decline and break of 0.8678 support suggests that consolidation pattern from 0.8752 is extending with another falling leg. Deeper decline might be seen but downside should be contained by 38.2% retracement of 0.8354 to 0.8752 at 0.8600. On the upside, firm break of 0.8752 will resume the rise from 0.8354 towards 0.8867 fibonacci level.
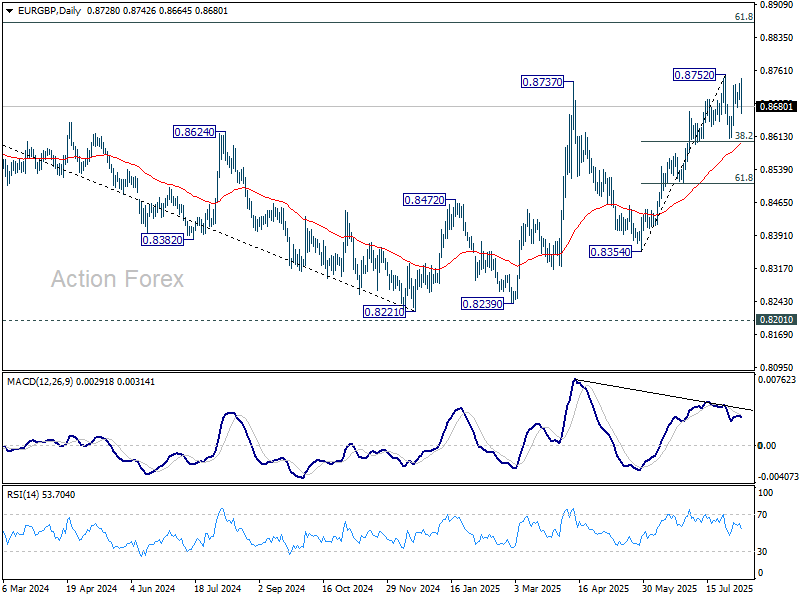
In the bigger picture, the structure from 0.8221 medium term bottom are not impulsive enough to suggest that it's reversing the down trend from 0.9267 (2022 high). But even if it's a correction, further rise is expected to 61.8% retracement of 0.9267 to 0.8221 at 0.8867. This will remain the favored case as long as 55 W EMA (now at 0.8493) holds.
BoE’s Hawkish Cut Sparks Sterling Rally
Sterling surged across the board after the BoE delivered a widely expected rate cut to 4.00%, but with a much tighter vote split than markets anticipated. Four of the nine Monetary Policy Committee members voted to keep rates unchanged, signaling persistent concerns about upside inflation risks. This hawkish undercurrent, paired with Governor Andrew Bailey’s cautious tone, undercut expectations for an accelerated easing cycle and helped Sterling lead currency gains on the day.
The hawkish composition of the vote suggests that a follow-up cut in September can be basically ruled out. Odds for a November reduction remain slightly in play, but confidence has diminished. Much will hinge on whether inflation indeed peaks at 4% in September as projected, and if it visibly starts to retreat in October. Until then, investors may treat incoming inflation and wage data as binary catalysts for the next policy move.
Bailey reiterated in the press conference that while the policy path remains downward, it is now clouded by uncertainty. “We do not cut too quickly or by too much,” he warned, highlighting energy and food prices as short-term distortions. His response to questions about the policy direction was telling: while still confident about the eventual path, the Governor acknowledged that the timing and scale of future moves are more uncertain than before.
In the currency markets, Sterling is currently the day’s top performer. Kiwi and Aussie followed in strength, reflecting an underlying risk-on tilt in sentiment. At the other end, Swiss Franc lagged broadly, followed by Euro and Loonie. Dollar and Yen were mixed as they consolidated recent losses.
In Japan, the government downgraded its GDP growth outlook for the fiscal year to 0.7% from 1.2%, citing US tariffs’ drag on capital spending and inflation’s toll on private consumption. Despite the downgrade, the government maintained hope that wage growth would overtake inflation in 2026, supporting a modest recovery in domestic demand-led growth.
In India, Prime Minister Narendra Modi responded forcefully to President Trump’s imposition of a 50% tariff on Indian goods, insisting that his government would not compromise on the welfare of farmers. The message came as Indian and Russian officials met in Moscow to reaffirm their strategic partnership, a sign that geopolitical alignment may further complicate the tariff dispute.
In Europe, at the time of writing, FTSE is down -0.75%. DAX is up 1.65%. CAC is up 1.13%. UK 10-year yield is up 0.027 at 4.56. Germany 10-year yield is down -0.001 at 2.649. Earlier in Asia, Nikkei rose 0.65%. Hong Kong HSI rose 0.69%. China Shanghai SSE rose 0.16%. Singapore Strait Times rose 0.72%. Japan 10-year JGB Yield fell -0.016 to 1.486.
US initial jobless claims rise to 226k, continuing claims highest since late 2021
US initial jobless claims rose 7k to 226k in the week ending August 2, above expectation of 220k. Four-week moving average of initial claims fell -500 to 221k.
Continuing claims rose 38k to 1974k in the week ending July 26, highest since November 6 2021. Four-week moving average of continuing claims rose 5k to 1952k.
BoE cuts to 4.00%, hawkish 5-4 vote lifts Sterling
BoE delivered a widely expected 25 basis point rate cut, lowering the Bank Rate to 4.00% and continuing its cautious easing cycle. However, a hawkish four-member minority, including Chief Economist Huw Pill, Megan Greene, Clare Lombardelli, and Catherine Mann voted to hold rates steady, reflecting continued concern over lingering inflation pressures.
Governor Andrew Bailey led the five-member majority in favor of the reduction, and no member supported a larger reduction (Alan Taylor voted to cut bank rate by 50 bps in first round but changed to 25 bps in second round to avoid hold).. This signals that while easing continues, the BoE is far from embracing a more aggressive cutting path.
The BoE's updated projections show inflation expected to rise temporarily, peaking around 4.0% in September before falling back toward the 2% target. However, the MPC noted that upside risks to medium-term inflation "have moved slightly higher" since May, citing concerns that temporary price increases could entrench wage and pricing behaviors. This inflation vigilance likely explains the hawkish vote split and continued pushback against front-loading cuts.
On the growth side, the MPC noted that underlying GDP "remains subdued", with slack emerging in the labor market. While domestic and global uncertainties persist, the committee acknowledged that trade policy risk has “diminished somewhat”—a nod to easing tensions after recent UK-U.S. tariff agreements.
Even with economic momentum fading, the MPC maintained that policy is “not on a pre-set path,” emphasizing a “gradual and careful approach” to further easing.
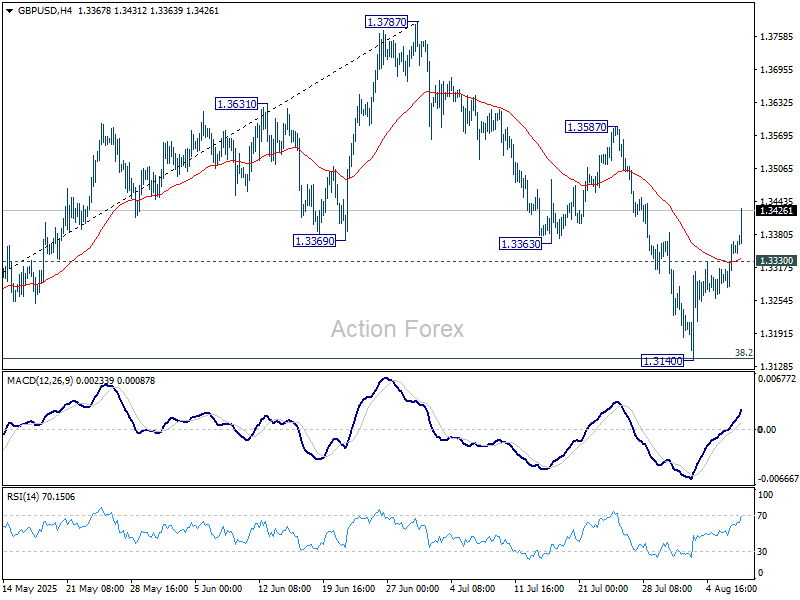
Sterling responded positively to the rate cut and the hawkish tilt in the vote. GBP/USD's rally from 1.3140 accelerates after the announcement. Current development further affirms the case that correction from 1.3787 has completed with three waves down to 1.3140. Further rise should be seen to 1.3587 resistance first. Firm break there will target a retest on 1.3787 high.
RBNZ survey signals one more cut, then long pause ahead
RBNZ’s August Survey of Expectations suggests the central bank will likely cut rates only once more in 2025, but the outlook beyond that remains cautious. The OCR is forecast to decline from 3.25% to 3.02% by September 2025 — consistent with a single 25bps move, likely in this month's meeting. By June 2026, it’s seen at 2.86%, implying a second cut is possible in H1 2026, but far from assured.
Inflation expectations continue to ease gradually. One-year-ahead CPI forecasts slipped from 2.41% to 2.37%, while two-year-ahead projections fell marginally from 2.29% to 2.28%. Wage inflation expectations were mixed, with one-year views dropping to 2.61% while two-year expectations rose to 2.88%, implying confidence that wage pressures will not reignite inflation risks over the medium term.
The unemployment outlook also improved slightly, with expectations for joblessness falling across all time horizons. Despite soft growth conditions, respondents see GDP rising 1.66% over the next year and 2.16% the year after. Taken together, the survey points to a slow-moving easing cycle ahead, starting with one cut likely later this year, followed by a potentially long pause.
Strong oil, soybean demand drives China import spike, cuts surplus
China’s July trade data surprised to the upside, with exports rising 7.2% yoy and imports jumping 4.1% yoy — the largest annual gain in over a year. Strong commodity demand underpinned the figures, as soybean imports surged 18.5% yoy and crude oil shipments rose 11.5% yoy.
The trade surplus came in at USD 98.2 B, narrower than the expected USD 107.9B, suggesting stronger domestic demand helped balance trade flows.
While the numbers offer a positive signal for global demand, investors remain focused on the looming August 12 deadline to finalize a lasting trade agreement with the US. The strong data may give Beijing some negotiating leverage, but uncertainty remains high.
EUR/GBP Mid-Day Outlook
Daily Pivots: (S1) 0.8707; (P) 0.8720; (R1) 0.8742; More...
EUR/GBP's steep decline and break of 0.8678 support suggests that consolidation pattern from 0.8752 is extending with another falling leg. Deeper decline might be seen but downside should be contained by 38.2% retracement of 0.8354 to 0.8752 at 0.8600. On the upside, firm break of 0.8752 will resume the rise from 0.8354 towards 0.8867 fibonacci level.
In the bigger picture, the structure from 0.8221 medium term bottom are not impulsive enough to suggest that it's reversing the down trend from 0.9267 (2022 high). But even if it's a correction, further rise is expected to 61.8% retracement of 0.9267 to 0.8221 at 0.8867. This will remain the favored case as long as 55 W EMA (now at 0.8493) holds.
US initial jobless claims rise to 226k, continuing claims highest since late 2021
US initial jobless claims rose 7k to 226k in the week ending August 2, above expectation of 220k. Four-week moving average of initial claims fell -500 to 221k.
Continuing claims rose 38k to 1974k in the week ending July 26, highest since November 6 2021. Four-week moving average of continuing claims rose 5k to 1952k.

XAU/USD: Gold Cracks Key Resistance Zone on Fresh Wave of Safe Haven Demand
Gold price rose on Thursday morning as new packages of increased US import tariffs took effect, adding to high global uncertainty and prompting investors into safety.
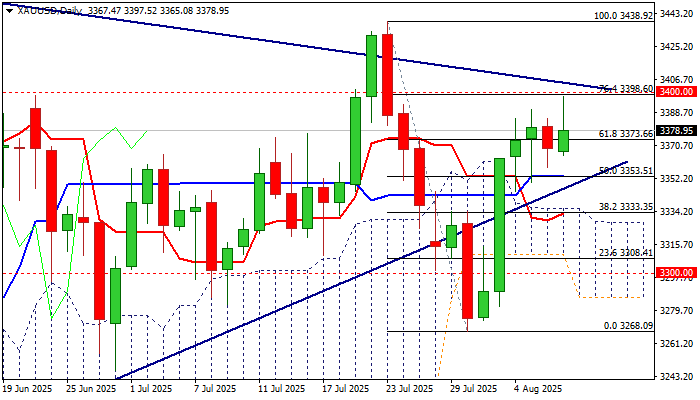
Fresh rise cracked strong resistances at $3400 zone (Fibo 76.4% of $3438/$3268 / psychological /upper triangle boundary) but failed to break higher on first attempt.
As expected, bulls faced headwinds and metal’s price eased to the mid-point of congestion that extends into third straight day.
Technical picture on daily chart has improved, but flat momentum (slightly above the centreline) and overbought stochastic warning, after gold faced a double false break below and above triangle recently.
However, triangle is narrowing, and eventual clear break is likely to be seen in coming sessions that would generate fresh direction signal.
Current favorable fundamentals contribute to bullish scenario, with sustained break above $3400 zone to signal bullish continuation and expose targets at $3438 and $3452 (tops of July 23 / June 16) guarding key barrier at $3500 (new record high, posted on Apr 22).
Conversely, violation of triangle support line ($3347) would weaken near-term structure, but extension below daily cloud top ($3335) will be required to verify fresh negative signal and shift focus towards key supports at $3300 / $3286 / $3268 (psychological /daily cloud base / July 30 multi-week low).
Res: 3400; 3405; 3414; 3438.
Sup: 3365; 3353; 3347; 3335.
Dollar Index (DXY) Elliott Wave: Selling Rallies at the Blue Box
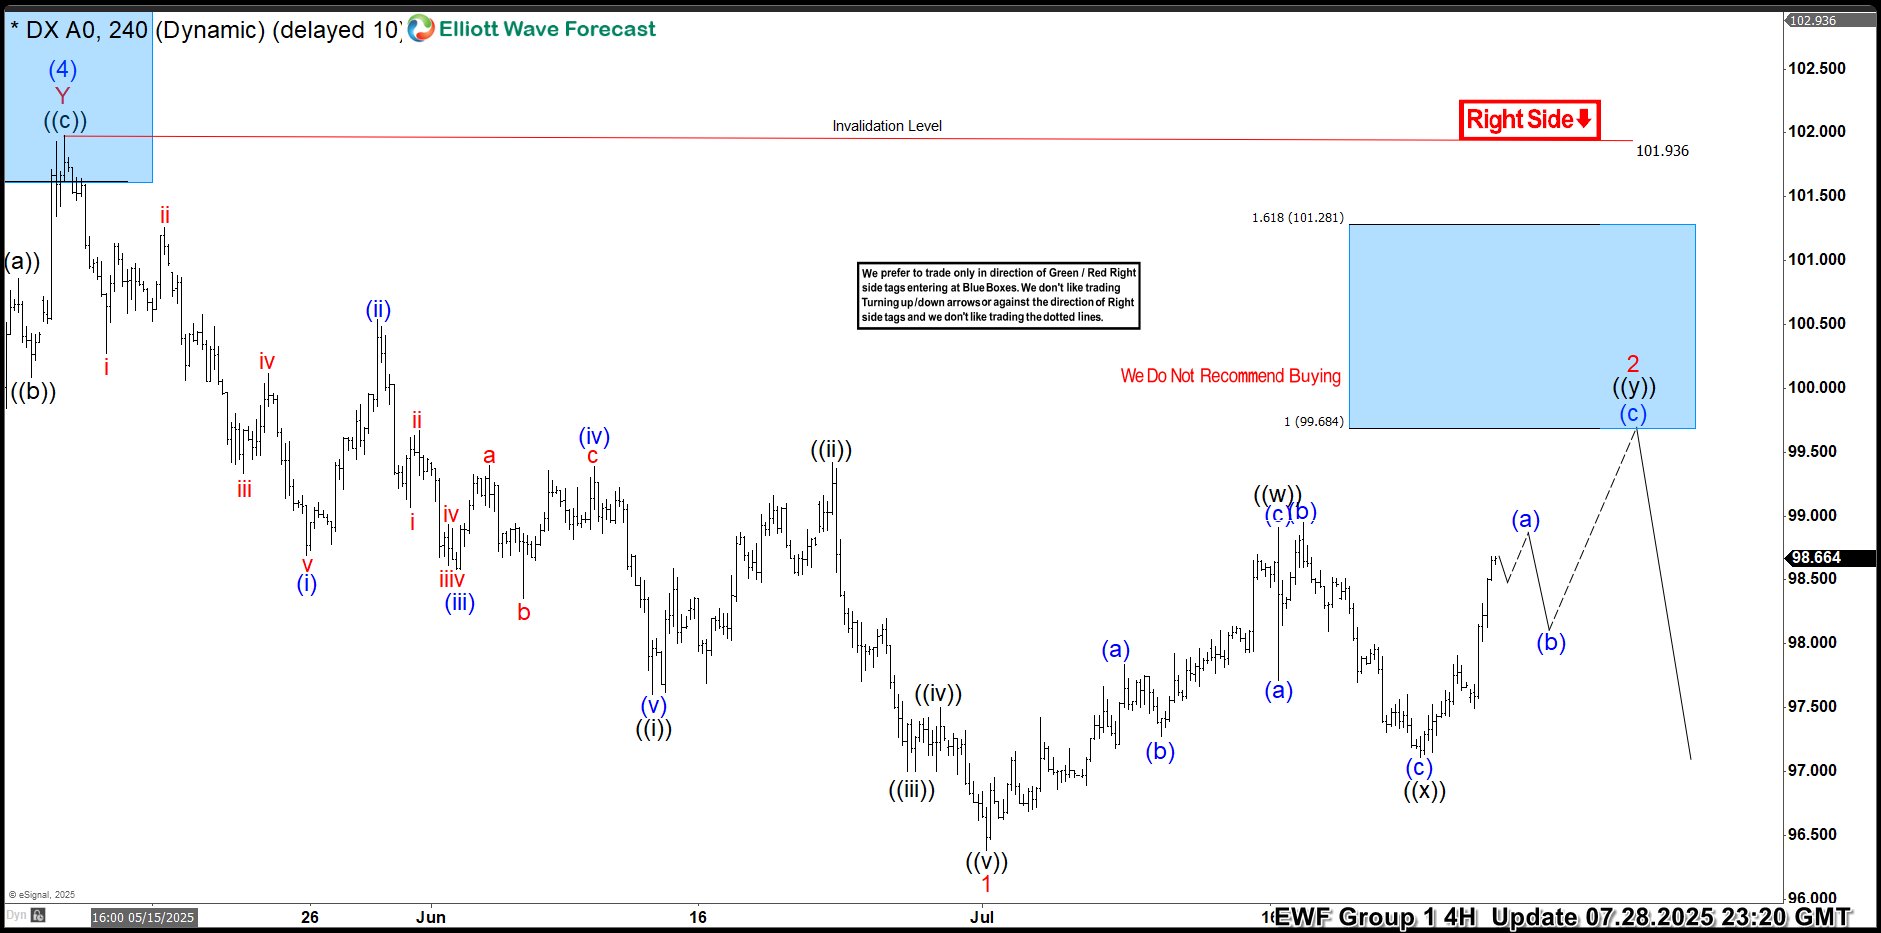
Hello traders. In this article, we are going to present another Elliott Wave trading setup we got in Dollar Index . As our members know DXY index remains bearish against the 101.936 pivot. Recently Dollar made a clear 3 waves recovery completed precisely at the Equal Legs zone, referred to as the Blue Box Area. In the following sections, we are going to explain Elliott Wave pattern and discuss the trading setup.
DXY Elliott Wave 4 Hour Chart 07.28.2025
Dollar is doing recovery against the 101.936 peak. The price action suggest that recovery is still incomplete at the moment , suggesting potentially more short term strength. This correction can see another leg up toward the Blue Box zone at 99.68-101.28 area, where we are looking to re-enter as sellers. We recommend members to avoid buying Dollar. As the main trend remains bearish, we expect at least a 3-wave pull back from this Blue Box area. Once the price touches the 50 fibs against the ((x)) black connector, we’ll make positions risk-free and set the stop loss at breakeven and book partial profits. On other hand, breaking above the 101.281 peak would invalidate the trade.
Quick reminder on how to trade our charts :
Red bearish stamp+ blue box = Selling Setup
Green bullish stamp+ blue box = Buying Setup
Charts with Black stamps are not tradable. 🚫
DXY Elliott Wave 4 Hour Chart 07.28.2025
Dollar reached the Blue Box area between 99.68-101.28 and, as expected, found sellers. DXY has made a solid decline from our Selling Zone. As a result, any short positions taken from the Blue Box should now be risk-free, with partial profits already booked. At this point, we would like to see a further decline and a break below the July 1st low to confirm that the next leg down is in progress.
GBPUSD Elliott Wave Forecast: Buying the Dips in the Blue Box
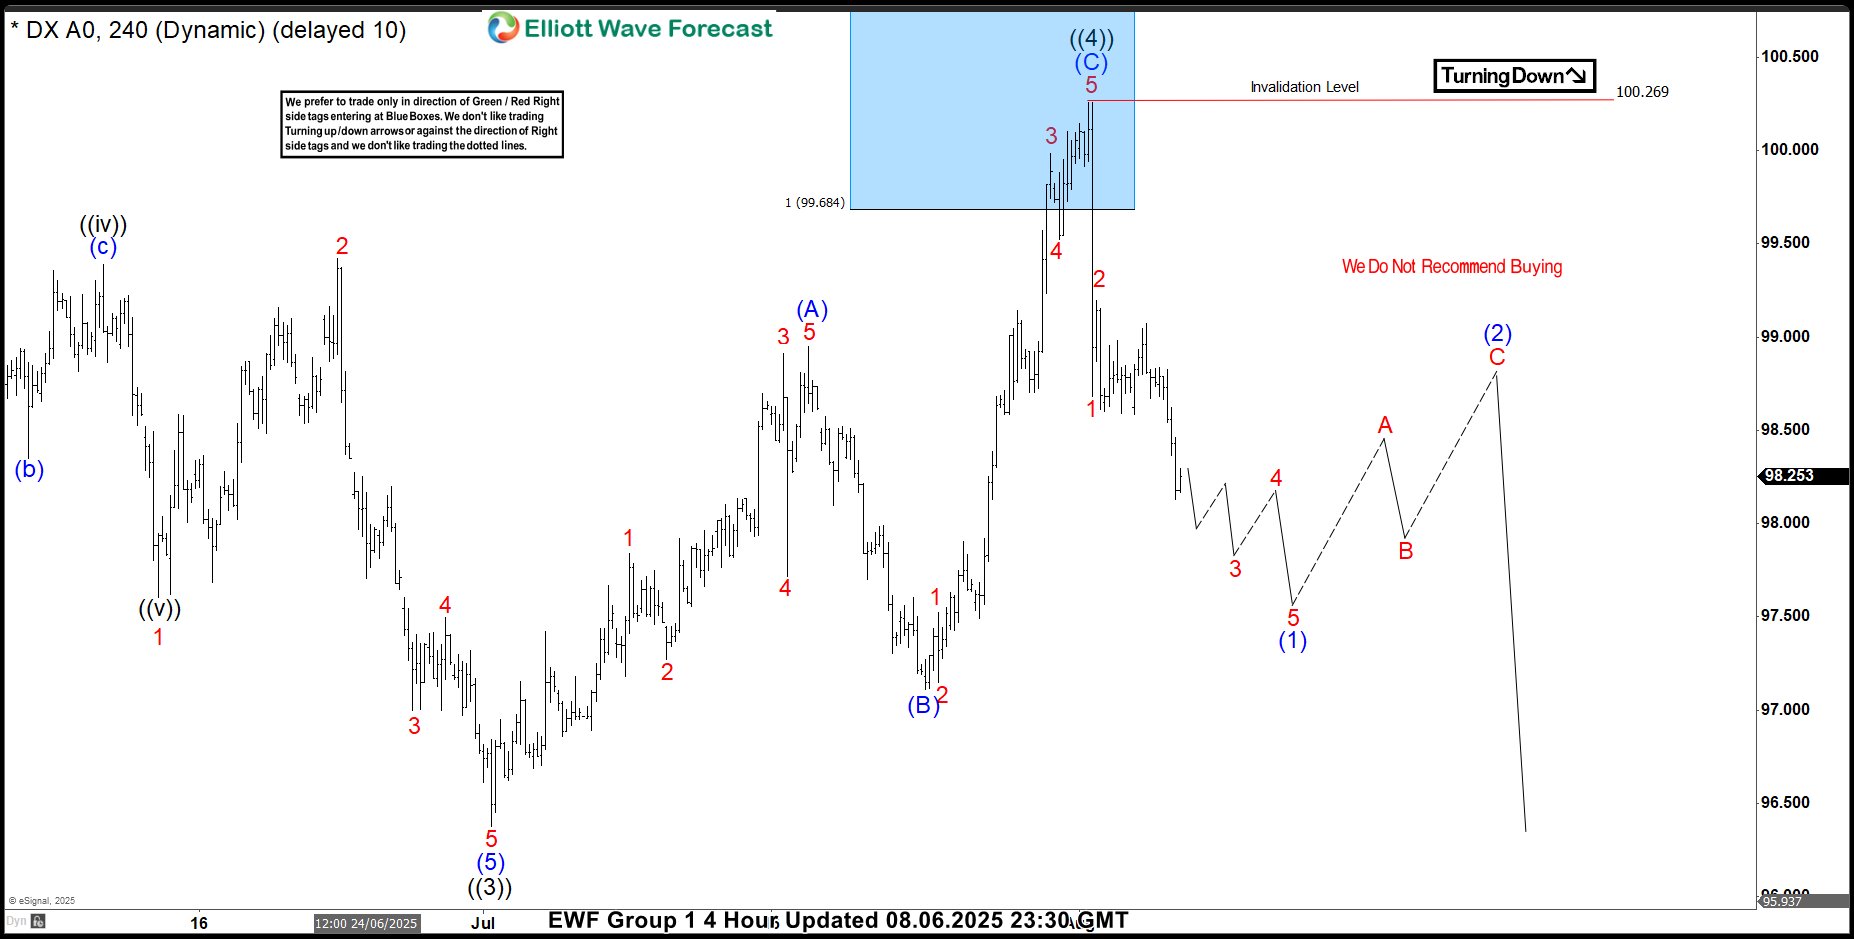
As our members know we have had many profitable trading setups recently. In this technical article, we are going to talk about another Elliott Wave trading setup we got in GBPUSD. The pair has completed its correction exactly at the Equal Legs zone, also known as the Blue Box Area. In this article, we’ll break down the Elliott Wave forecast, explain the trading setup in detail, and provide the upside target.
GBPUSD Elliott Wave 4 Hour Chart 07.26.2025
The price action suggests that GBPUSD is forming a pullback in the form of a double three (WXY) structure. While price remains below the red X connector, we believe the correction is still in progress and expect another leg lower toward the 1.3156 area , where we are looking to re-enter as buyers. We recommend that members avoid selling GBPUSD, as the main trend remains bullish. We anticipate at least a three-wave bounce from the Blue Box area.Once the price reaches the 50% Fibonacci retracement against the red X connector, we will make the position risk-free by moving the stop loss to breakeven and booking partial profits.
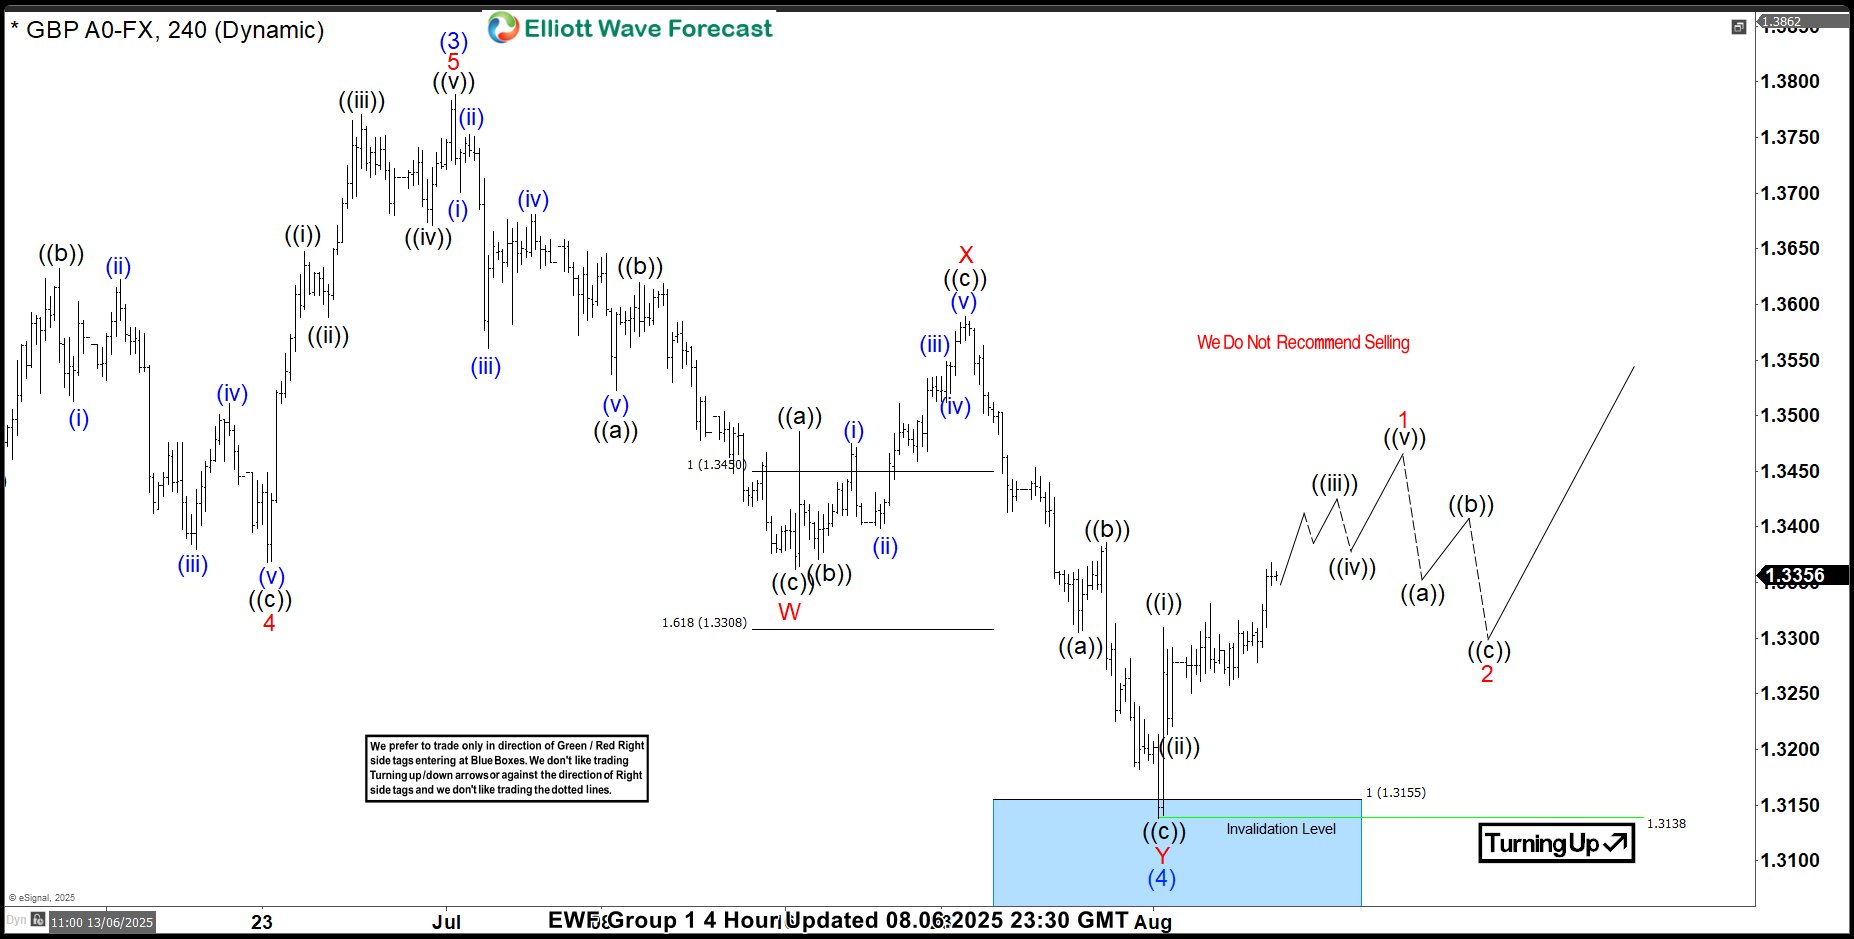
GBPUSD Elliott Wave 4 Hour Chart 08.06.2025
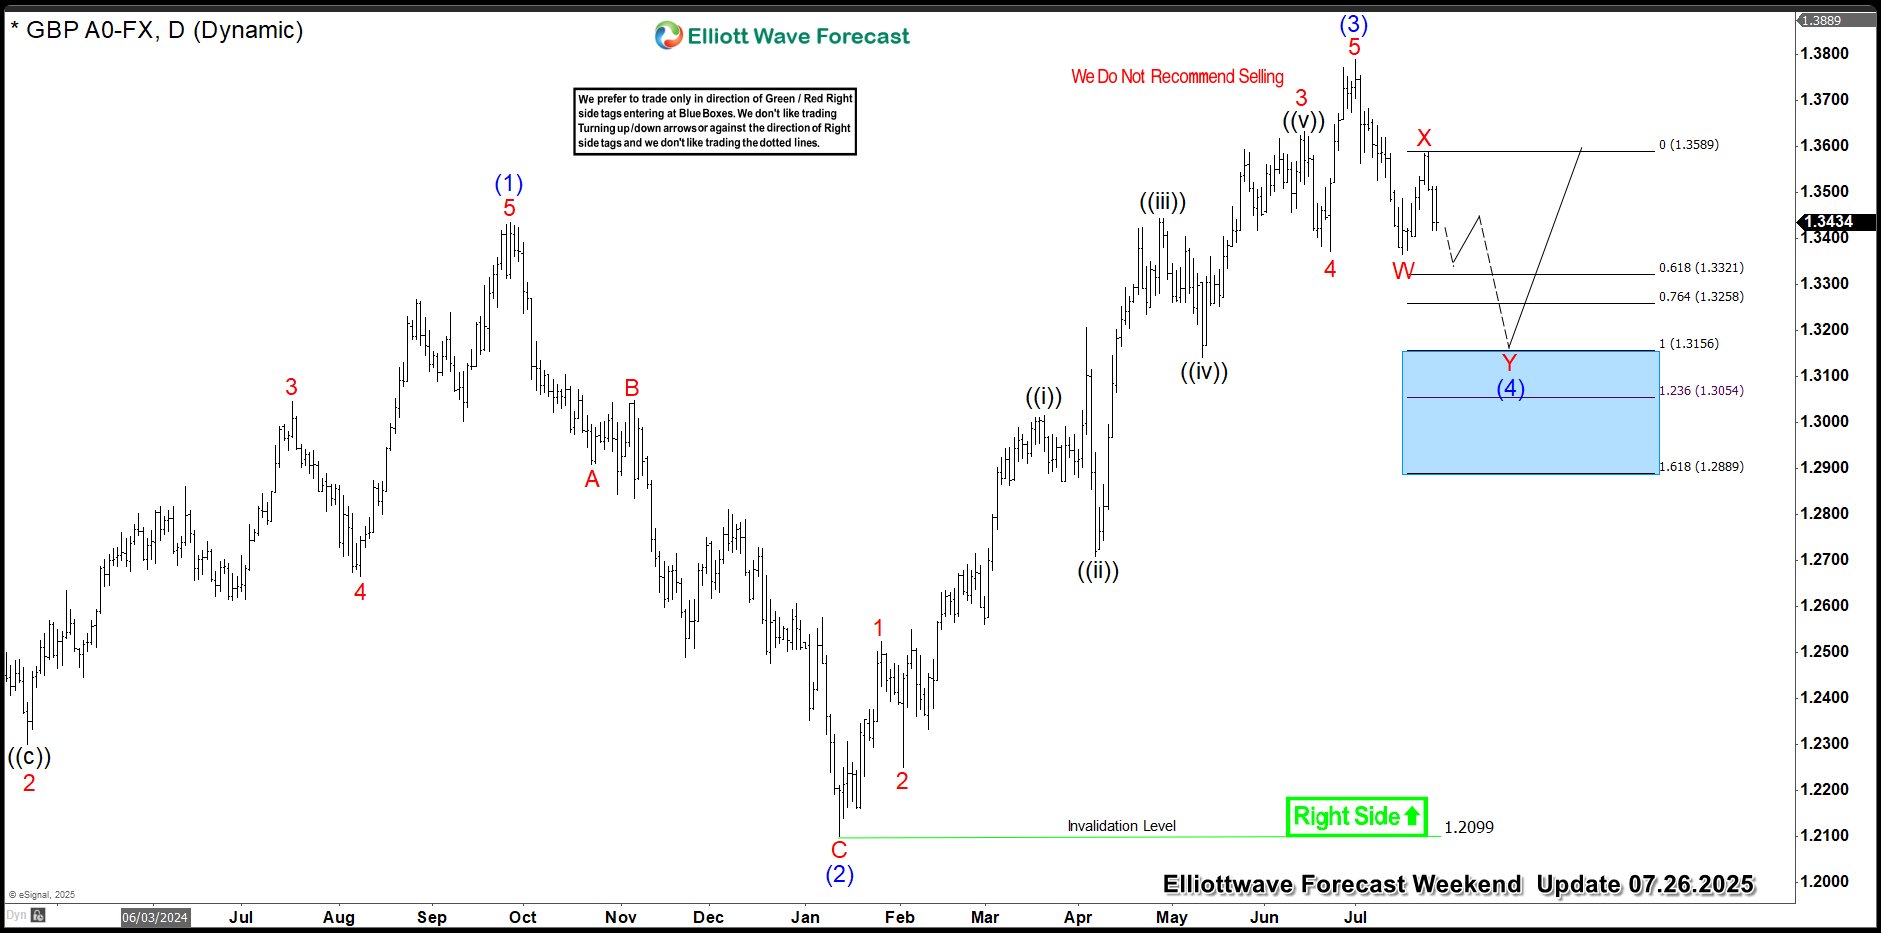
The pair has made another wave down and completed 7 swings pattern at the Blue Box area. The pair found buyers as expected, making decent bounce. Reaction from the buying zone has reached 50 fibs against the X red connector. Consequently, any long positions from the Blue Box should now be risk-free. We’ve set our stop loss at breakeven and have already secured partial profits. While price holds above 1.3138, we consider the wave (4) correction complete and see potential for wave (5) to be in progress toward the 1.3936 area.