Sample Category Title
USD/CAD Daily Outlook
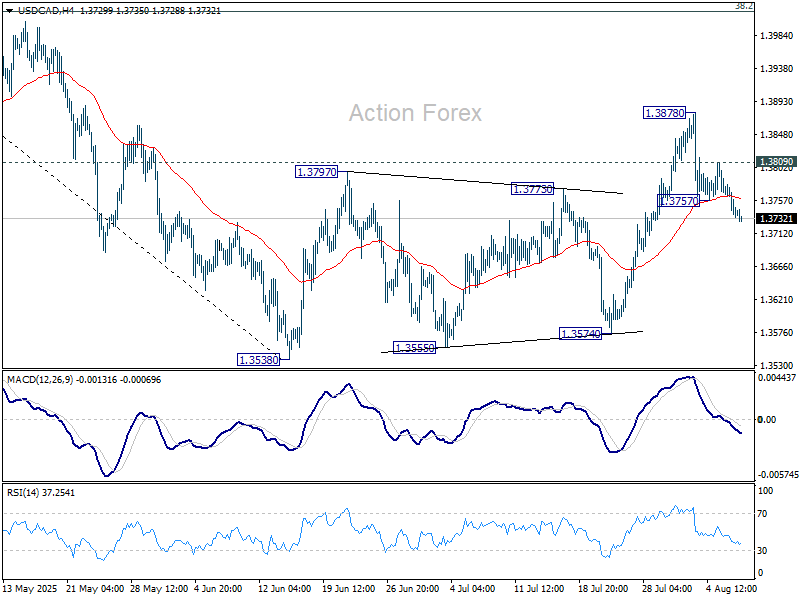
Daily Pivots: (S1) 1.3724; (P) 1.3752; (R1) 1.3769; More...
USD/CAD's fall from 1.3878 resumed by breaking through 1.3757 temporary low and intraday bias is back on the downside. Current development suggests that corrective rebound from 1.3538 has completed with three waves up to 1.3878. Deeper fall should be seen to retest 1.3538 low. On the upside, however, above 1.3809 will dampen this view and turn bias neutral again.
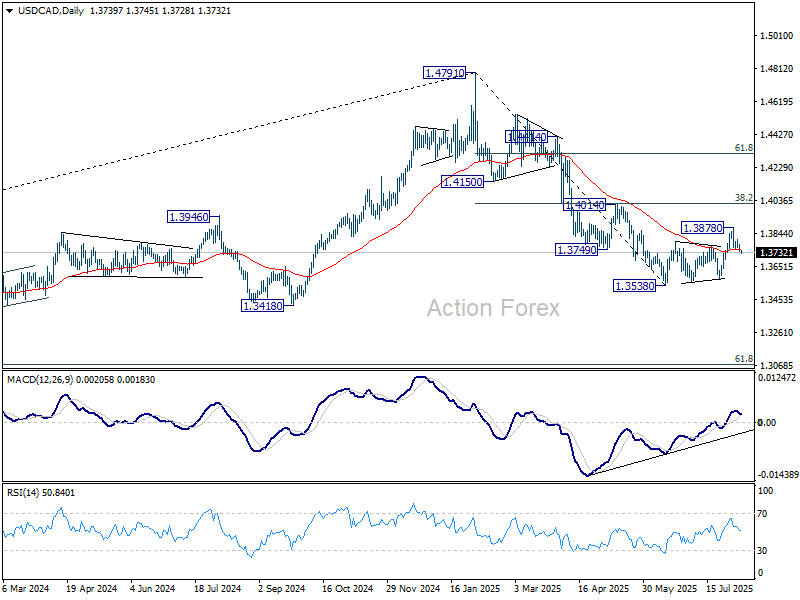
In the bigger picture, price actions from 1.4791 medium term top could either be a correction to rise from 1.2005 (2021 low), or trend reversal. In either case, further decline is expected as long as 1.4014 resistance holds. Next target is 61.8% retracement of 1.2005 (2021 low) to 1.4791 at 1.3069.
Tariffs and Doves Drive Dollar Lower, Split BoE to Cut
Dollar came under pressure again in Asian session, deepening this week’s selloff as traders digested a flood of tariff developments and dovish commentary from Fed officials. While Asian equity markets held steady with modest gains, the currency markets showed clearer directional bias, with the greenback slipping alongside Swiss Franc and Yen. Euro, Aussie and Kiwi firmed up, while risk sentiment in equities remained somewhat cautious but resilient.
Overnight, multiple Fed speakers leaned toward affirming a rate cut in September. While they avoided endorsing a faster pace of easing, the tone shift was clear: concern is growing about labor market softness, and inflation—while still elevated—is no longer the primary fear. That aligns with the Fed’s June dot plot, which already signaled two cuts in H2 2025. Additional dovish commentary in coming days may not shift pricing much unless it opens the door to three cuts.
Meanwhile, the macro backdrop was quickly overtaken by a fresh round of US tariff moves. President Donald Trump surprised markets by announcing a second 25% tariff on Indian imports, citing continued oil purchases from Russia. The latest round comes on top of duties scheduled to begin Thursday and reflects a dramatic escalation in secondary sanctions enforcement.
In parallel, Trump raised the possibility of targeting China next, depending on what unfolds in coming days. He said "It may happen" when asked if similar tariffs could be imposed on Beijing, after citing dissatisfaction with China’s handling of Russian trade ties. That adds extra uncertainty ahead of the August 12 deadline to finalize a long-term truce following the US-China framework agreement struck in May and updated in June.
In a signal of shifting geopolitical alignment, Indian Prime Minister Narendra Modi is reportedly planning a visit to China for the August 31 Shanghai Cooperation Organisation summit. It would be his first trip to Beijing in over seven years, and comes at a time when New Delhi's ties with Washington are rapidly fraying. The move may indicate India is hedging its bets diplomatically amid escalating US trade threats.
Japan also found itself blindsided. According to a Kyodo report, contrary to earlier assumptions, the 15% US country-specific tariff on Japanese imports will not replace existing duties, but will stack on top of them. A White House official clarified that Tokyo had misunderstood the bilateral deal's terms. That gives the EU preferential treatment over Japan and adds to Tokyo's frustration. Japanese officials have not yet announced a response, but the development adds strain to what was seen as a stable alliance.
Switzerland, meanwhile, failed in its last-ditch effort to avert crippling 39% tariffs. President Karin Keller-Sutter returned from Washington without meeting Trump or any top trade official. With over 60% of Swiss exports affected, the government has called an emergency meeting to formulate a response.
The tech space is now at the center of the tariff war. Trump confirmed a 100% tariff on chip imports unless companies build in the US. While the criteria remain vague, this marks the most aggressive sector-specific measure yet. Apple’s new USD 100B investment pledge in the US was cited as validation of the policy. Major global chipmakers, including TSMC and Nvidia, are already expanding US production, but the tariff scope remains uncertain.
In Asia, at the time of writing, Nikkei is up 0.43%. Hong Kong HSI is up 0.50%. China Shanghai SSE is up 0.12%. Singapore Strait Times is up 0.81%. Japan 10-year JGB yield is down -0.009 at 1.492. Overnight, DOW rose 0.18%. S&P 500 rose 0.73%. NASDAQ rose 1.21%. 10-year yield rose 0.024 to 4.220.
Fed doves gain ground as Cook, Collins highlight drag from uncertainty
In a panel discussion overnight, Fed Governor Lisa Cook described July’s weaker-than-expected jobs report as “concerning” and noted that the pattern of downward revisions to payroll figures was “somewhat typical of turning points.”
Cook warned that uncertainty is now acting like a tax on businesses, with executives spending more time managing ambiguity than making forward-looking decisions. “This is deadweight loss,” she said.
Boston Fed President Susan Collins supported that view, stating the uncertainty burden is “top of mind” for firms across sectors. She pointed out that the effects extend beyond capital spending, with many businesses now hesitant to adjust pricing strategies due to a lack of visibility. “There’s still a wait-and-see,” Collins said.
The shared emphasis from two Fed officials underscores how economic ambiguity is increasingly viewed as a constraint on both employment and inflation dynamics. While neither Cook nor Collins offered direct policy guidance, their comments will reinforce expectations that the Fed is growing more open to easing, particularly if labor and business activity remain sluggish into the fall.
Fed's Daly: Rate cut likely soon as labor market risks mount
San Francisco Fed President Mary Daly said overnight that she expects the central bank will need to cut interest rates “in the coming months,” citing a gradually cooling economy and persistent downside risks in the labor market. “I would see additional slowing as unwelcome,” Daly warned, adding that the labor market tends to “fall quickly and hard” once momentum is lost.
Daly also downplayed the inflationary impact of US tariffs, saying they pose only a short-term threat. Excluding tariff effects, she noted, inflation has been “gradually trending down,” and should continue to ease given restrictive policy and moderating demand.
Fed’s Kashkari reaffirms case for two cuts, says economy slowing
Minneapolis Fed President Neel Kashkari reiterated his view that two rate cuts in 2025 remain a reasonable base case, telling CNBC overnight that “the economy is slowing — and that means, in the near term, it may become appropriate to start adjusting the federal-funds rate.” The comment aligns with growing expectations for a September cut, especially after last week’s soft jobs data.
However, Kashkari’s remarks are broadly consistent with the position he laid out in June, when he wrote in an essay that tariff impacts may be more muted than feared due to corporate adaptations and exemptions. At the time, he argued that these offsetting forces would allow inflation to ease gradually, supporting a measured policy adjustment.
In both June and today’s comments, Kashkari has signaled a preference for patience but also preparedness. Barring any surprises, his base case still assumes a September move, followed by another later in the year.
RBNZ survey signals one more cut, then long pause ahead
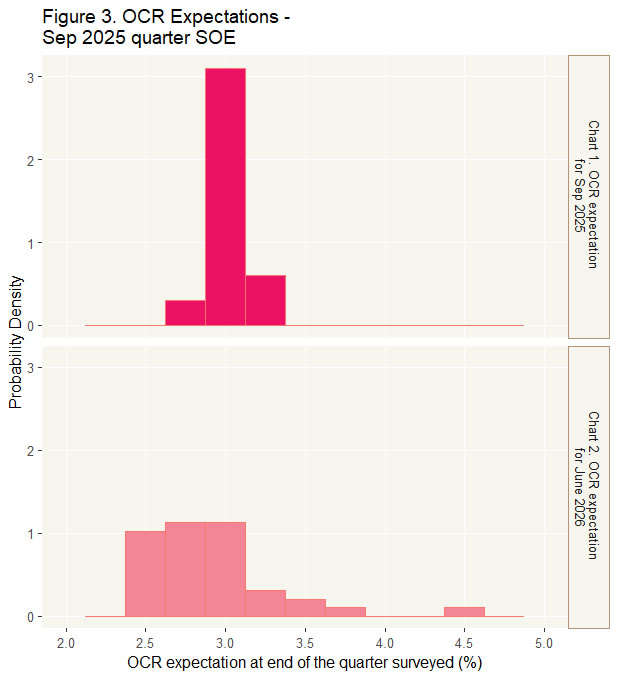
RBNZ’s August Survey of Expectations suggests the central bank will likely cut rates only once more in 2025, but the outlook beyond that remains cautious. The OCR is forecast to decline from 3.25% to 3.02% by September 2025 — consistent with a single 25bps move, likely in this month's meeting. By June 2026, it’s seen at 2.86%, implying a second cut is possible in H1 2026, but far from assured.
Inflation expectations continue to ease gradually. One-year-ahead CPI forecasts slipped from 2.41% to 2.37%, while two-year-ahead projections fell marginally from 2.29% to 2.28%. Wage inflation expectations were mixed, with one-year views dropping to 2.61% while two-year expectations rose to 2.88%, implying confidence that wage pressures will not reignite inflation risks over the medium term.
The unemployment outlook also improved slightly, with expectations for joblessness falling across all time horizons. Despite soft growth conditions, respondents see GDP rising 1.66% over the next year and 2.16% the year after. Taken together, the survey points to a slow-moving easing cycle ahead, starting with one cut likely later this year, followed by a potentially long pause.
Strong oil, soybean demand drives China import spike, cuts surplus
China’s July trade data surprised to the upside, with exports rising 7.2% yoy and imports jumping 4.1% yoy — the largest annual gain in over a year. Strong commodity demand underpinned the figures, as soybean imports surged 18.5% yoy and crude oil shipments rose 11.5% yoy.
The trade surplus came in at USD 98.2 B, narrower than the expected USD 107.9B, suggesting stronger domestic demand helped balance trade flows.
While the numbers offer a positive signal for global demand, investors remain focused on the looming August 12 deadline to finalize a lasting trade agreement with the US. The strong data may give Beijing some negotiating leverage, but uncertainty remains high.
BoE to cut as doves, hawks, and moderates collide, EUR/GBP set for wild swings
BoE is set to cut interest rates by 25bps to 4.00% today, continuing its steady easing cycle that began a year ago. The decision would mark the fifth rate cut since last August. Crucially, today’s announcement will also include updated economic forecasts that could shed light on how far the BoE is willing—or able—to go with further easing.
With UK GDP shrinking in both April and May, the need for additional support is evident. The IMF recently warned that UK economic growth could stall at just 0.1% for both Q3 and Q4, setting the stage for stagflation.
However, inflation remains a concern. Headline CPI rose 3.6% in June—well above the 2% target—and any upward revision in today's CPI forecasts could tighten the BoE’s policy space. If projections inch toward 4%, it would significantly complicate any aggressive easing path.
The decision is also likely to see a notable division within the Monetary Policy Committee. Hawks like Huw Pill and Catherine Mann may vote to hold rates, while doves such as Swati Dhingra and Alan Taylor could push for a deeper 50bps cut. Even Deputy Governor Dave Ramsden is seen as a potential dovish swing vote. Any unexpected alignment or dissent could shift market pricing for future BoE moves.
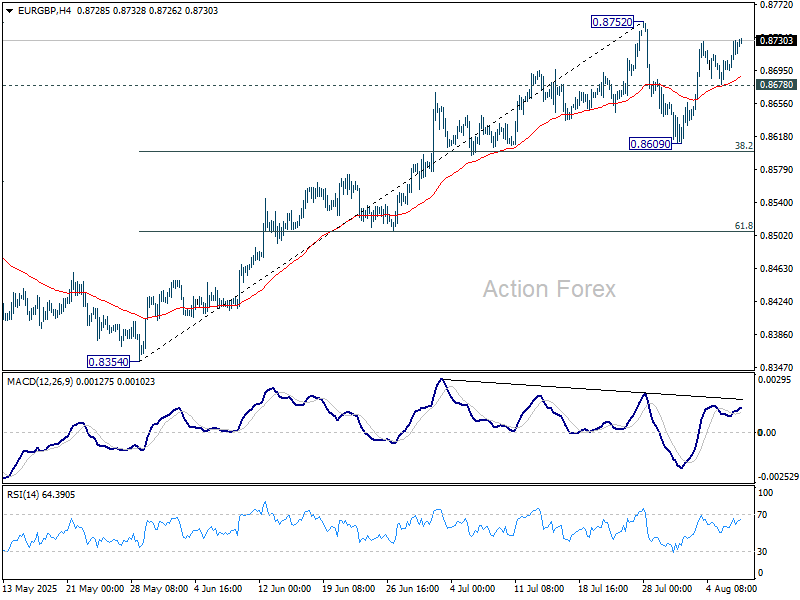
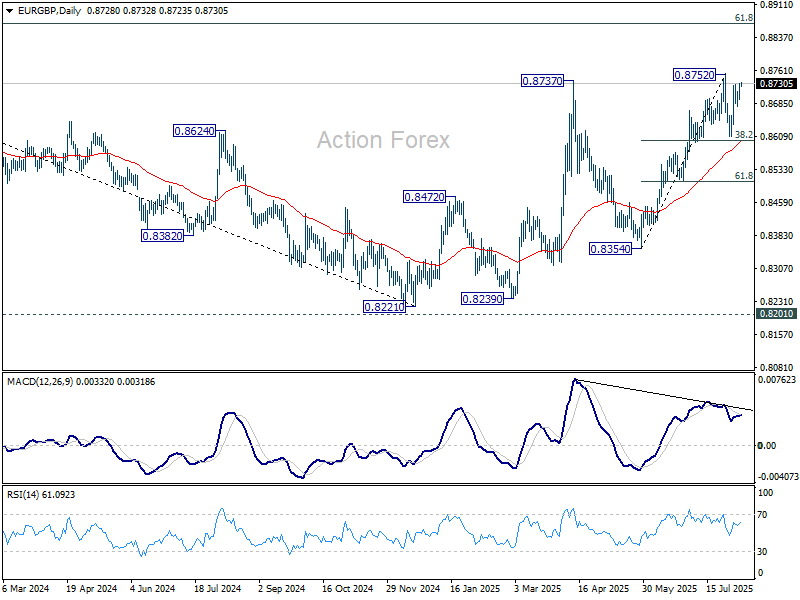
Volatility in EUR/GBP is expected with the rate decision. Technically, it is currently extending the rebound from 0.8609 towards 0.8752 resistance. Strong break there will confirm resumption of whole rally from 0.8221 towards 0.8867 fibonacci level. However, break of 0.8678 support will extend the corrective pattern from 0.8752 towards 0.8609 support again.
USD/CAD Daily Outlook
Daily Pivots: (S1) 1.3724; (P) 1.3752; (R1) 1.3769; More...
USD/CAD's fall from 1.3878 resumed by breaking through 1.3757 temporary low and intraday bias is back on the downside. Current development suggests that corrective rebound from 1.3538 has completed with three waves up to 1.3878. Deeper fall should be seen to retest 1.3538 low. On the upside, however, above 1.3809 will dampen this view and turn bias neutral again.
In the bigger picture, price actions from 1.4791 medium term top could either be a correction to rise from 1.2005 (2021 low), or trend reversal. In either case, further decline is expected as long as 1.4014 resistance holds. Next target is 61.8% retracement of 1.2005 (2021 low) to 1.4791 at 1.3069.
BoE to cut as doves, hawks, and moderates collide, EUR/GBP set for wild swings
BoE is set to cut interest rates by 25bps to 4.00% today, continuing its steady easing cycle that began a year ago. The decision would mark the fifth rate cut since last August. Crucially, today’s announcement will also include updated economic forecasts that could shed light on how far the BoE is willing—or able—to go with further easing.
With UK GDP shrinking in both April and May, the need for additional support is evident. The IMF recently warned that UK economic growth could stall at just 0.1% for both Q3 and Q4, setting the stage for stagflation.
However, inflation remains a concern. Headline CPI rose 3.6% in June—well above the 2% target—and any upward revision in today's CPI forecasts could tighten the BoE’s policy space. If projections inch toward 4%, it would significantly complicate any aggressive easing path.
The decision is also likely to see a notable division within the Monetary Policy Committee. Hawks like Huw Pill and Catherine Mann may vote to hold rates, while doves such as Swati Dhingra and Alan Taylor could push for a deeper 50bps cut. Even Deputy Governor Dave Ramsden is seen as a potential dovish swing vote. Any unexpected alignment or dissent could shift market pricing for future BoE moves.
Volatility in EUR/GBP is expected with the rate decision. Technically, it is currently extending the rebound from 0.8609 towards 0.8752 resistance. Strong break there will confirm resumption of whole rally from 0.8221 towards 0.8867 fibonacci level. However, break of 0.8678 support will extend the corrective pattern from 0.8752 towards 0.8609 support again.
Strong oil, soybean demand drives China import spike, cuts surplus
China’s July trade data surprised to the upside, with exports rising 7.2% yoy and imports jumping 4.1% yoy — the largest annual gain in over a year. Strong commodity demand underpinned the figures, as soybean imports surged 18.5% yoy and crude oil shipments rose 11.5% yoy.
The trade surplus came in at USD 98.2 B, narrower than the expected USD 107.9B, suggesting stronger domestic demand helped balance trade flows.
While the numbers offer a positive signal for global demand, investors remain focused on the looming August 12 deadline to finalize a lasting trade agreement with the US. The strong data may give Beijing some negotiating leverage, but uncertainty remains high.
RBNZ survey signals one more cut, then long pause ahead
RBNZ’s August Survey of Expectations suggests the central bank will likely cut rates only once more in 2025, but the outlook beyond that remains cautious. The OCR is forecast to decline from 3.25% to 3.02% by September 2025 — consistent with a single 25bps move, likely in this month's meeting. By June 2026, it’s seen at 2.86%, implying a second cut is possible in H1 2026, but far from assured.
Inflation expectations continue to ease gradually. One-year-ahead CPI forecasts slipped from 2.41% to 2.37%, while two-year-ahead projections fell marginally from 2.29% to 2.28%. Wage inflation expectations were mixed, with one-year views dropping to 2.61% while two-year expectations rose to 2.88%, implying confidence that wage pressures will not reignite inflation risks over the medium term.
The unemployment outlook also improved slightly, with expectations for joblessness falling across all time horizons. Despite soft growth conditions, respondents see GDP rising 1.66% over the next year and 2.16% the year after. Taken together, the survey points to a slow-moving easing cycle ahead, starting with one cut likely later this year, followed by a potentially long pause.
Fed’s Daly: Rate cut likely soon as labor market risks mount
San Francisco Fed President Mary Daly said overnight that she expects the central bank will need to cut interest rates “in the coming months,” citing a gradually cooling economy and persistent downside risks in the labor market. “I would see additional slowing as unwelcome,” Daly warned, adding that the labor market tends to “fall quickly and hard” once momentum is lost.
Daly also downplayed the inflationary impact of US tariffs, saying they pose only a short-term threat. Excluding tariff effects, she noted, inflation has been “gradually trending down,” and should continue to ease given restrictive policy and moderating demand.
Fed doves gain ground as Cook, Collins highlight drag from uncertainty
In a panel discussion overnight, Fed Governor Lisa Cook described July’s weaker-than-expected jobs report as “concerning” and noted that the pattern of downward revisions to payroll figures was “somewhat typical of turning points.”
Cook warned that uncertainty is now acting like a tax on businesses, with executives spending more time managing ambiguity than making forward-looking decisions. “This is deadweight loss,” she said.
Boston Fed President Susan Collins supported that view, stating the uncertainty burden is “top of mind” for firms across sectors. She pointed out that the effects extend beyond capital spending, with many businesses now hesitant to adjust pricing strategies due to a lack of visibility. “There’s still a wait-and-see,” Collins said.
The shared emphasis from two Fed officials underscores how economic ambiguity is increasingly viewed as a constraint on both employment and inflation dynamics. While neither Cook nor Collins offered direct policy guidance, their comments will reinforce expectations that the Fed is growing more open to easing, particularly if labor and business activity remain sluggish into the fall.
RBNZ: Hawks, Doves, and Kiwis
Overview
The winter of discontent has descended on the New Zealand economy since May. In some respects, business and consumer sentiment has soured, raising questions on exactly when the long-awaited pickup in the economy will become broader based and more sustainable. Parts of the economy are doing well and there is exuberance in the primary sector who are receiving the best returns seen for several years. The Government’s new “Investment Boost” policy might well bring forward some investment in some quarters.
Outside of New Zealand, the trade war has continued to progress – but the degree of heat in the battle has been much lower than feared a few months ago as countries have largely chosen to deal as opposed to fight. Global growth forecasts have picked up as some of the worstcase scenarios have been discounted. Nevertheless, there is still water to go under the bridge as the details of some deals done are unclear, and negotiations continue between the US and some trading partners.
Inflation remains too high, but the economy still has significant excess capacity. Hence there are divergent pressures on the Monetary Policy Committee as they chart the way forward.
Against this backdrop, we expect the RBNZ will deliver another 25bp rate cut at this month’s policy review. It’s unlikely that the RBNZ will call time on the easing cycle just yet as the economy is yet to decisively and sustainably turn.
With all that in mind, in this note we explore some of the hawkish and dovish arguments that might shape discussion regarding the outlook for policy over the coming months.
The Hawk’s Eye View.
Inflation has increased to 2.7% and looks set to reach 3% in the next couple of quarters. Easing further in this context would be unwise.
- A short-term increase in inflation might not be of concern if there is significant excess capacity in the economy. But inflation might not fall back either significantly or quickly, given that the rise in inflation in recent quarters was not envisaged when the easing cycle began a year ago.
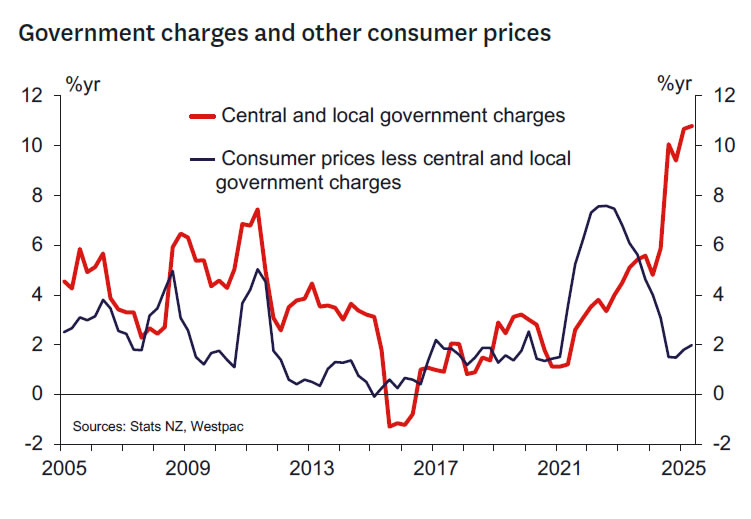
- It’s possible that large increases in a range of administered costs, like rates and electricity charges, will continue as there are ongoing cost pressures in those sectors. If correct, then non-tradables inflation and total inflation will only fall slowly.
- Future cost shocks could boost inflation from an elevated level.
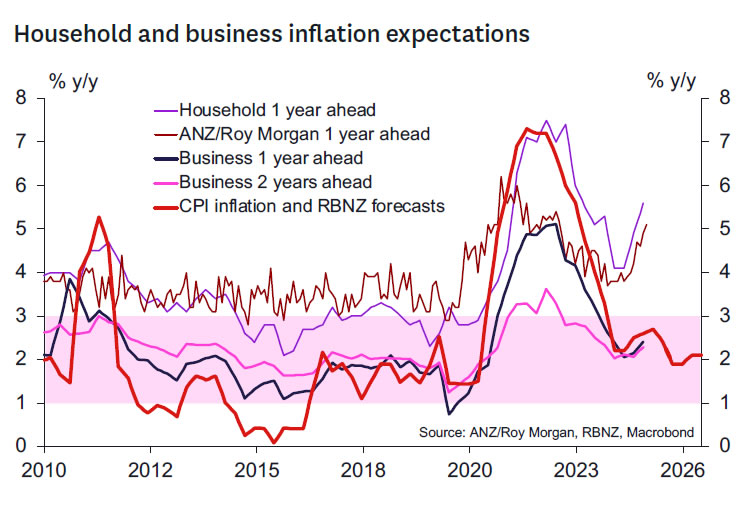
- Inflation expectations are already rising and could impede any sustained fall in inflation to 2%.
The lagged impact of past easing is yet to fully work its way through.
- It is too soon to judge the impact of the OCR easing since August last year. While the OCR has declined by 225bps already, only half of the expected easing in mortgage rates has passed through to the rates paid by households.
- As households continue to refinance, the effective mortgage rate will continue to decline, further stimulating spending.
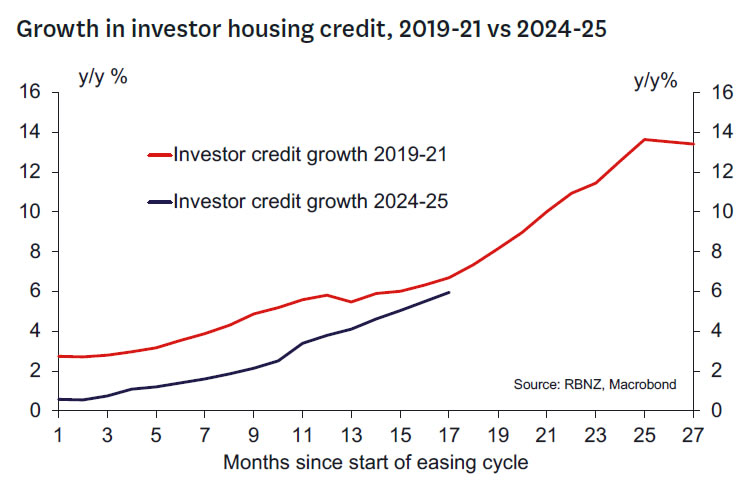
- Housing market investors are already responding to easy financial conditions and are scaling up investment. So far investor demand is not driving prices higher as the housing supply response has been significant. But supply has recovered to 2015 levels now and may be progressively eroded as demand continues, boosting prices as time goes on. We don’t want a repeat of the 2020-21 experience.
The downside risks for global growth are receding and are less uncertain. Much of the case for additional easing in the April and May meetings rested on a weaker global economy.
- While increases in US tariffs will dampen global growth to a degree, they’re not likely to be the significant drag that was initially feared.
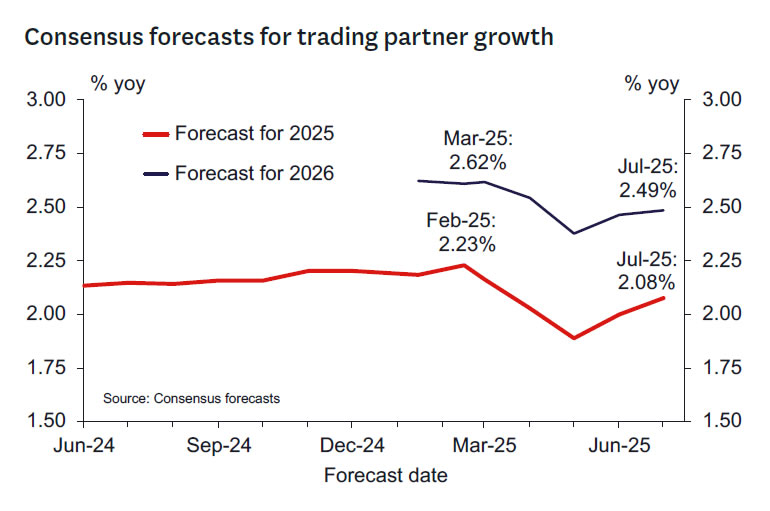
- Forecasts for global growth have been scaled back up as uncertainty has reduced. Consensus and IMF forecasts for global growth are only modestly lower than pre-April levels.
- The Chinese economic outlook seems firmer as policy stimulus is expected to support the economy.
- Prices for our key agricultural exports remain firm. That’s already boosting incomes and spending in rural regions.
The Government’s Investment Boost policy will partially offset downside risks to the growth outlook.
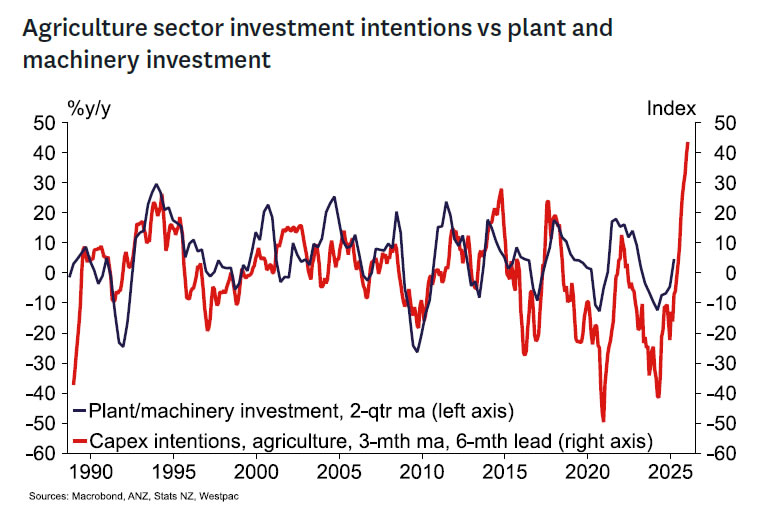
- The Budget included a very generous incentive for firms looking to invest in plant and equipment.
- It’s likely that the agriculture sector will take this golden opportunity with both hands given income levels are so strong.
- Credit growth in the agriculture sector has scaled up significantly as farmers have confidence to do sorely needed investment.
- The tractors are piling up on the dock as dealers scramble to meet orders.
The Dove’s Tale.
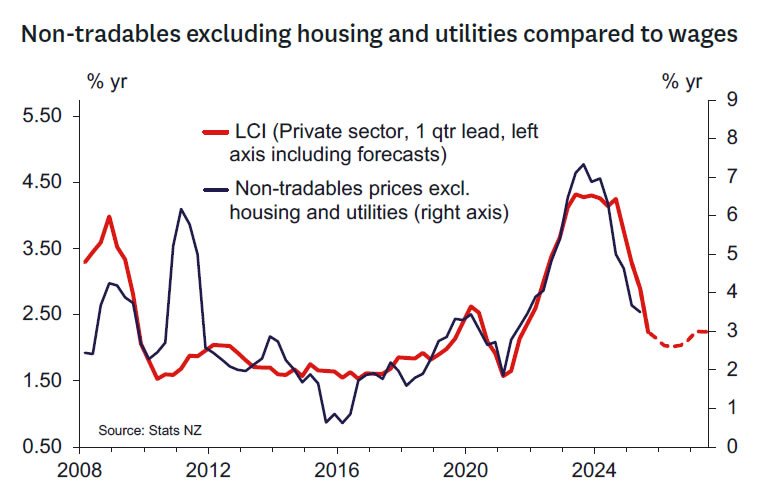
- While non-core items like food have pushed inflation higher, medium-term inflation pressures are contained and indeed continue to weaken.
- Non-tradables inflation outside of the government sector is trending lower and already at or below average levels.
- Businesses in interest rate sensitive sectors like construction are reporting pressure on margins.
- Provided that inflation is expected to remain comfortably within the 1-3% target over the medium term, the RBNZ should use the flexibility provided by the Remit rather than try to fully offset “excess” inflation in the local government sector by forcing further disinflation in the private sector.
Monetary policy needs to be clearly stimulatory to drive the period of above-trend growth needed to absorb spare capacity.
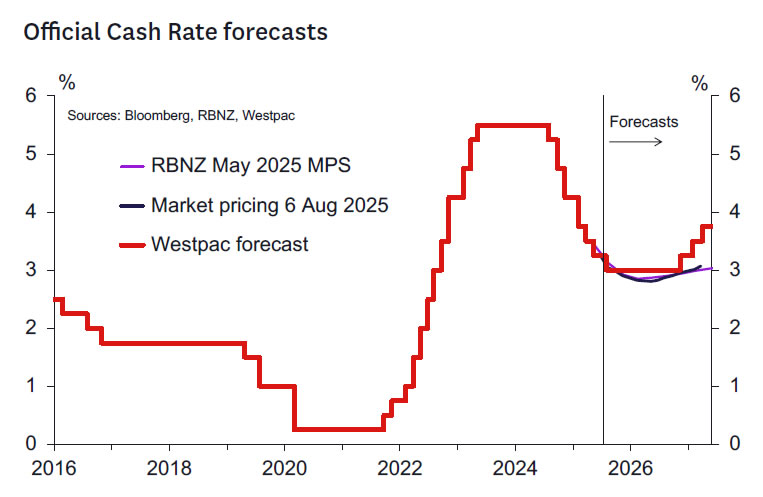
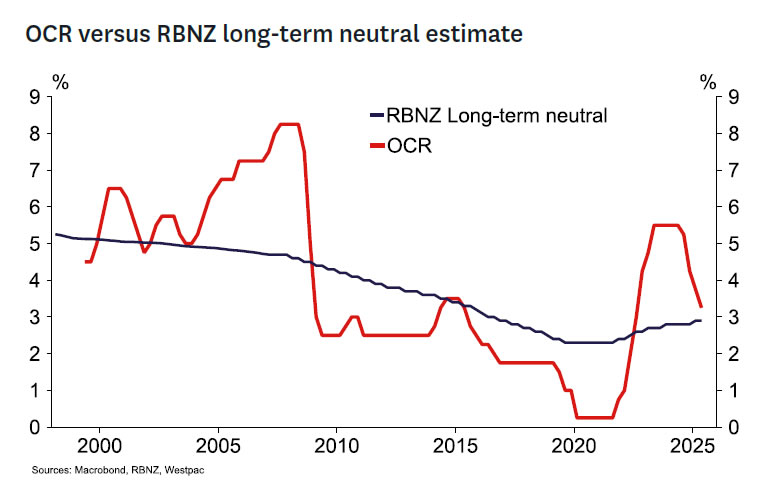
- The RBNZ’s best unbiased estimate is that the longrun neutral OCR is around 3.0% - still below the current OCR.
- Returning the OCR to broadly neutral levels is allowing the economy to grow again. However, until the OCR is moved to a clearly stimulatory level, growth is unlikely to reach the pace required to absorb existing spare capacity in the economy. Historically, outside of crises, the OCR has usually troughed around 50-100bp lower than neutral
- This is especially so with fiscal policy tightening to address the current structural fiscal deficit.
Demand for labour remains especially weak suggesting that the unemployment rate could continue to rise for a while yet.
- Employment fell 0.1% q/q in the June quarter, compared with the 0.2% growth forecast by the RBNZ in May, and the unemployment rate rose to 5.2%.
- Job advertising is yet to turn higher. Firms may be extracting greater productivity gains from their existing labour force, delaying the upturn in hiring.
- If current trends continue, the unemployment rate will continue to rise, thus exceeding the peak forecast in the May MPS (and potentially earlier forecasts that the unemployment rate would peak as high as 5.4%).
- A prolonged period of above-trend unemployment means that wage growth could fall further putting additional downward pressure on non- tradables inflation.
While uncertainty has declined, US trade policy continues to pose downside risks to NZ growth and inflation.
- Confirmation that New Zealand will face a 15% tariff on exports to the US has reduced uncertainty but is clearly unwelcome news for exporters.
- While uncertainty about the size of tariffs faced by key trading partners has reduced, it’s still high, which may restrain households and businesses from consuming and investing and delay the recovery.
- As the economy already has significant spare capacity, there’s room to ease further to insure against the risk of unexpectedly weak economic outcomes.
Silver (XAG/USD) Technical Outlook: Mixed Signals as Rate Cut Expectations Grow
Silver prices have retraced following the initial selloff last week. Friday's US jobs data has obviously been extensively discussed, but that was the end of the initial bearish run for silver prices.
Since Friday Silver has risen around 3% but for now the bearish trend remains intact. The concern is that US rate cut expectations continue to ramp up. This continued today with news that Trump advisers are to push for a temporary Fed governor to fill the seat of resigned Fed Kugler.
A short-term Fed pick would give Trump more time on the Chair choice, the Fed pick is likely to work in the government, and be previously vetted by the Senate.
Such a move may see market expectations for rate cuts ramp up even further. This could work in favor of bulls as the US dollar could come under renewed selling pressure.
Technical Analysis - Silver (XAG/USD)
From a technical standpoint, the bearish trend remains intact as long as we do not get a daily candle close above the 38.22
The current move higher could just be a retracement before the next leg to the downside and a fresh lower low.
There is the descending trendline which was broken and hints at further upside. The ascending trendline is also in play.
This leaves a slightly confusing outlook for Silver moving forward, with the next move looking more like a coin toss at this stage.
The RSI period-14 on the daily chart has crossed above the 50 neutral level which hints at bullish momentum. However a cross back below the 50 level could be a sign that a lower low may be incoming.
A lot to ponder when it comes to Silver prices moving forward. A week ago things looked a lot simpler, highlighting the various factors at play in financial markets.
Silver (XAG/USD) Daily Chart, August 6, 2025
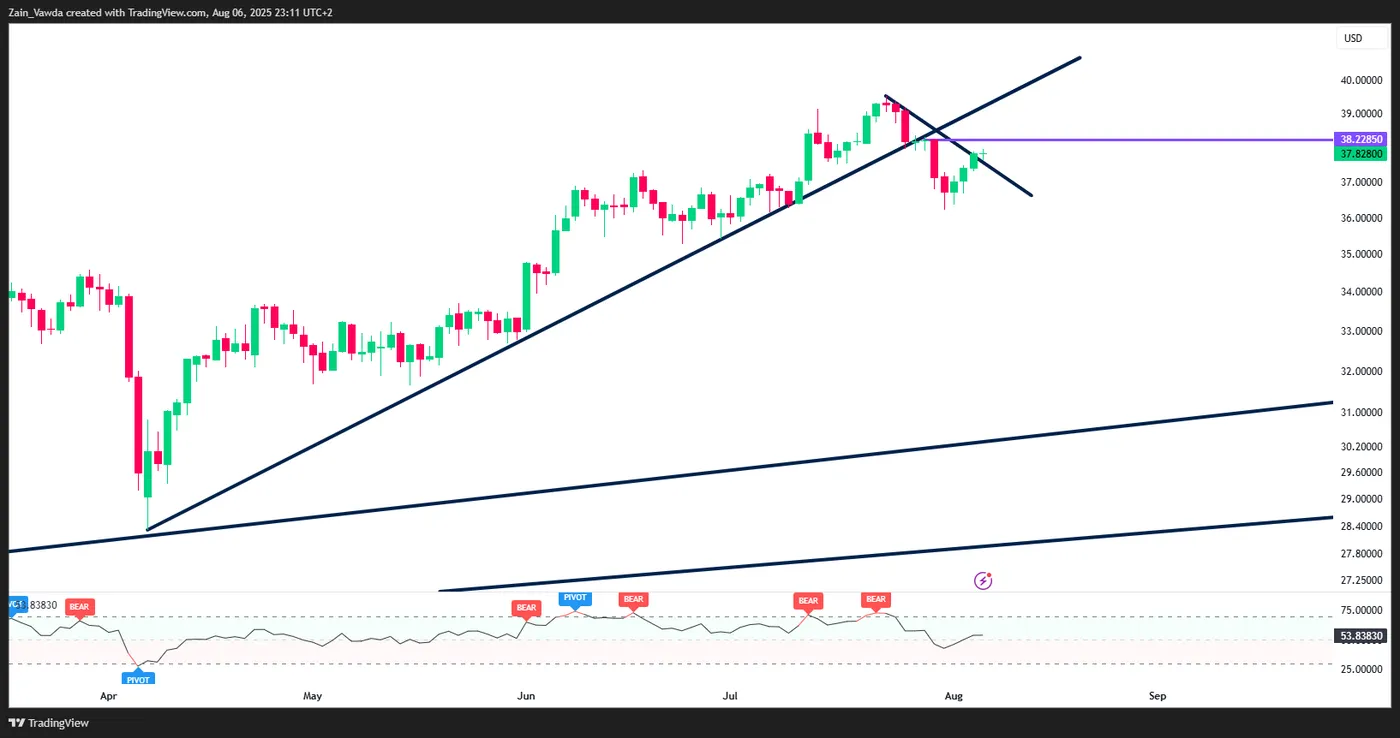
Source: TradingView.com (click to enlarge)
Client Sentiment Data - XAG/USD
Looking at OANDA client sentiment data and market participants are long on the Silver (XAG/USD) with 62% of traders net-long. I prefer to take a contrarian view toward crowd sentiment and thus the fact that so many traders are long means Silver could fall in the near-term.
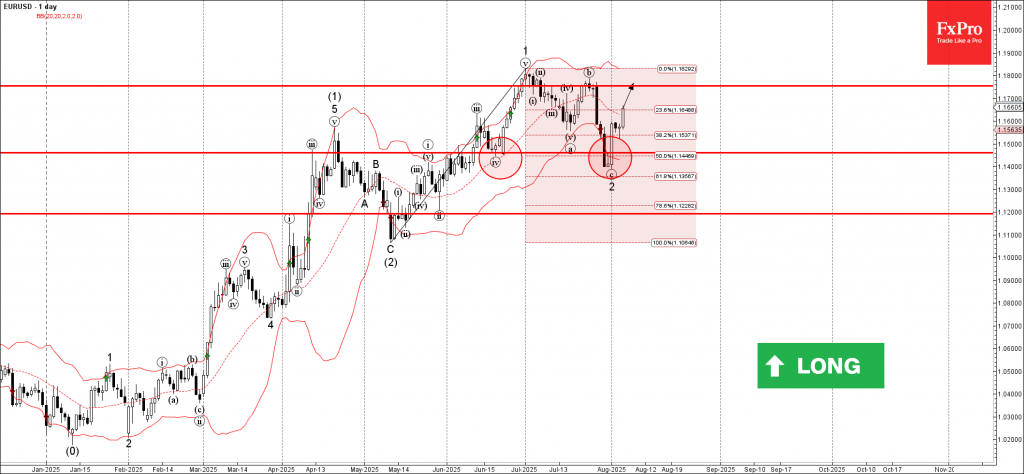
EURUSD Wave Analysis
EURUSD: ⬆️ Buy
- EURUSD reversed from support area
- Likely to rise to resistance level 1.1755
EURUSD currency pair recently reversed from the support area between the strong support level of 1.1500 (former low of wave iv from June), lower daily Bollinger Band and the 50% Fibonacci correction of the upward impulse 1 from May.
The upward reversal from this support area created the clear daily Japanese candlesticks reversal pattern Morning Star.
Given the clear daily uptrend and bearish us dollar sentiment seen today, EURUSD can be expected to rise to the next resistance level 1.1755.