Sample Category Title
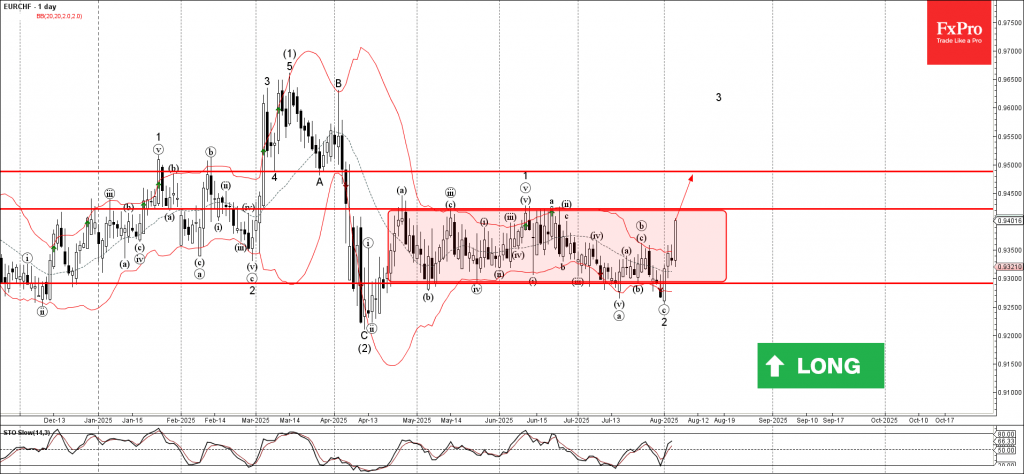
EURCHF Wave Analysis
EURCHF: ⬆️ Buy
- EURCHF rising inside sideways price range
- Likely to test resistance level 0.9420
EURCHF currency pair recently reversed from the support area between the strong support level of 0.9300 (lower border of the sideways price range from April) and the lower daily Bollinger Band.
The upward reversal from this support area created the clear daily Japanese candlesticks reversal pattern Bullish Engulfing – which started active impulse wave 3.
Given the strongly bearish Swiss franc sentiment seen today, EURCHF can be expected to rise to the next resistance level 0.9420 (upper border of the active sideways price range).
Breakout or Fakeout? EUR/GBP Awaits BoE Rate Cut Signal
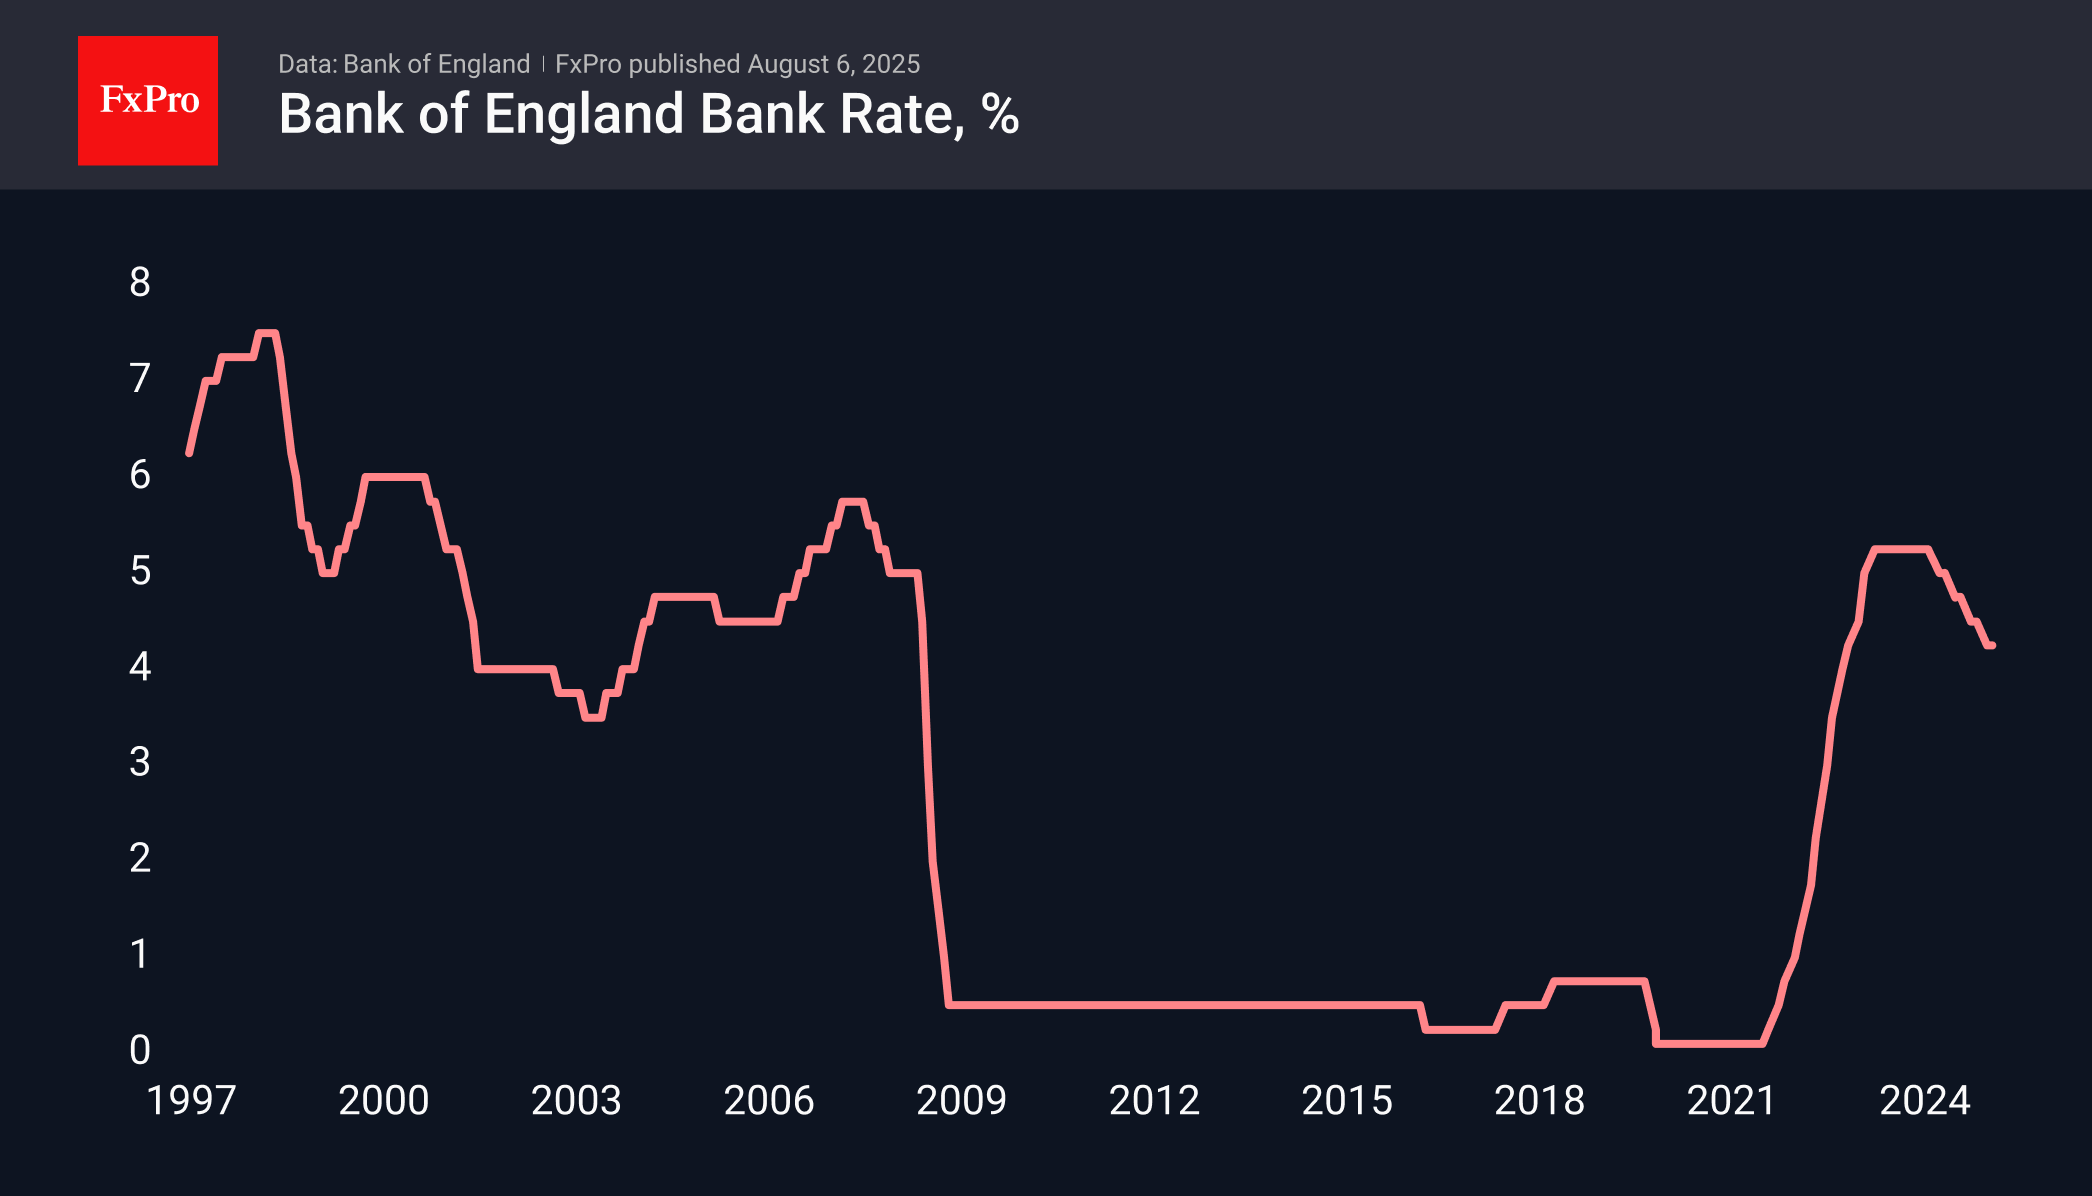
On Thursday, the Bank of England is widely expected by analysts to cut its base rate by a quarter of a point to 4.0%. These expectations are weighing on the pound against the euro and the dollar on Wednesday, as the ECB and the Fed left their rates unchanged in July. Globally, this is a game of catch-up on the part of the BoE, as since August, when the cuts began, the rate has been cut by only 100 points, with 25 more to be added on Thursday. This is significantly less than the ECB’s 235 points and commensurate with the Fed’s 100 points.
The important question is whether the Bank of England will follow the ECB or give hints to raise expectations for further easing. In theory, the BoE has considerable room for this, given the subdued growth rates and the level of policy tightness (the difference between the rate and inflation).
This could be a breakthrough moment for the EURGBP pair. It has approached the upper limit of the trading range of the last two years, exceeding 0.87. A breakout of resistance opens the way to a new range of 0.87–0.92, the upper limit of which acted as resistance from 2016 to 2022.
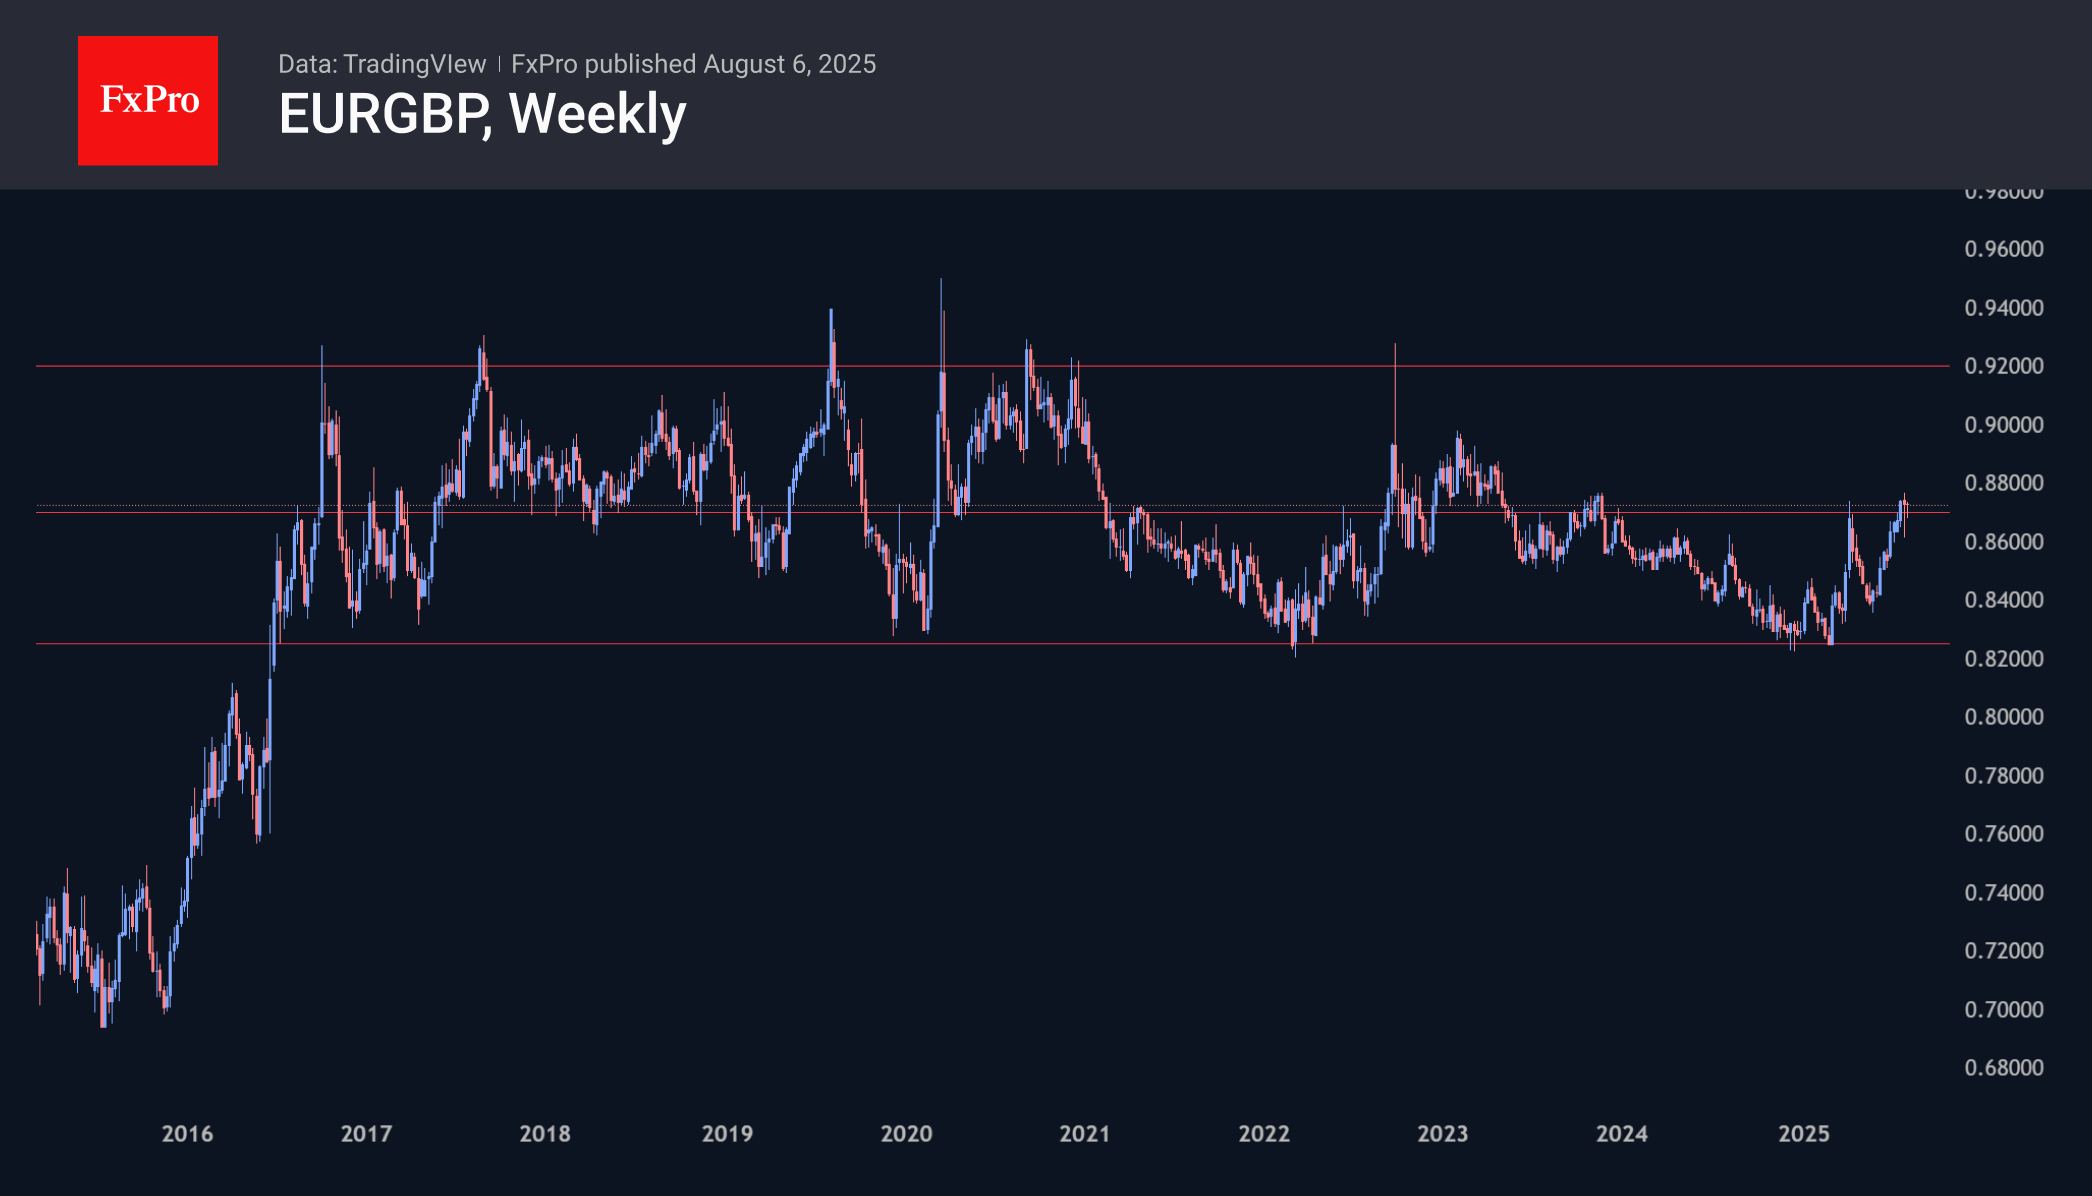
But now there is an equal chance that the Bank of England’s moderately hawkish policy stance will trigger a rebound from the upper limit to the lower limit of 0.8250. There were movements in this direction in April and last week, but the persistence of euro buyers twice thwarted them.
Fed’s Kashkari reaffirms case for two cuts, says economy slowing
Minneapolis Fed President Neel Kashkari reiterated his view that two rate cuts in 2025 remain a reasonable base case, telling CNBC today that “the economy is slowing — and that means, in the near term, it may become appropriate to start adjusting the federal-funds rate.” The comment aligns with growing expectations for a September cut, especially after last week’s soft jobs data.
However, Kashkari’s remarks are broadly consistent with the position he laid out in June, when he wrote in an essay that tariff impacts may be more muted than feared due to corporate adaptations and exemptions. At the time, he argued that these offsetting forces would allow inflation to ease gradually, supporting a measured policy adjustment.
In both June and today’s comments, Kashkari has signaled a preference for patience but also preparedness. Barring any surprises, his base case still assumes a September move, followed by another later in the year.
Bank of England (BoE) Meeting Preview: Job Market Holds the Key as 25 bps Cut Looms
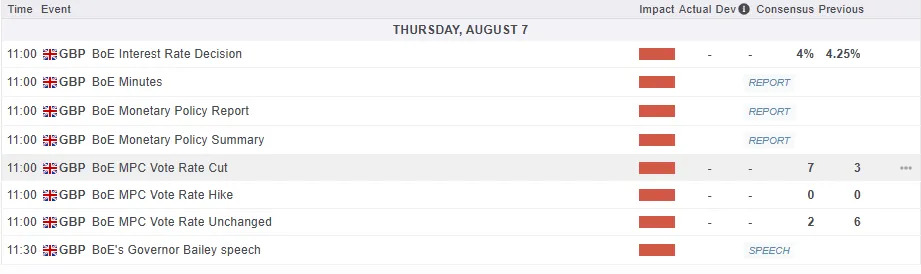
The Bank of England's (BoE) Monetary Policy Committee (MPC) meeting on Thursday, August 7, 2025, is an important moment for the UK economy. Everyone is watching closely for the BoE's decision on interest rates and updated economic forecasts.
The current Bank Rate is 4.25%, after cuts in February and May 2025. Most analysts and market predictions expect a 0.25% cut, bringing the rate down to 4.00%. This move would show the BoE continuing to take a more supportive approach to help the UK economy adjust to current challenges including the labor market.
For all market-moving economic releases and events, see the MarketPulse Economic Calendar
When it comes to the vote split, i do expect seven members to vote for a 0.25% rate cut, with one member possibly disagreeing (either wanting no change or a 0.5% cut). However, this vote split isn’t a strong indicator of future decisions, even though markets often react to it on the day.
What are the Key Concerns for the Bank of England (BoE) Moving Forward?
Labor Market
The labour market has shown signs of cooling. The number of employees on payroll has dropped in seven of the last eight months. The unemployment rate has gone up slightly this year, and the data now seems more reliable than in past years. Job vacancy data from Indeed shows that the UK job market has slowed down more than other major economies.
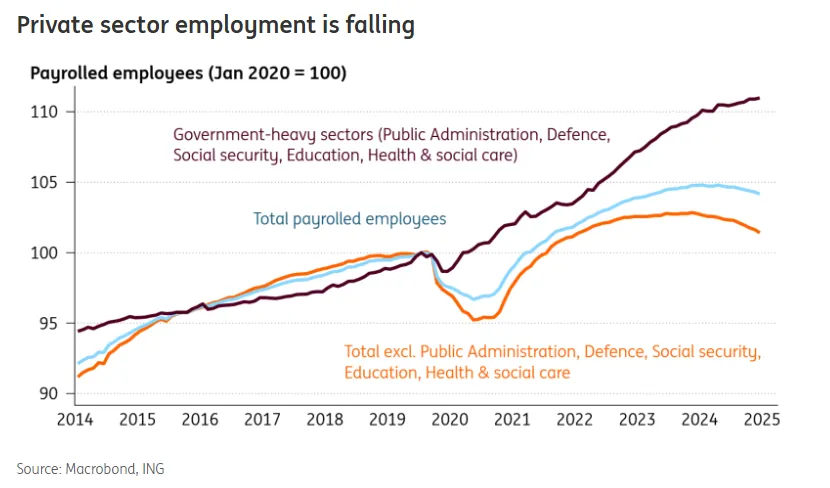
Source: ING
Slowing Economic Growth
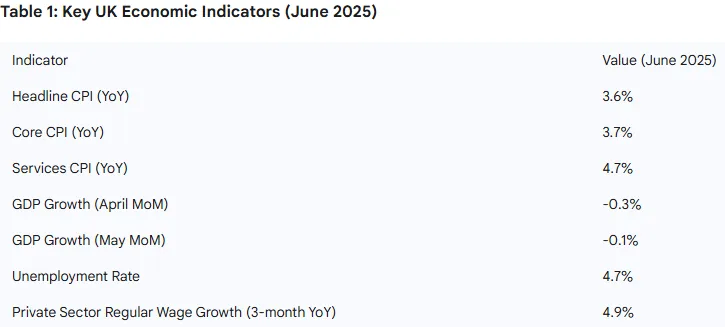
Economic growth has been weaker than expected since the June MPC meeting. The economy shrank by 0.3% in April and 0.1% in May, falling short of the BoE's Q2 growth forecast of 0.25%. The UK economy is struggling with slow growth, a weak housing market, and declining business confidence.
These poor growth numbers are the main reason for the BoE's expected rate cuts, as they pose a bigger risk to stability than high inflation. This shows the Bank is shifting its focus to supporting the economy, even with inflation above target.
Sticky Inflation Keeps the BoE Careful
Inflation remains a key concern despite recent declines. In June 2025, headline inflation (CPI) rose to 3.6%, up from 3.4% in May, staying well above the BoE's 2% target. Core CPI also increased to 3.7%, and services inflation stayed high at 4.7%, reflecting strong domestic price pressures.
Food prices, higher wages, and rising labor costs are driving inflation. The BoE is particularly cautious when CPI is between 3.5% and 4%, as it risks becoming long-term. Inflation is expected to average 3.4% in 2025, drop to 2.6% in 2026, and hit the 2% target in late 2026.
Services inflation is slow to improve due to factors like annual price setting in April, meaning noticeable changes may not appear until next spring. This delay forces the BoE to take a careful approach to rate cuts, avoiding moves that could reignite inflation before these pressures ease.
Source: Created by Zain Vawda, Google Gemini
Outlook Moving Forward: The Path of Monetary Policy
If we do get a rate cut tomorrow, analysts predict the Bank of England (BoE) will continue with gradual 0.25% cuts every quarter. Markets expect one final cut in November 2025, bringing the rate to 3.75%. Some forecasts, like Danske Bank, predict further cuts into 2026, lowering rates to 2.75%, while others, like the OECD, expect rates to settle at 3.5% by 2026. The BoE has hinted at more cuts if conditions remain stable but hasn’t specified details.
The BoE’s easing contrasts with the US Federal Reserve’s cautious approach, as the Fed held rates steady at 4.25%-4.50% in July due to inflation risks. However, last week's jobs data has significantly changed the outlook for the Federal Reserve moving forward.
The BoE’s rate cuts face risks, including inflation staying above target longer than expected, the impact of past rate hikes as households refinance mortgages, and tighter government budgets.
Global challenges, like US tariffs and geopolitical instability, add further pressure. These factors mean the BoE will likely take a slow and cautious approach to rate cuts, extending into 2026, as the economic outlook remains uncertain.
Technical Analysis - GBP/USD
From a technical standpoint, GBP/USD has arrested its recent slide which coincided with US Dollar weakness.
The selloff which reached a low of 1.3141 last week before recovery still may have further legs.
A rate cut by the BoE has probably been priced in which means the actual rate decision may do little to move GBP/USD tomorrow.
However, if Governor Bailey issues any hawkish remarks, this could help edge GBP/USD lower toward last week lows.
Only a daily candle close above the swing high at 1.3585 will invalidate the bearish setup and may be a sign that momentum is shifting.
Heading into tomorrow, immediate resistance rests at 1.3378 before the 1.3500 handle comes into focus. On the downside, last week's lows at 1.3141 may provide support with a break below opening up a retest of the key pivot level at 1.3000.
GBP/USD Daily Chart, August 6, 2025
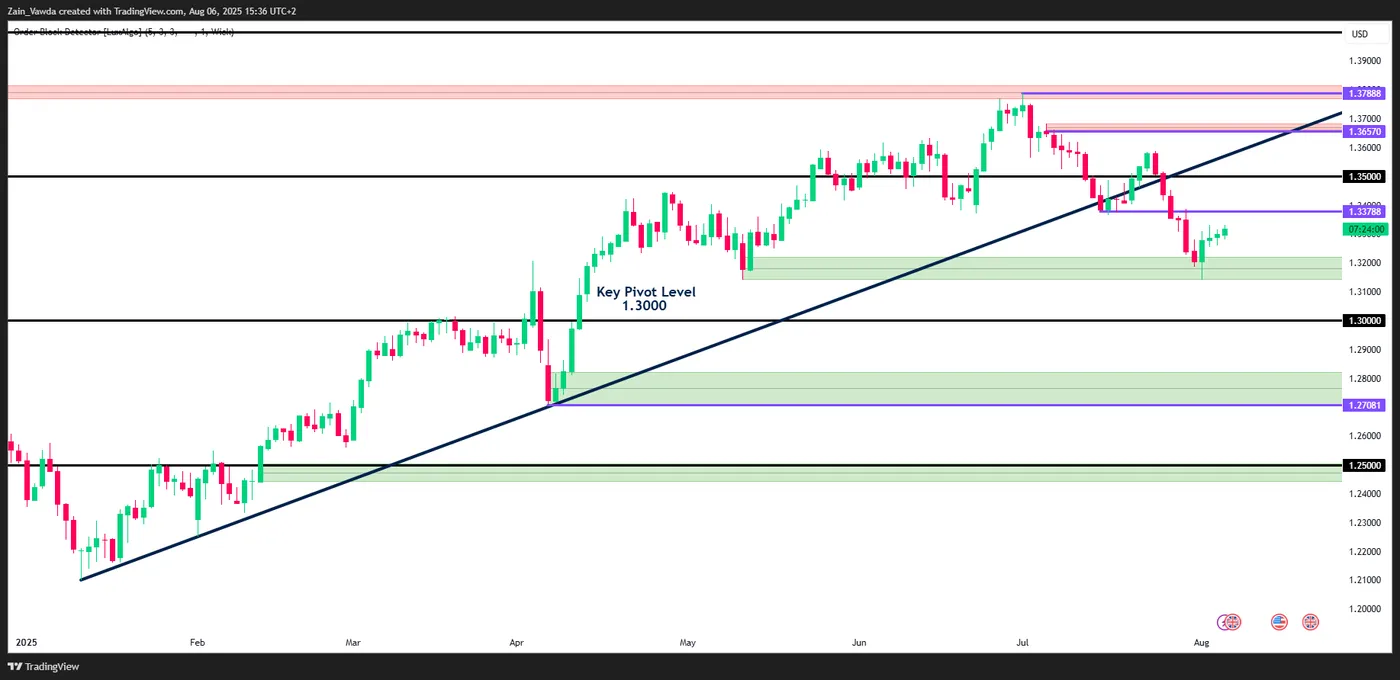
Source: TradingView.com (click to enlarge)
AUDUSD Lifted by Rally in New Zealand Dollar and Positive Data
This week is full of data for the Antipodeans and fro now, a combination of decent to positive Chinese and Australian data are providing boosts to both the New Zealand Dollar and the Australian Dollar.
The Employment rate for NZ came exactly in line and following consecutive beats for Australian and Chinese PMIs, the export-reliant economies are seeing a revamped economic outlook and this is helping commodities like Oil to reverse some of its downward movement.
In the meanwhile, let's take a look at multiple timeframe charts for the Aussie as it leads the Forex board in today's session.
Tonight will see the release of Australian trade balance data at 21:30 ET (expected at 3,250M) and next week (August 12) will see the release of the upcoming Royal Bank of Australia rate decision, with a 99% chance of a cut priced into Markets.
AUDUSD Multi-timeframe Analysis
AUDUSD Daily Chart
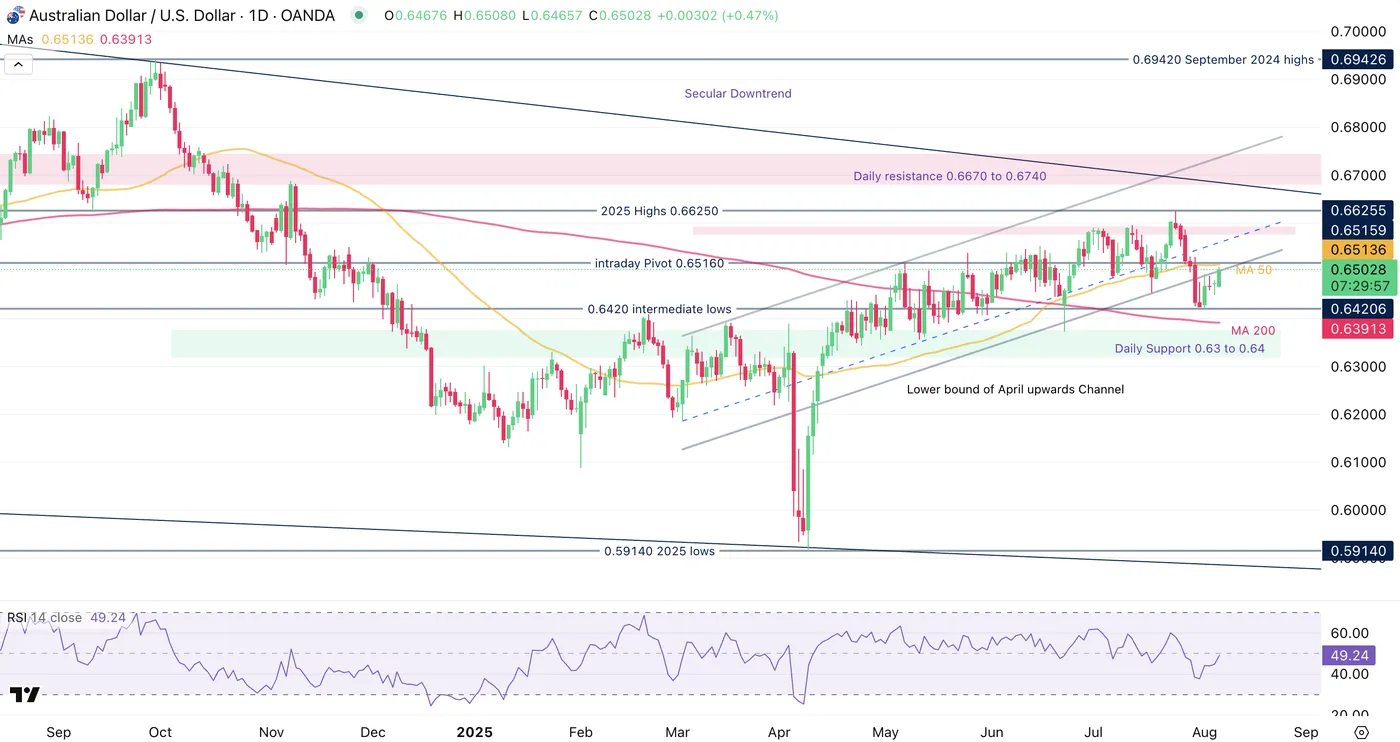
AUDUSD Daily Chart, August 6, 2025 – Source: TradingView
The Aussie is sending mixed signals in Markets between the break of its April ascending channel and the ongoing rally since its lows.
RSI Momentum has came back from bearish territory into neutral levels, pointing to more balanced price action.
The ongoing buying is heading towards the 50-Day MA close to 100 pips above (0.65135) – Testing this one would infer a re-entry into the daily ascending channel and will lead to interesting price action.
Any break retest scenario could still be into play, and to spot higher chances of this happening, it is important to look at if the ongoing USD selloff continues or not.
AUDUSD 8H Chart
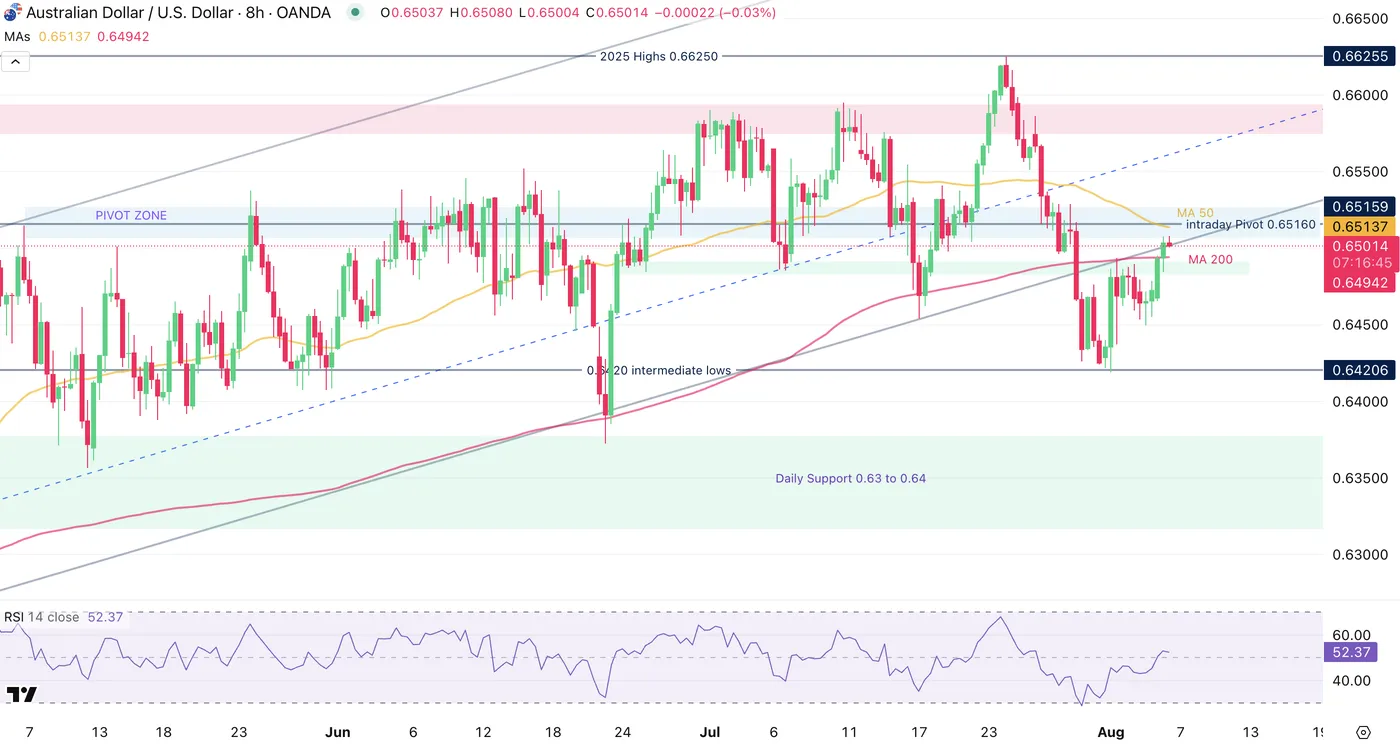
AUDUSD 8H Chart, August 6, 2025 – Source: TradingView
Sellers could be trying to push prices at the lower bound of the upwards broken daily channel, but failure to do so reconfrims the Neutral Bias in the currency pair.
The current action is key for the future outlook – A re-entry within the channel would boost the technical aspect of the AUD.
A failure to re-enter points to more bearish action and failing to break neither the most recent lows (0.6420) or recent swing highs (0.6530) would lead to some consolidation, similar to what we have observed in other currencies like the CHF.
For now, it is essential to watch the reactions between 0.65 (current trading) and 0.65130 to spot if Sellers try to take the hand.
AUDUSD 1H Chart
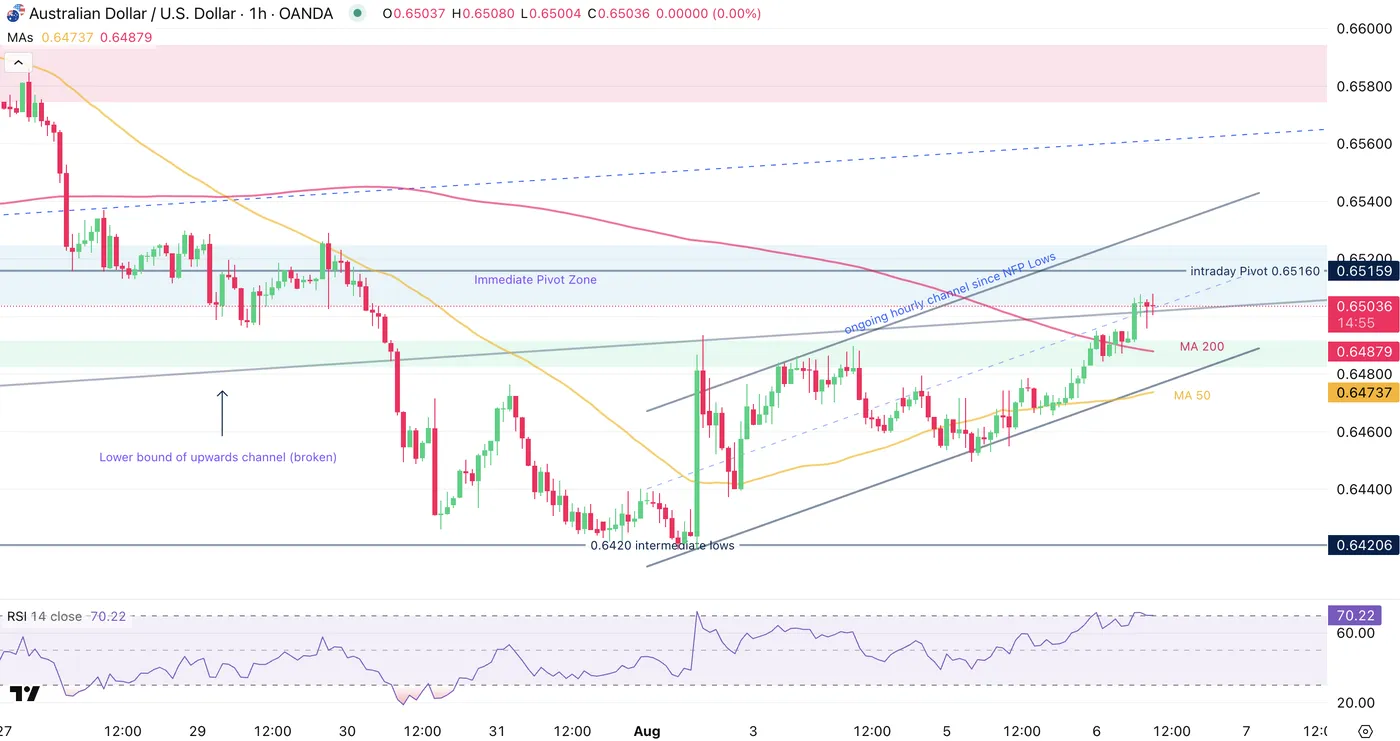
AUDUSD 1H Chart, August 6, 2025 – Source: TradingView
The Aussie has found some relief after the consequential NFP miss (US Jobs data review downwards) and this took up the pair to the ongoing 800 pip rally.
AUD/USD is evolving in an ongoing hourly upwards channel that Buyers will have to hold to counteract the effect of Supply confluence: The 0.65 psychological level, Key Moving averages and the lower bound of the Daily April Channel would be points of entry for sellers.
Failing for sellers to appear would re-confirm the more balanced outlook for the pair.
Levels to place on your charts:
Resistance Levels
- Imminent Pivot Zone 0.65 to 0.6520
- 0.6580 Resistance Zone (+/- 70 pips)
- 2025 highs 0.6625 Resistance Zone
Support Levels
- 0.6470 Confluence of Hourly Channel lows and 1H MA 50
- 0.6420 NFP lows
- Daily Support 0.63 to 0.64
Safe Trades!
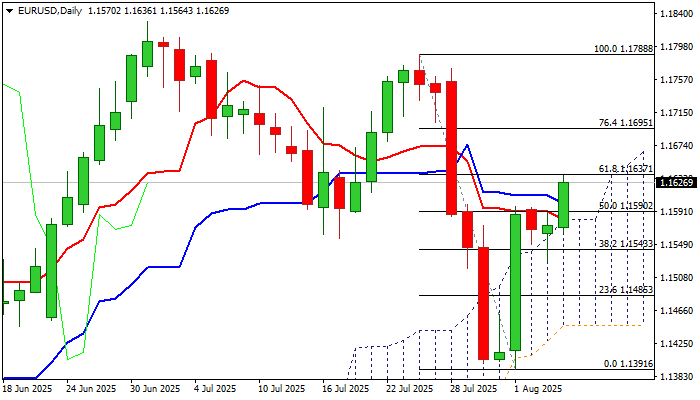
EUR/USD: Bulls Firmly Hold Grip Above Rising Daily Cloud
EUR/USD jumped on Wednesday, extending post-NFP recovery leg which paused in past two days after sharp rally last Friday.
Bulls resumed after consolidation, to hit one-week high and marking almost 61.8% retracement of 1.1788/1.1391 drop, as dollar lost traction on growing signals of more dovish stance from Fed amid unexpected weakness in the US labor sector.
Markets were also nervous about President Trump’s decision about new Chair parson of the US central bank, with dominant negative tone surrounding the US currency.
Daily studies firmed further as 14-momentum broke into positive territory while near-term price action holds above ascending daily Ichimoku cloud top (1.1581) and nearby rising 55DMA (1.1568) which continue to protect the downside for the fourth consecutive day and underpin near-term action.
Fresh acceleration higher needs to register daily close above cracked barriers at 1.1626/37 20DMA / Fibo 61.8%) to further strengthen near-term structure and open way for test of net targets at 1.1695/1.1700 (Fibo 76.4% / psychological).
However, overbought Stochastic warns that bulls may face headwinds, with action required to stay above cloud to keep near term bias with bulls.
Res: 1.1637; 1.1667; 1.1700; 1.1721.
Sup: 1.1610; 1.1581; 1.1568; 1.1527.
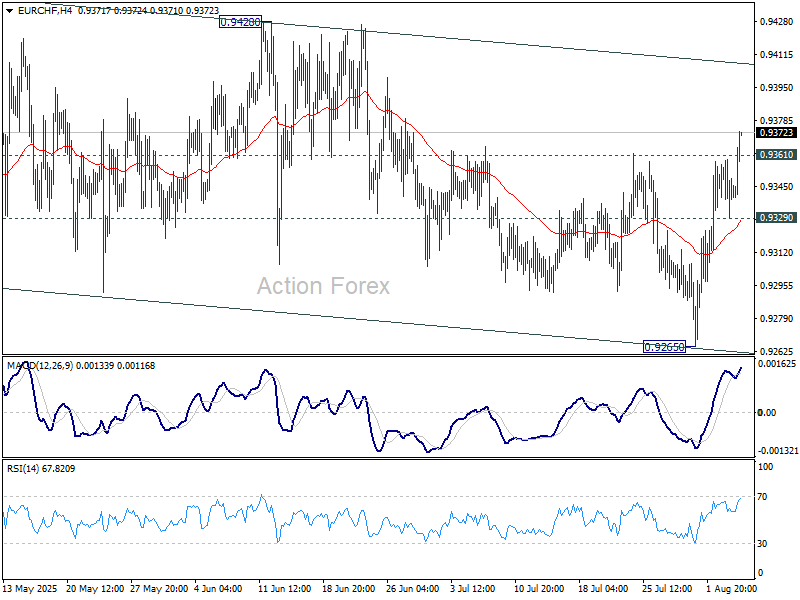
EUR/CHF Mid-Day Outlook
Daily Pivots: (S1) 0.9330; (P) 0.9345; (R1) 0.9361; More....
EUR/CHF's rebound from 0.9265 extends higher today. The break of 0.9361 resistance now suggests that whole corrective pattern from 0.9445 has already completed at 0.9265. Intraday bias is back on the upside for 0.9428 resistance first. Firm break there should resume the rise from 0.9218 low through 0.9445. On the downside, however, break of 0.9329 minor support will mix up the outlook again and turn intraday bias neutral.
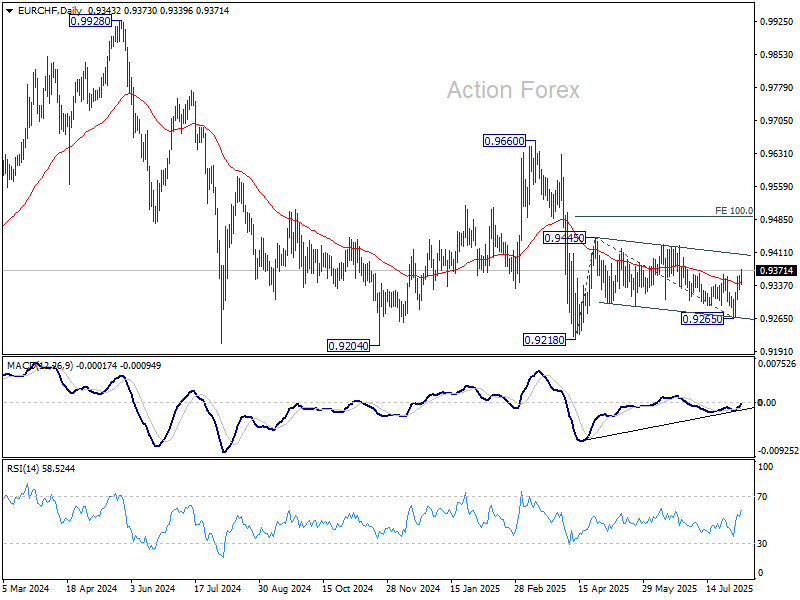
In the bigger picture, the down trend from 0.9204 (2018 high) might still be in progress considering that EUR/CHF is staying well inside the long term falling channel. However, with bullish convergence condition in W MACD, downside position should be limited in case of another fall. Instead, firm break of 0.9660 resistance will be an important sign of medium term bullish trend reversal.
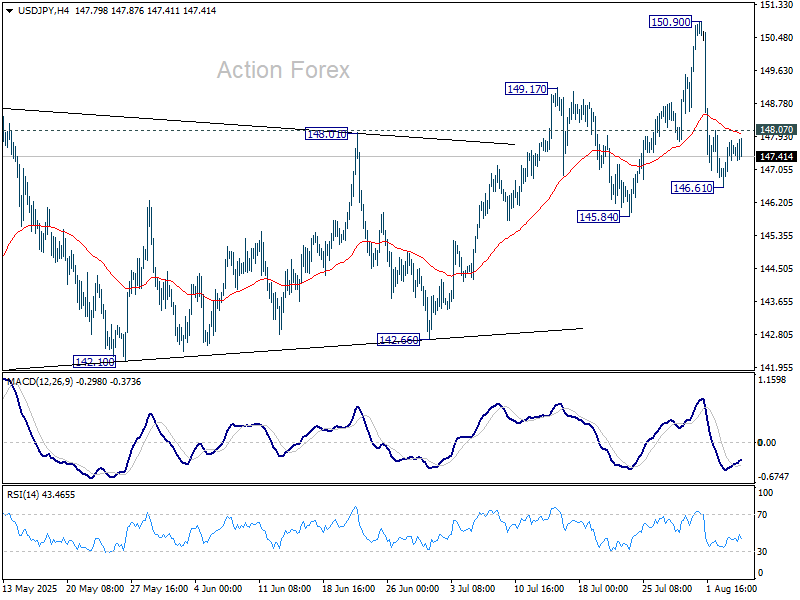
USD/JPY Mid-Day Outlook
Daily Pivots: (S1) 146.84; (P) 147.34; (R1) 148.06; More...
Range trading continues in USD/JPY and intraday bias stays neutral. As long as 145.84 support holds, larger rebound from 139.87 is still in favor to continue. On the upside, above 148.07 minor resistance will bring stronger rebound back to retest 150.90. However, on the downside, firm break of 145.84 support will argue that whole rise from 139.87 might have already completed. Deeper fall should then be seen to 142.66 support for confirmation.
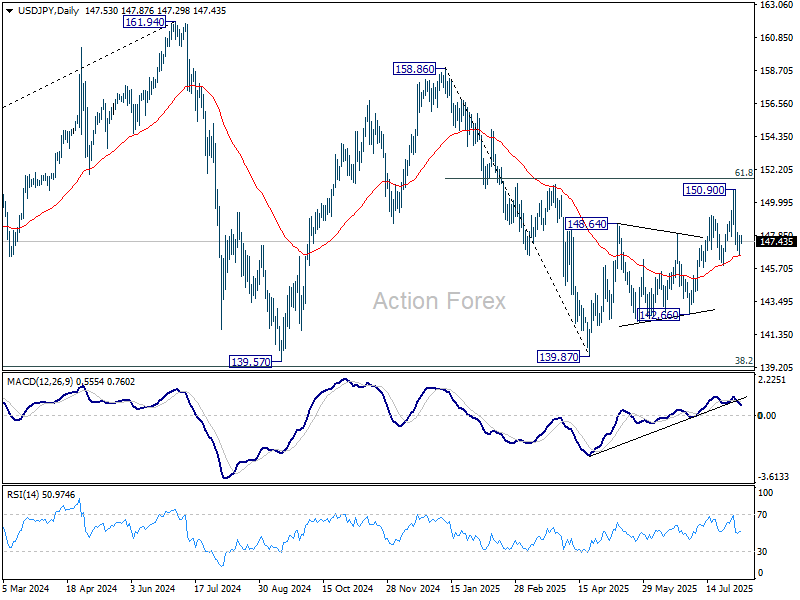
In the bigger picture, price actions from 161.94 (2024 high) are seen as a corrective pattern to rise from 102.58 (2021 low). Decisive break of 61.8% retracement of 158.86 to 139.87 at 151.22 will argue that it has already completed with three waves at 139.87. Larger up trend might then be ready to resume through 161.94 high. In case the corrective pattern extends with another fall, strong support is expected from 38.2% retracement of 102.58 to 161.94 at 139.26 to bring rebound.
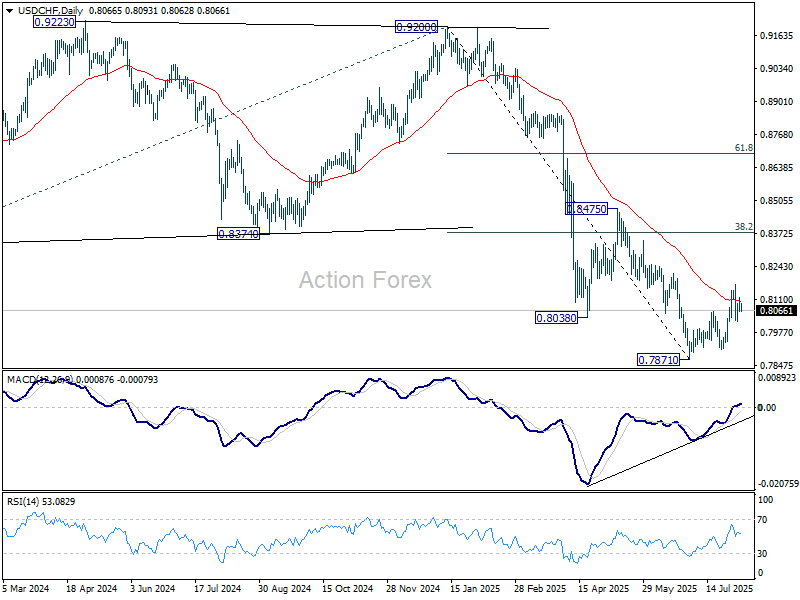
USD/CHF Mid-Day Outlook
Daily Pivots: (S1) 0.8053; (P) 0.8086; (R1) 0.8106; More….
Intraday bias in USD/CHF stays neutral for the moment. On the downside, below 0.8020 will affirm that case that corrective bounce from 0.7871 has completed at 0.8170. Bias will be back on the downside for 07871/7910 support zone. On the upside, though, break of 0.8170 will resume the rise from 0.7871 to 38.2% retracement of 0.9200 to 0.7871 at 0.8379 instead.
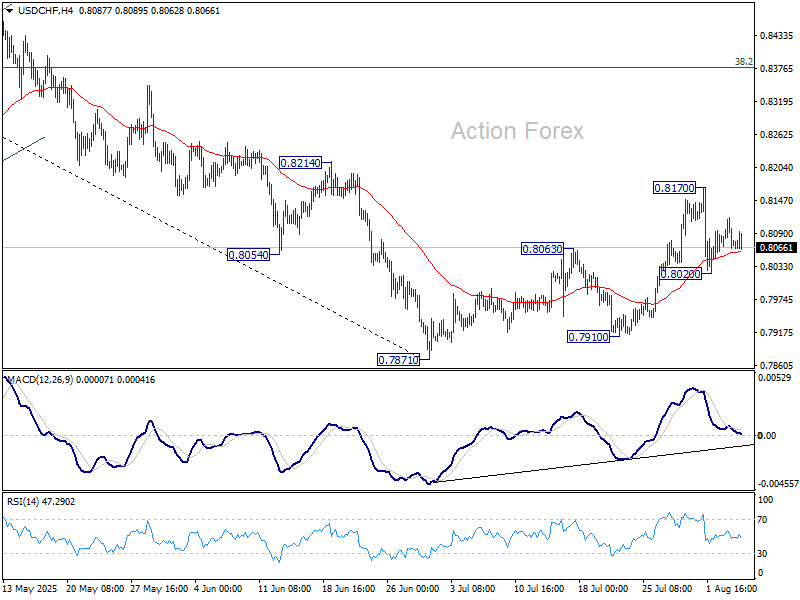
In the bigger picture, long term down trend from 1.0342 (2017 high) is still in progress. Next target is 100% projection of 1.0146 (2022 high) to 0.8332 from 0.9200 at 0.7382. In any case, outlook will stay bearish as long as 0.8475 resistance holds.