Sample Category Title
Bitcoin and Ethereum rally as Trump order unlocks 401(k) access to crypto
Crypto markets firmed after US President Donald Trump signed an executive order aimed at broadening investment options in retirement accounts. The policy change clears a path for cryptocurrencies, private equity, and real estate to be included in 401(k) plans, potentially diverting large-scale institutional capital into the digital asset space.
The USD 12 trillion defined contribution market has largely avoided exposure to alternative assets. Trump’s order seeks to reverse that by reducing litigation exposure and regulatory complexity for fund managers. “My Administration will relieve the regulatory burdens and litigation risk that impede American workers’ retirement accounts from achieving competitive returns,” Trump stated. Industry participants see this as a long-awaited greenlight to diversify away from traditional stocks and bonds.
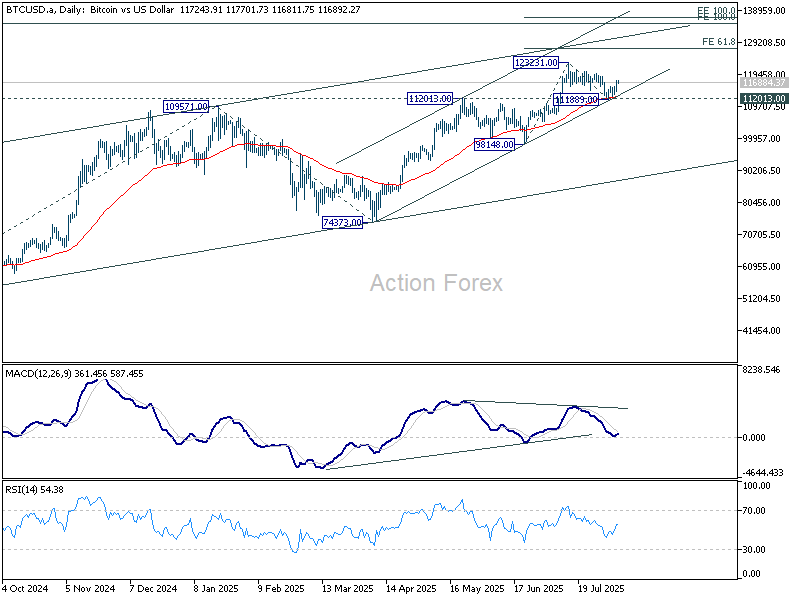
Bitcoin bounces this week but stays well below 123,231 resistance. Near term consolidations could extend. But outlook remains bearish so far with a confluence of support intact, including 112,013 resistance turned support, 55 D EMA, and near term rising channel. Current up trend is expected to resume to 61.8% projection of 98,148 to 123,231 from 111,889 at 127,390 next.
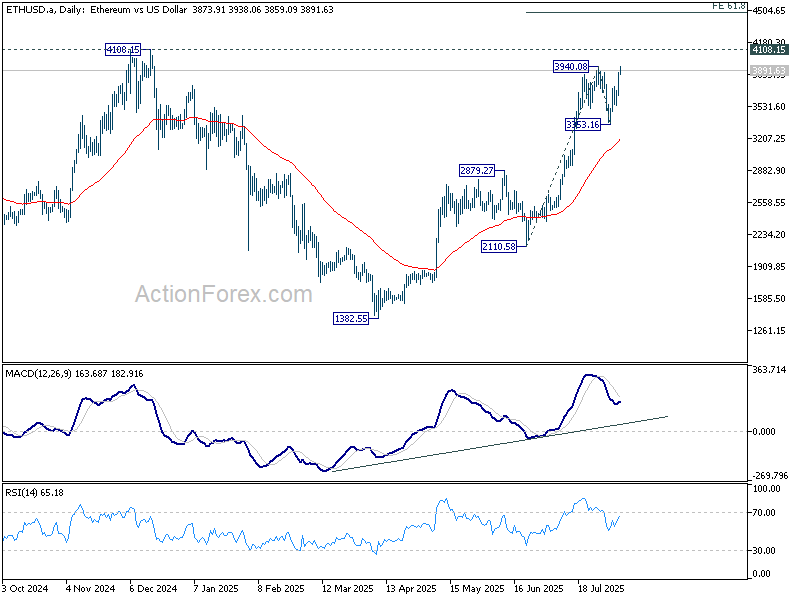
Ethereum's breach of 3,940.08 resistance suggests that recent rally from 1,382.55 is resuming. Next target is 4,108.15 key resistance. Firm break there will target 61.8% projection of 2,110.58 to 3,940.08 from 3,353.16 at 4,483.19 next. In case of retreat, outlook will stay bullish as long as 3,353.16 support holds.
BoJ Opinions: 2–3 months needed to Gauge Tariff impacts, year-end hike possible
BoJ’s July 30–31 Summary of Opinions revealed a broadly cautious stance on future policy moves, with members emphasizing the need for more data before shifting course.
Despite the recent US–Japan tariff agreement, board members reaffirmed that Japan’s baseline outlook has not improved. "Japan's economic growth will moderate and the improvement in underlying CPI inflation will be sluggish temporarily,” one policymaker said. Accordingly, the consensus was to maintain current interest rates and financial accommodation, while monitoring trade risks and external demand.
“At least two to three more months are needed to assess the impact of US tariff policy,” one member stated, noting that the direction of US monetary policy and exchange rates could also shift materially depending on inflation and labor conditions.
Still, the door is now open for rate hikes later this year. The Summary suggests that if incoming data shows resilience in the US economy—and Japan avoids major trade fallout—the BoJ could resume policy normalization as soon as year-end.
“It may be possible for the Bank to exit from its current wait-and-see stance, perhaps as early as the end of this year,” one policymaker said. That prospect keeps the door open to further hikes in late 2025 if inflation and growth align.
Cliff Notes: Fiscal Uncertainty a Concern for Both the Short and Long-Term
Key insights from the week that was.
After a bumper run of data, local markets were provided space for reflection this week. The main release was the household spending indicator which, upon the cessation of the retail sales release last week, is now the sole official indicator of consumer spending. In June, nominal spending growth was on trend, rising 0.5% for a 1.0% quarterly gain. After adjusting for inflation, real spending increased 0.7% in Q2 following an upwardly revised 0.5% lift in Q1.
Our Westpac-DataX Consumer Panel corroborates this signal of firming momentum, indicating real spending grew by a solid 1.5% in Q2 after a 0.6% increase in Q1 – driven by discretionary categories across all demographics. Spending growth was not as strong for older Australians (65+), however, perhaps reflective of the recent financial market volatility and high cost of living. The Panel’s detailed insights behind household income and saving flows suggest the latest lift in spending did not come at the expense of a reduction in the savings rate, also reporting a solid quarter for average net incomes (+2.9%) and, to a lesser extent, a pick-up in personal credit usage during EOFYS – as evinced by official credit data last week.
Overall, our Panel suggests the consumer recovery is on a relatively firm footing heading into mid-year – a welcome signal in line with our expectations. This follows what has been a fairly gradual recovery in consumer spending to date, which is understandable given the depth and length of the contraction in real per capita incomes. Abating cost-of-living pressures are a crucial factor underlying the current recovery; thankfully, inflation is expected to remain within the target band, justifying 100bps of rate cuts beginning at next week’s August RBA meeting through May 2026 to a neutral terminal cash rate of 2.85%.
On the medium-term view, ahead of the Government’s upcoming Productivity Roundtable, Chief Economist Luci Ellis’ essay this week focuses on tax policy, productivity and the eventual aim, improving living standards.
Before moving offshore, it is also worth highlighting that Australia’s goods trade data continues to exhibit extreme volatility as global trade networks attempt to adjust to the Trump trade policy era – see below for the latest developments. While the surplus bounced up to $5.4bn in June from a downwardly revised $1.6bn in May, we expect the broader multi-year trend of a narrowing surplus to remain in place into the medium-term, as commodity prices step back from recent highs and the Aussie dollar strengthens.
Turning to the US, last Friday’s weak employment report remained participants focus all week, the reduction in the 3-month average pace of nonfarm payroll growth from 150k to 35k seen as a break in the labour market trend and evidence of building downside risks. Notably, household survey employment has been weaker still, declining 132k per month since January; had it not been for a 0.4ppt decline in participation over the period, the unemployment rate would now be around 4.6% as opposed to the 4.2% reported by the BLS for July.
Given this shift, it is unsurprising that the market is now pricing in 60bps of FOMC rate cuts by end-2025 and a cumulative 130bps by end-2026. In our view though, this ignores the inflation persistence and risks that have held back the FOMC in recent months and which we expect to endure. Against the market’s 130bps of easing to end-2026, we instead expect just 50bps of cuts (by end-2025), with the impact on the long end of the US yield curve more than offset by rising fiscal uncertainty.
Adding to that uncertainty this week, President Trump imposed another 25% tariff on India in response to their purchases of Russian energy, but did not act against China even though the latter nation is also a major customer of Russian energy companies. A 100% industry tariff was also mooted for semiconductors produced by firms not investing in the US, albeit without detail on the terms, scale or timing of the expected investment. President Trump has previously signalled a similar approach for pharmaceutical production and imports, again without providing any detail. In such a climate, it is difficult for US businesses to justify a material expansion of capacity outside very specific sub-industries such semiconductors and AI infrastructure. Providing another point to ponder, just announced this morning is that Stephen Miran, currently Chair of the Council of Economic Advisors, has been appointed to the Federal Reserve Board Governor position vacated by Adriana Kugler, but only until January 31 2026.
Meanwhile in the UK, the Bank of England’s Monetary Policy Committee (MPC) cut its Bank Rate by 25bp to 4.0%, a level last seen in March 2023. While the eventual outcome aligned with both our and the market’s expectations, for the first time ever, the MPC was required to vote a second time after a three-way split in the first vote, four members voting to leave policy unchanged, four for a 25bp cut and one for a 50bp cut. In the second vote, the five members wanting to ease policy this month coalesced on a 25bp cut, creating a majority.
The minutes of the meeting revealed that those favouring a cut were most concerned by disinflationary pressure from emerging slack in the labour market, evinced by the moderation in underlying wage growth. The four members in the minority, however, emphasised that, following a recent increase in headline inflation, “the disinflationary process had slowed and the risk of inflation expectations feeding through to second-round effects had risen.” The updated BoE projection for the CPI illustrated the view of the latter group well: headline inflation is now expected to peak at 4.0%yr in September, 0.3ppts higher than the BoE expected three months ago; and then return to the 2% target one quarter later. The BoE’s projection for GDP growth was little changed, and is consistent with a gradual recovery.
In the press conference, Governor Bailey admitted that, while the policy rate remains on a downward trajectory, the monetary policy path has become more uncertain, with the Committee attempting to balance upside inflation risks against concerns over economic activity and the labour market. Against this backdrop, the committee maintained its forward guidance of “a gradual and careful approach to the further withdrawal of monetary policy restraint.” While we expect the MPC to proceed very carefully, we believe a 25bp cut per quarter is likely to be maintained in Q4 2025 and Q1 2026, leaving Bank Rate at a neutral 3.50% by Q2 2026.
Bitcoin (BTC/USD) Eyes Bull Flag Breakout as Trump Allows Bitcoin and Crypto in 401(k)s
Bitcoin has recovered from a recent pullback thanks in part to improving market sentiment, a weaker US Dollar and recent crypto developments in the US.
Bitcoin has rallied some 4.5% from the recent lows around the 112k mark on August 2. This low came in a day after market expectations regarding Federal Reserve rate cuts saw a significant shift in tone and the US Dollar rally fizzled.
Another positive development for both Bitcoin and Crypto markets came earlier today as President Donald Trump signed an executive order that aims to allow 401(k) investors access to alternative assets (such as digital assets).
Trump Signs Executive Order to Allow Bitcoin and Crypto in 401(k)s
During the US session, the president of the United States, Donald Trump, signed an Executive Order that aims to allow 401(k) investors access to alternative assets (such as digital assets).
According to the official announcement:
“The order directs the Secretary of Labor to reexamine the Department of Labor’s guidance on a fiduciary’s duties regarding alternative asset investments in ERISA-governed 401(k) and other defined-contribution plans.”
This comes as part of Trump’s plans to establish the country as the leading player in the cryptocurrency industry. To this point, the order also stipulates that “alternative assets, such as private equity, real estate, and digital assets, offer competitive returns and diversification benefits.”
The move saw cryptocurrencies as a whole benefit, Bitcoin's price is now over $117,000, up 2% today. Ethereum (ETH), a hot topic among altcoins recently, has risen by 5%.
The move could see greater institutional flows as market participants who have not had crypto investments in the past could look to include a portion in their 401k.
ETF Flows Reflect Changing Market Dynamics
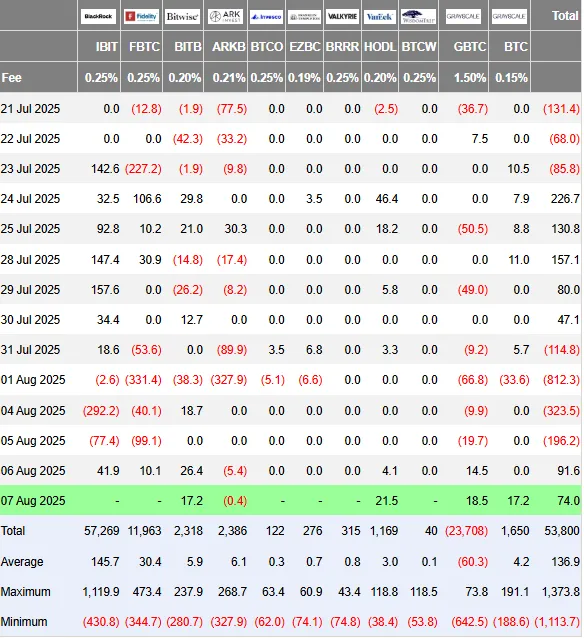
Looking at ETF flows over the past week and they do reflect in part the changes to market conditions. ETF flows had enjoyed 5 consecutive days of inflows ahead of the Fed meeting.
This came to an end as Fed Chair Jerome Powell adopted rather hawkish rhetoric in his post FOMC meeting comments. This saw inflows stop with 4 consecutive days of outflows as markets eyed the possibility of higher rates fro longer.
Fridays Jobs data however through a spanner in the works. Outflows did not cease immediately despite the weak jobs data and continued at the start of this week but have since stalled.
The last two days have seen modest inflows of around 91.5 and 74 million US Dollars. A sign that the tide is turning?
Source: Farside Investors
Technical Analysis - BTC/USD
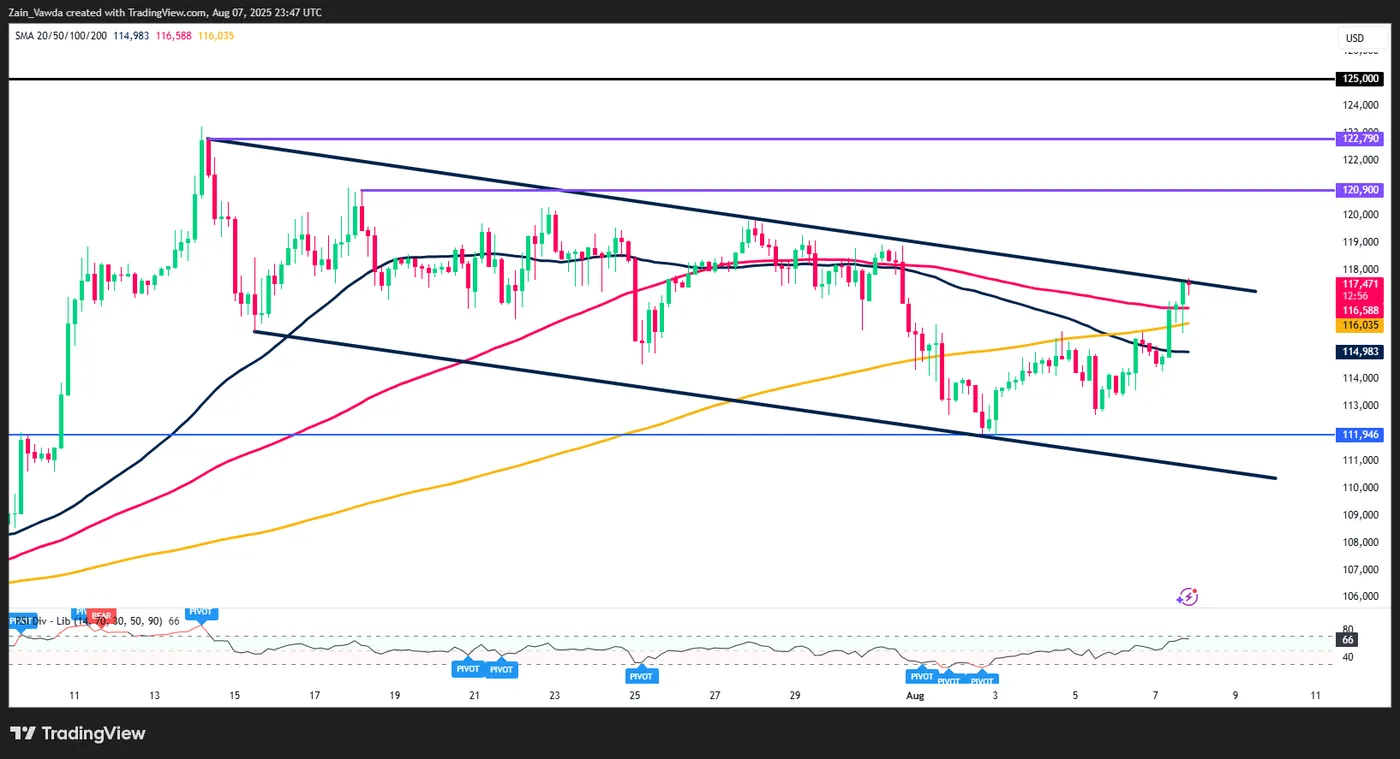
From a technical standpoint, Bitcoin has had a retest of breakout support level around the 112k handle and has since rallied higher.
Looking at the H4 chart below we can see that bitcoin has been in a bull flag pattern since printing fresh all-time highs July 14 2025.
The rally higher has now reached the top end of the bull flag pattern having broken back above the 50, 100 and 200-day MAs. Surprisingly on Tuesday August 5 we had a death cross pattern which Bitcoin seemed to ignore and continued its rally to the upside. A sign of bullish momentum?
As things stand Bitcoin is eyeing a potential break of the bull flag pattern which could lead to a rally to around the 125k handle.
Looking at price action, the fact that we have just printed a higher high means a pullback toward the swing low at 114555 before continuing higher and breaking out of the bull flag pattern.
A four-hour candle close below the 114555 handle would invalidate this setup and could lead to a retest of the lower end of the bull flag pattern.
Immediate resistance rests at the 120000 mark before the 120900 and all-time high at 123236.
Support may be located at 114555, 112916 and 112000.
Bitcoin (BTC/USD) Daily Chart, August 8, 2025
Source: TradingView.com (click to enlarge)
GBPUSD Wave Analysis
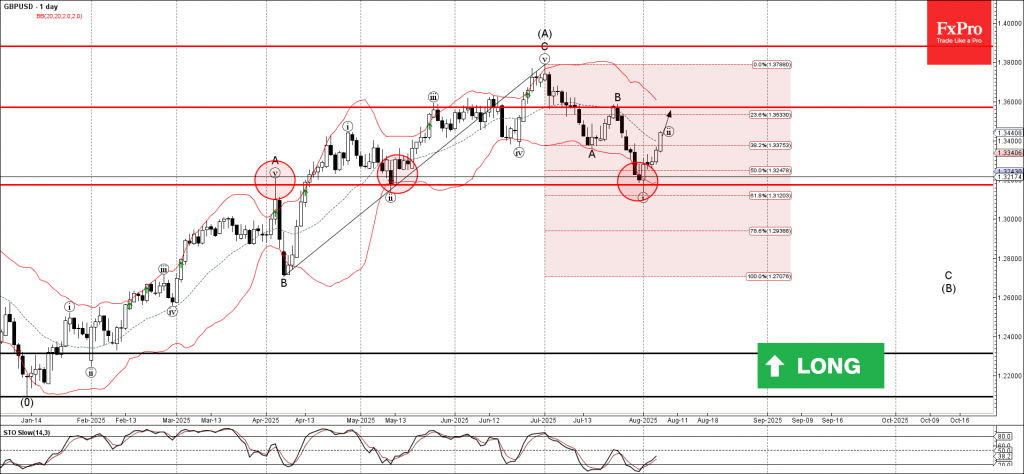
GBPUSD: ⬆️ Buy
- GBPUSD reversed from the support area
- Likely to rise to resistance level 1.3600
GBPUSD currency pair recently reversed from the support area between the strong support level of 1.3175 (former resistance from April) and the lower daily Bollinger Band.
This support area was further strengthened by the 61.8% Fibonacci correction of the upward impulse from April.
Given the clear daily uptrend, GBPUSD currency pair can be expected to rise to the next resistance level 1.3600 (which stopped wave B in July).
NZDUSD Wave Analysis
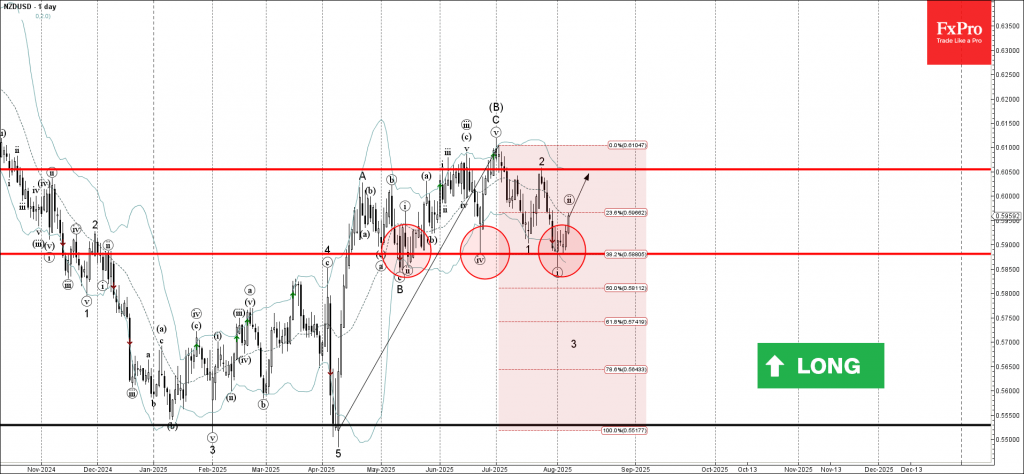
NZDUSD: ⬆️ Buy
- NZDUSD reversed from the support area
- Likely to test resistance level 0.6050
NZDUSD currency pair recently reversed from the support area between the strong support level of 0.5880 (which has been reversing the price from May) and the lower daily Bollinger Band.
The upward reversal from this support area created a clear daily Japanese candlestick reversal pattern, the Hammer, which initiated active correction ii.
Given the strongly bearish US dollar sentiment seen today, NZDUSD currency pair can be expected to rise to the next resistance level 0.6050 (top of wave 2 from July).
Bank of England Review – A 25bp Cut With a Hawkish Twist
- The Bank of England cut the Bank Rate by 25bp to 4.00% as widely expected.
- The vote split was more hawkish than expected, with four members voting for an unchanged decision.
- The guidance included a hawkish twist and forecasts for inflation were revised significantly higher.
- The market reacted by trading Gilt yields a bit higher and sending EUR/GBP below the 0.87 mark.
The Bank of England (BoE) cut the Bank Rate to 4.00% as widely expected. The vote split delivered a hawkish surprise, with five members voting for a cut and four members voting for an unchanged decision. Alan Taylor favoured a larger 50bp cut but joined the 25bp camp to secure a majority for a cut. Thus, the balance of the MPC was indeed skewed towards cutting the Bank Rate.
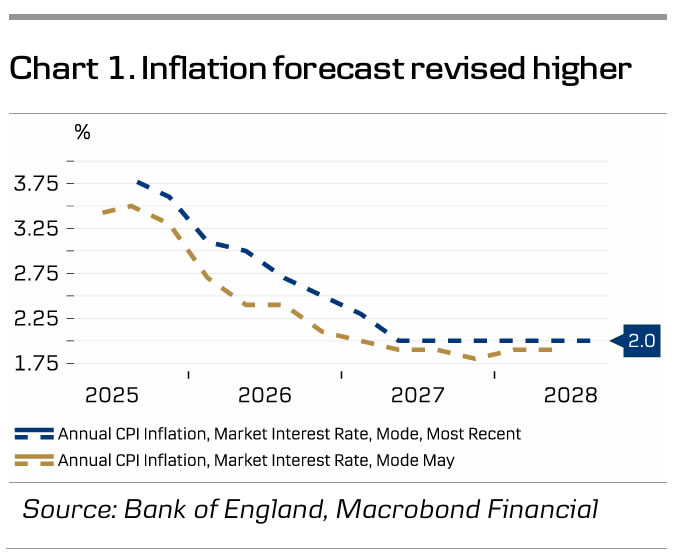
The overall guidance was unchanged, as the BoE noted that "a gradual and careful approach to the further withdrawal of monetary policy restraint remains appropriate". However, a hawkish twist was added to the wording, as they also note that the monetary policy stance has become less restrictive and future cuts will depend on the perspectives for further disinflation. To us, this indicates that the cutting cycle is nearing its end. Additionally, the MPC revised its inflation forecast significantly higher in the new monetary policy report (MPR). with Q4 inflation forecasts now at 3.8, 2.7 and 2% for years 2025, 2026 and 2027 vs. 3.5, 2.4 and 1.9% back in May (see chart 1). GDP forecasts were largely unchanged at very modest growth rates.
BoE call. We continue to expect the BoE to deliver the next cut in the Bank Rate in November, followed by quarterly rate cuts next year leaving the Bank Rate at 2.75% by end-2026. After today's somewhat hawkish surprise, we think the risk is that the cutting cycle will come to an end earlier than previously thought, which is also what markets price. That said, recent increasingly negative employment growth and lower wage growth suggest further cuts will be necessary.
Market reaction. Gilt yields traded a couple of basis points higher and EUR/GBP dropped below the 0.87 mark on the hawkish twist, particularly in the short-end as markets now price 20bp for the remainder of the year against 25bp ahead of the meeting. We expect EUR/GBP to move higher towards 0.89 on a 6-12-month horizon on a weakening of the UK growth outlook and a positive correlation to a USD negative environment.
US Dollar Tries to Find Stable Ground
Since last Friday's Non-Farm Payrolls number, the Greenback has been getting obliterated, retreating from the 100.00 landmark in the DXY to touching high 97.00 levels.
Markets are quickly moving towards a heavy pricing of FED cuts which is hurting the Dollar and supporting strongly Equities in their ongoing rebound.
It will be essential to see how US indices open today but the trading has been green for other global indices, particularly the DAX up 1.70% on the session, and the Nasdaq (CFD and Futures) is about 200 points from its all-time highs.
In the meantime, the US Dollar follows through with another beginning of NA session where it lags other majors and even bringing back USDCAD back into its past months' range, despite an also underperforming Loonie (which you can check out right here)
To continue yesterday's Mid-Week analysis, we'll review the Dollar Index in detail and a few pairs.
Will the USD downfall continue?
Dollar Index Multi-Timeframe Analysis
Dollar Index Daily Chart
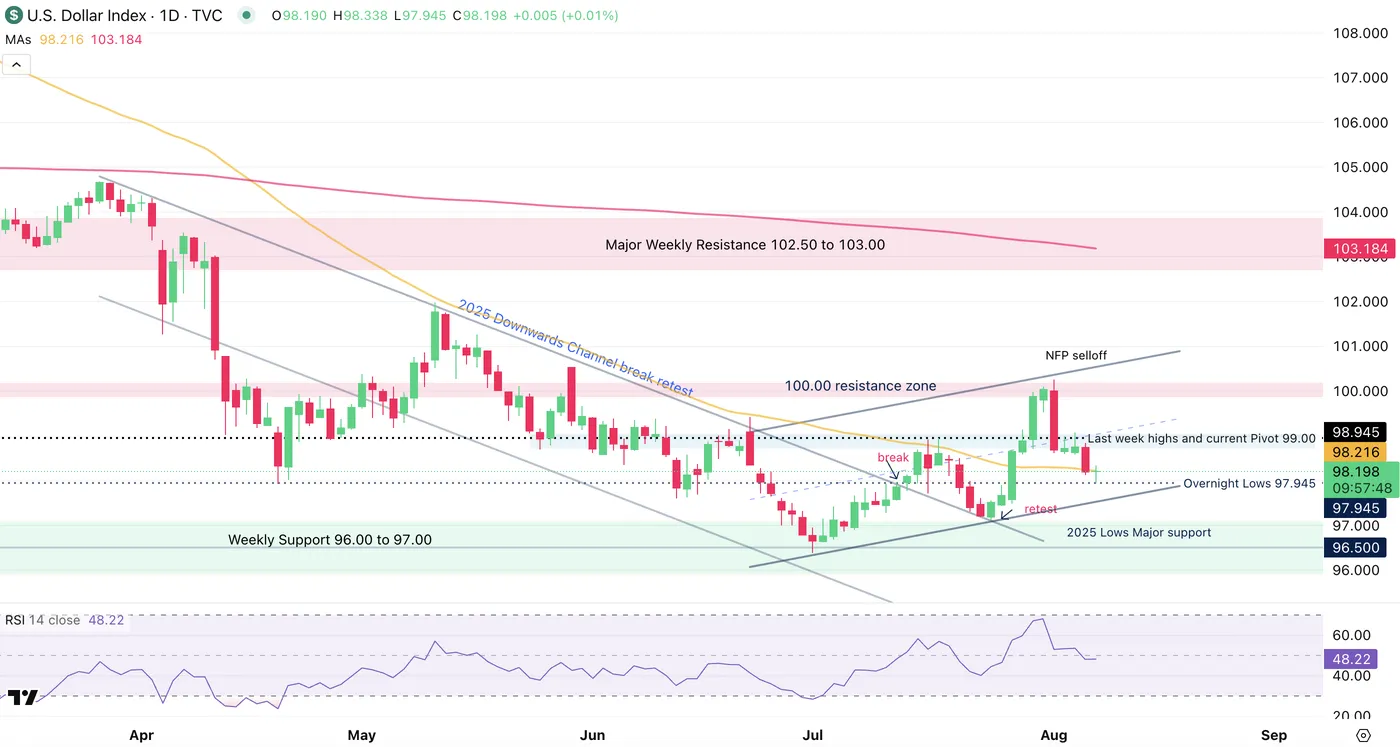
US Dollar Index Daily Chart, August 7, 2025 – Source: TradingView
The outlook for the US Dollar is neither bullish or bearish looking at the daily chart.
The swift End-July rebound could have brought the greenback towards a more tenace Bull outlook but the strong NFP retracement corrected that thesis.
This is another proof of how stong psychological levels (100.00 Level resistance) can be – despite them overshooting slightly on some occasions – and how influential data like Non-Farm Payrolls can be.
The Daily RSI flattening at the middle line indicates higher probability of rangebound action for Major FX pairs as Markets await for more key data.
The Dollar is trading right at its 50-Day MA so watch where Markets take the index from here.
Dollar Index 4H Chart
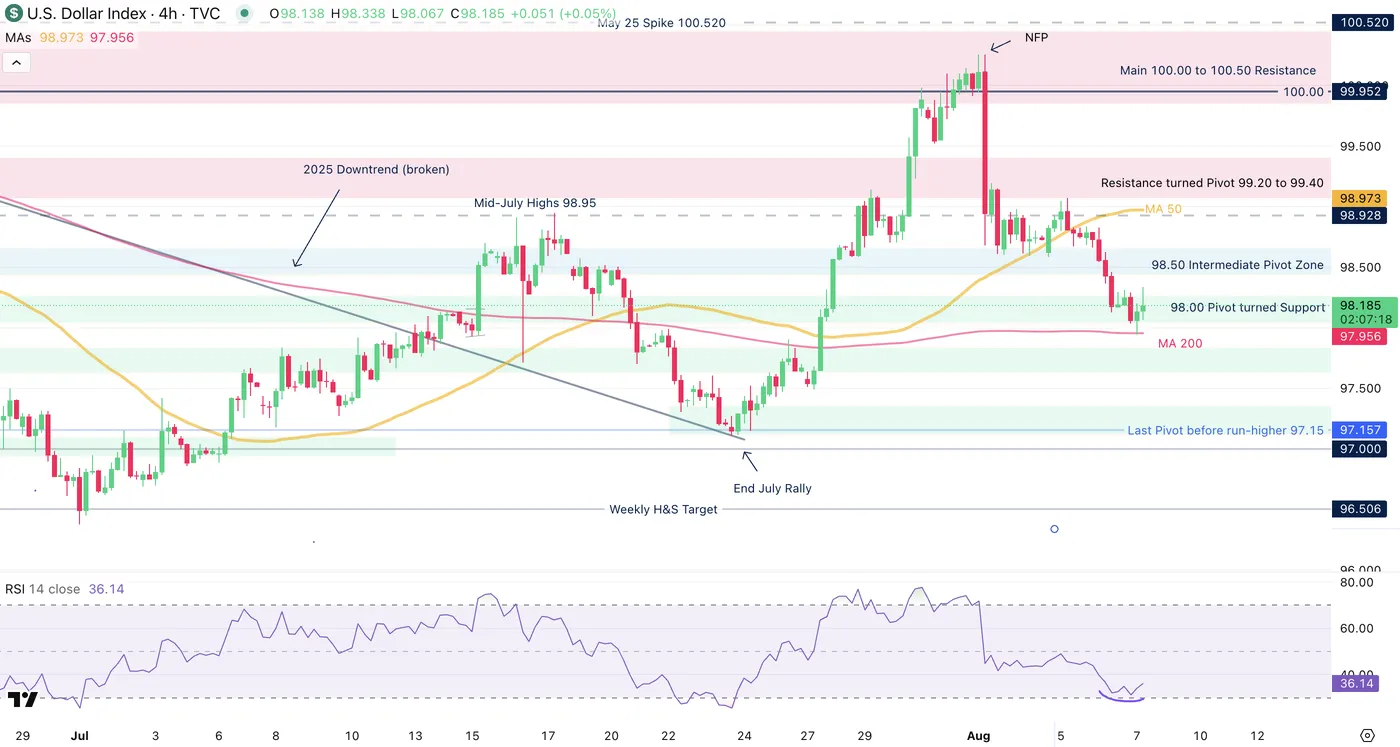
US Dollar Index 4H Chart, August 7, 2025 – Source: TradingView
Looking closer, we see that the overnight selloff in the Dollar has found support at just below the 98.00 handle, just below its support zone (overnight lows: 97.45).
The swift retreat downwards found supporting buyers at the 4H MA 200 which will be a key mark to follow for upcoming trading.
After this morning's Bank of England Cut, markets may be realizing that the US Main rates are still high (currently 4.50%) which could lead to some consolidation in the Index int he waiting of further data.
Levels to watch for the Index:
Support Levels:
- 98.00 Pivot turned Support
- 4H MA 200 97.60
- Last Main low Pivot 97.15
Resistance Levels:
- 98.50 Intermediate Pivot Zone
- Resistance turned Pivot 99.20 to 99.40
- 100.00 to 101.00 Main Resistance
Dollar Index intraday – 30m Chart
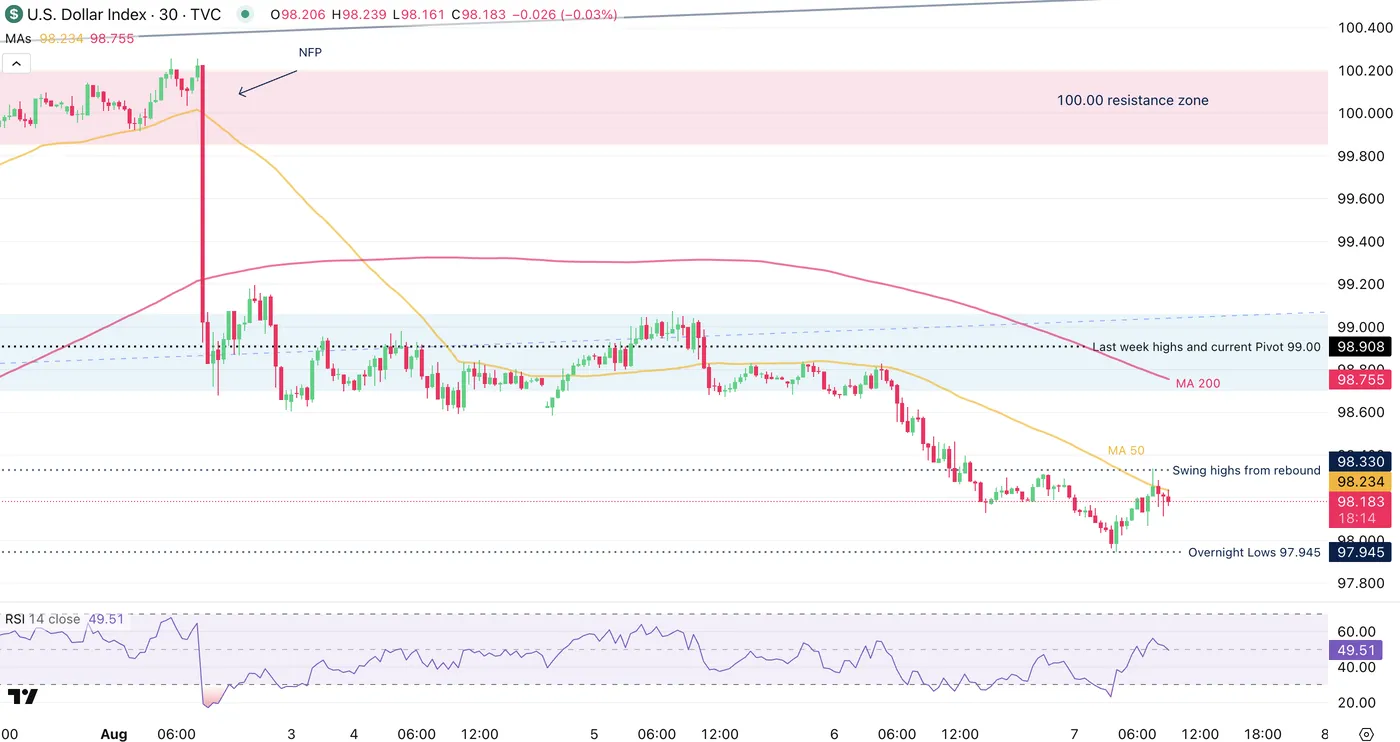
US Dollar Index 30m Chart, August 7, 2025 – Source: TradingView
For immediate Bull/Bear strength analysis, watch the overnight lows (97.95) and the current swing highs (98.30) – If markets close above on strong candles, expect continuation.
If the DXY gets choppy from here, look at individual pairs which may offer decent rangebound setups.
Safe Trades!
GBP/USD Mid-Day Outlook
Daily Pivots: (S1) 1.3303; (P) 1.3336; (R1) 1.3389; More...
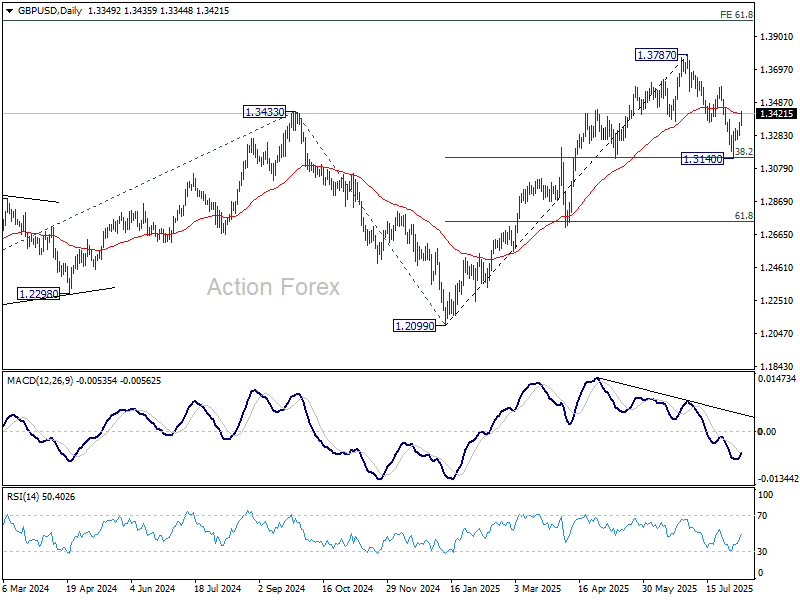
GBP/USD's rebound from 1.3140 continues today and intraday bias stays on the upside. As noted before, correction from 1.3787 should have completed with three waves down to 1.3140. Further rise should be seen to 1.3587 resistance. Firm break there will target 1.3787 high. On the downside, below 1.3330 minor support will turn intraday bias neutral again first.
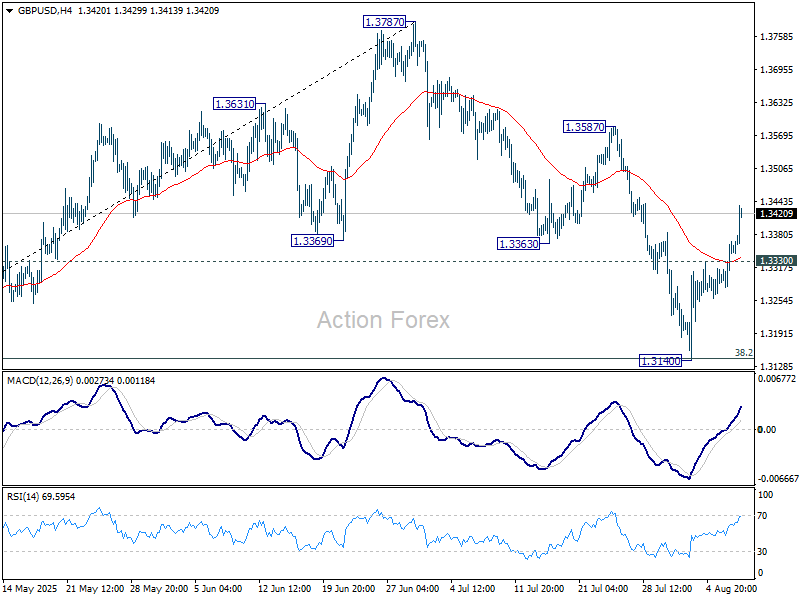
In the bigger picture, up trend from 1.3051 (2022 low) is in progress. Next medium term target is 61.8% projection of 1.0351 to 1.3433 from 1.2099 at 1.4004. Outlook will now stay bullish as long as 55 W EMA (now at 1.3049) holds, even in case of deep pullback.