
Sample Category Title
EUR/CHF Daily Outlook
EUR/CHF was rejected at 0.9167 resistance and reversed from there. But downside is contained above 0.9094 temporary low. Intraday bias remains neutral and further fall is in favor. On the downside, firm break of 0.9094 will extend the fall from 0.9264 to retest 0.8979 low. Nevertheless, decisive break of 0.9167 fall from 0.9264 has completed as a corrective move.
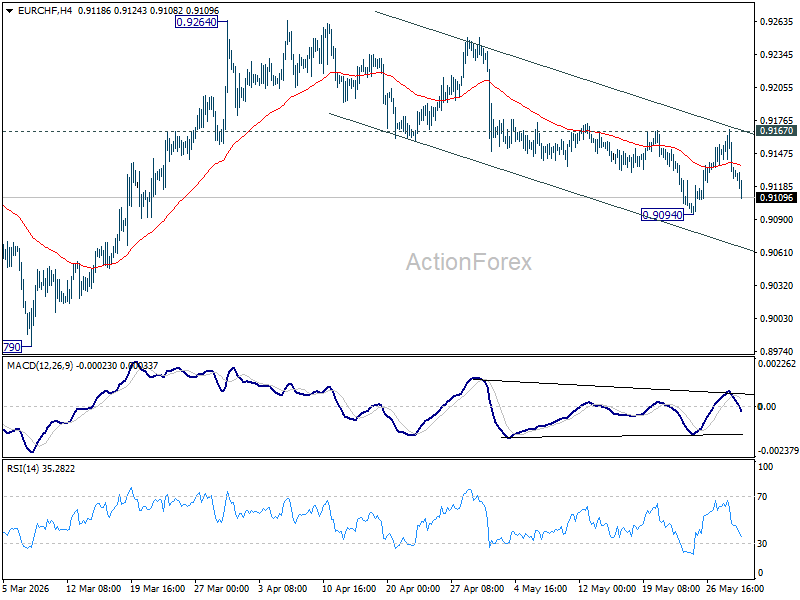
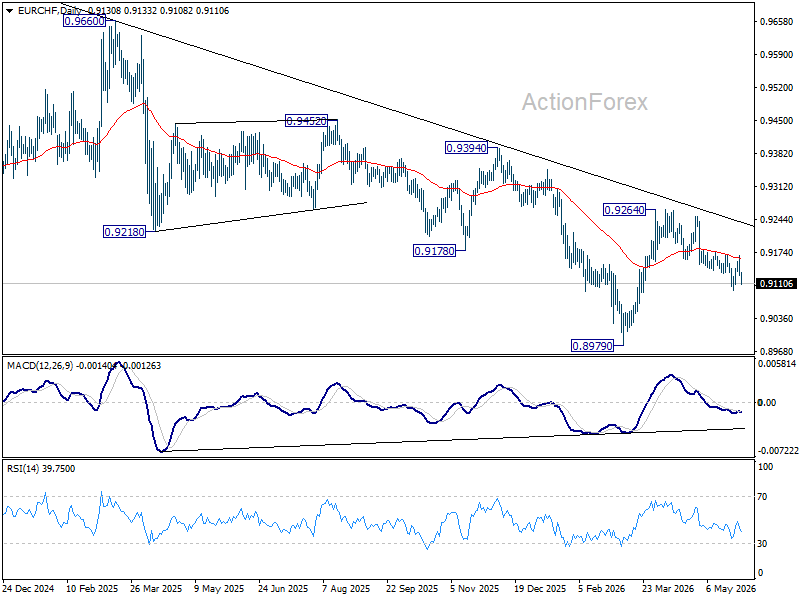
In the bigger picture, the rejection by 55 W EMA (now at 0.9252) suggests that the down trend from 0.9928 (2024 high) is still in progress. Firm break of 0.8979 will confirm down trend resumption. Outlook will stay bearish as long as 0.9394 resistance holds, in case of another rebound.
Fed’s Schmid Warns Against Assuming Energy Shock Will Fade Quickly
Federal Reserve Bank of Kansas City President Jeffrey Schmid delivered a hawkish warning on inflation, arguing that policymakers should not assume the latest energy-driven price surge will quickly disappear. Speaking at a conference in Iceland, Schmid said inflation remains his "primary concern," stressing that it is "too hot and has been above target for too long." While many forecasts assume inflation pressures will ease later this year as energy markets stabilize, Schmid appeared skeptical that the current shock can simply be dismissed as temporary.
The strongest message came from his rejection of the transitory inflation narrative. Schmid said he places "little stock in assuming that the most recent runup in prices is transitory within an acceptable time horizon," adding that his focus remains firmly on inflation when considering the appropriate policy path. He also warned that "now is not the time to let down our guard," highlighting concerns that inflation expectations could become more entrenched after years of above-target price growth. While Schmid stopped short of explicitly endorsing further rate hikes, his remarks suggest a growing reluctance within parts of the Fed to look through the inflationary effects of the Middle East energy shock.
Schmid also noted that the economy remains resilient enough for the Fed to maintain its focus on inflation. He said "most economic indicators suggest continued steady growth" and that the labor market remains "in balance." Additionally, discussions with energy firms in his district revealed a "high degree of caution," with producers reluctant to significantly increase output despite higher prices. That hesitation could limit the speed at which oil markets rebalance, reinforcing Schmid's concern that the energy shock may prove more persistent than many investors currently expect.
Bailey Pushes Back Against Rate Hike Expectations as BoE Waits for More Evidence
Bank of England Governor Andrew Bailey delivered a clear message to markets on Friday: rising inflation does not automatically mean higher interest rates. While acknowledging that the energy shock from the Middle East conflict is likely to push inflation above target, Bailey indicated that there is no urgency for the BoE to respond with immediate rate hikes. Instead, policymakers are choosing to monitor how the conflict affects the economy and inflation before making further policy adjustments.
Bailey argued that the current situation differs from a broad-based inflation problem because much of the pressure stems from higher energy prices. He said allowing inflation to remain above target is justified given uncertainty over the economic impact of the Iran war and weak growth conditions. At the same time, he emphasized that policy remains data dependent, noting that the BoE will "monitor the situation in the Middle East and how it affects the UK economy and inflation very closely and adjust policy as required." His remarks suggest policymakers see little benefit in rushing to tighten while the outlook remains highly uncertain.
Perhaps most importantly, Bailey welcomed the market's decision to reduce expectations for future rate hikes. Investors are now pricing only one quarter-point increase by the end of 2026, a sharp shift from the more aggressive tightening expectations seen earlier this year. Bailey's response — "I hope it goes on" — was a strong signal that the BoE is comfortable with a less hawkish market outlook. While he warned that "second-round effects" would eventually require a response if they emerge, the immediate message was that the Bank remains patient.
Chart Alert: WTI Crude Is Entrenched in a Minor Downtrend Below 20-Day and 50-Day Moving Averages
Key takeaways
- WTI crude oil is on track for its worst monthly performance since April 2025, down 16% in May as easing US-Iran tensions reduce geopolitical risk premium.
- Technical signals remain bearish, as WTI trades below its 20-day and 50-day moving averages within a descending channel.
- Further downside risks remain in play toward the US$87.60 and US$81.94/85 support zones unless WTI breaks above the key US$95.10 resistance.
The former red-hot West Texas crude oil is looking to end the month of May 2026 on a bearish footing, an intra-session monthly decline of 16% (at this time of writing), its first negative month after four months of consecutive gains, and on the verge of recording its worst monthly performance since April 2025.
WTI Crude from Outperformer to Underperformer
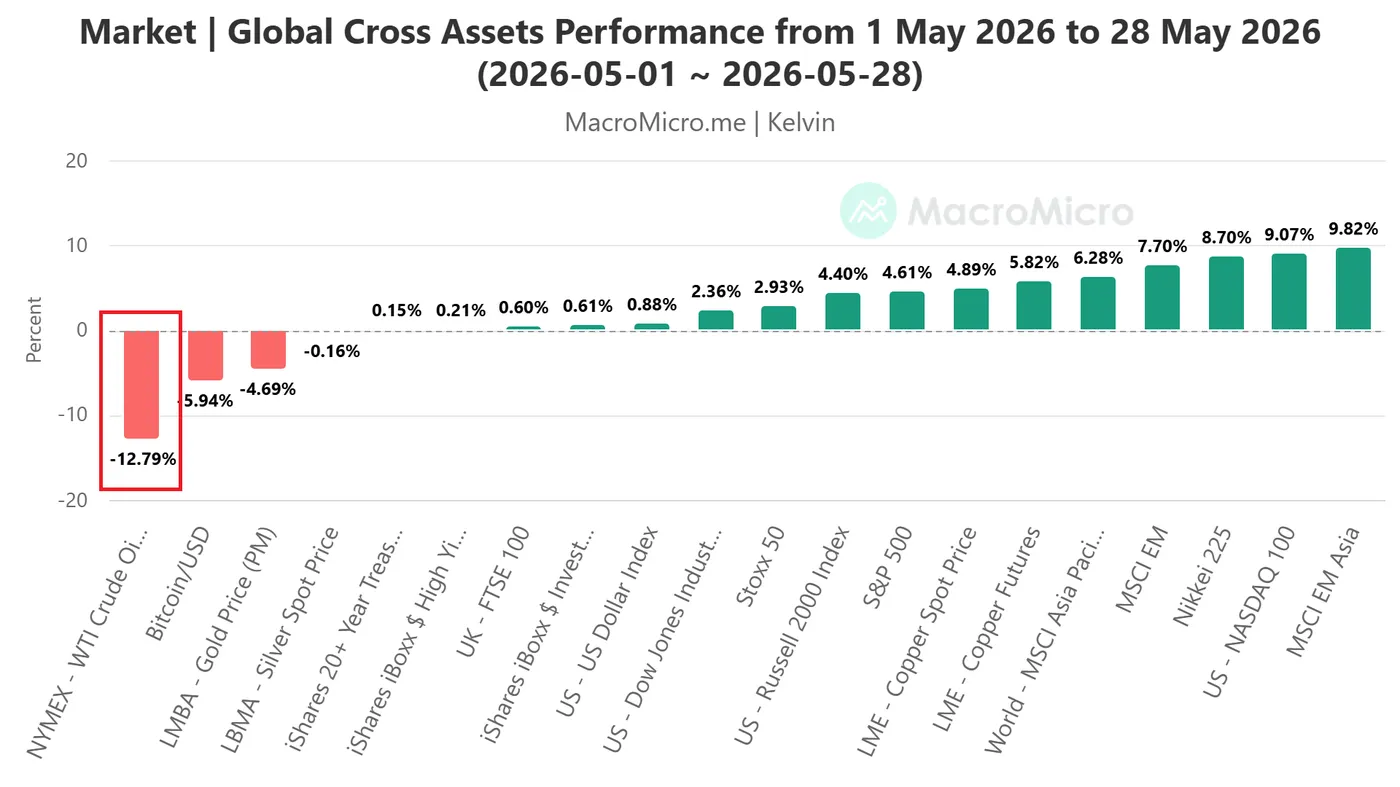
Fig. 1: Major cross-asset performances from 1 May 2026 to 28 May 2026 (Source: MacroMicro).
The ongoing weakness in crude oil prices has been primarily due to a potential end to the current three-month US-Iran conflict, which is likely to lead to the reopening of the Strait of Hormuz, reinforced by a tentative deal to extend a ceasefire by 60 days and, separately, to launch further talks on Tehran’s nuclear program. This sticky point caused the breakdown in US-Iran negotiations over the past month.
West Texas Intermediate (WTI) crude oil has now become the worst performer among major cross-asset classes in May, with WTI crude oil futures notching a double-digit loss of 13% from 1 May 2026 to Thursday, 28 May 2026 (see Fig. 1).
Let’s now focus on the 1 to 3 days trajectory of WTI crude oil from a technical analysis perspective.
WTI Crude – Oscillating Within a Minor Descending Channel
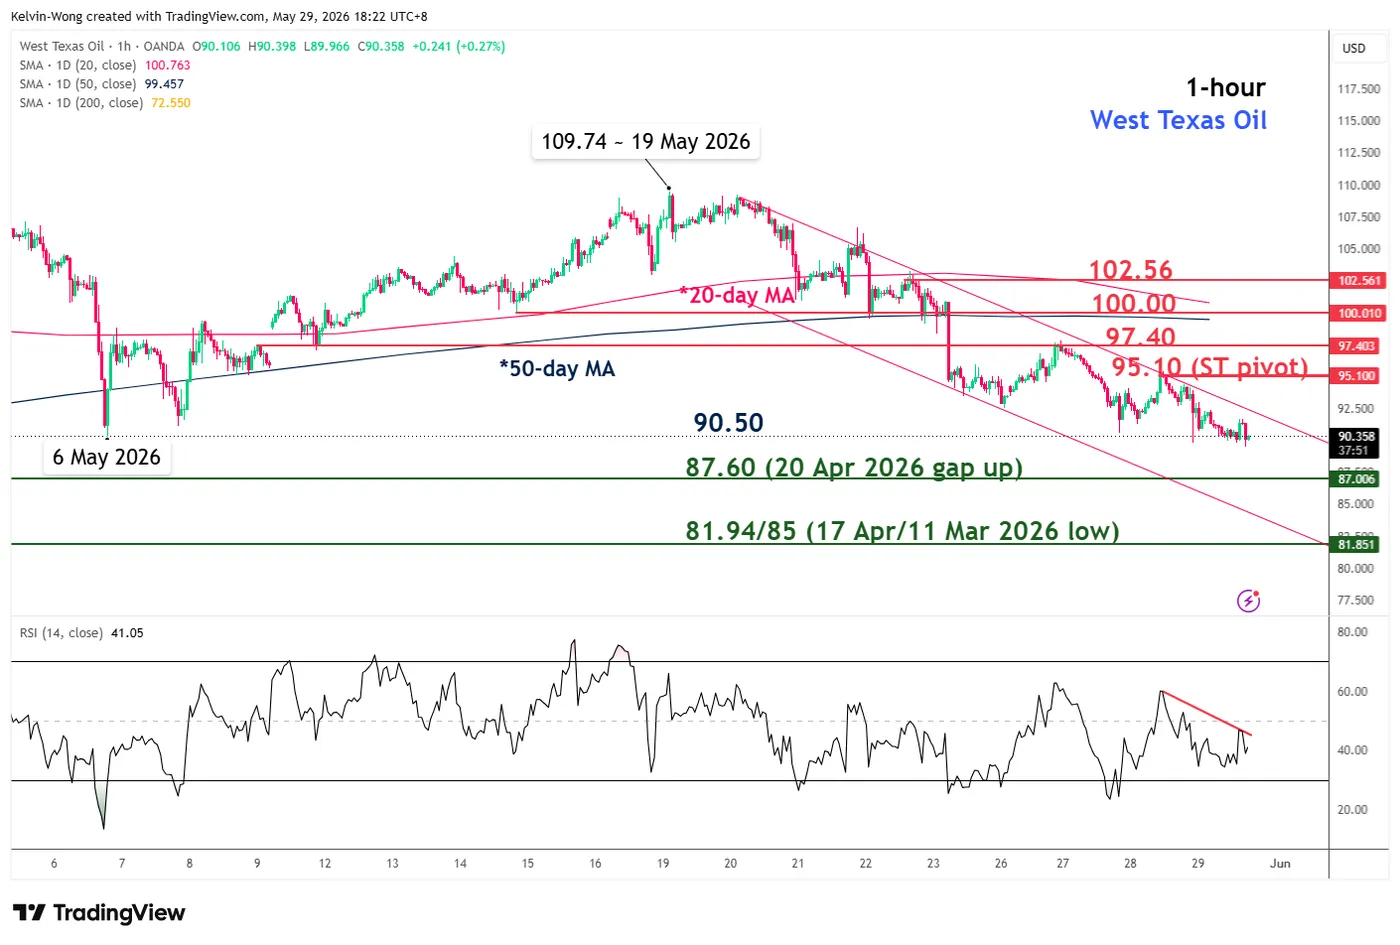
Fig. 2: West Texas crude oil CFD minor trend as of 29 May 2026 (Source: TradingView).
Trend bias: Minor downtrend within medium-term range configuration with 95.10 key short-term pivotal resistance (see Fig. 2).
Supports: 87.60 (20 Apr 2026 gap), and 81.94/85 (17 Apr/11 Mar 2026 low & minor descending channel’s lower boundary).
Next resistances: 97.40 (26 May 2026 high), 100.00 (psychological, 20-day & 50-day Mas), and 102.56 (22 May 2026 high & 61.6% Fibonacci retracement from 19 May 2026 high to 29 May 2026 intraday low).
Key Elements to Support the Near-Term Bearish Bias on the WTI Crude
- Price actions have formed a minor descending channel since the 20 May 2026 high
- Price actions remain below the 20-day and 50-day moving averages since 25 May 2026.
- The hourly RSI momentum indicator has continued to flash out bearish momentum conditions below the 50 level and has not reached its oversold region (below the 30 level).
Volatility in EUR/USD Eases, but Market Risks Remain
EUR/USD ended Friday at 1.1640 following significant volatility during the previous session. Pressure on the US dollar emerged after reports suggested that the US and Iran had reached preliminary agreements aimed at resolving the conflict. This helped ease market concerns over inflation and the need for further interest rate hikes.
According to media reports, Washington and Tehran are discussing a 60-day extension of the ceasefire alongside negotiations regarding Iran’s nuclear programme. The possibility of fully restoring shipping through the Strait of Hormuz is also reportedly under consideration.
However, a final agreement has yet to be approved. Reports indicate that Donald Trump has not formally endorsed the proposed terms of the deal.
Additional pressure on the dollar came from US PCE inflation data, which showed weaker price pressures than investors had anticipated. This reduced concerns about the impact of the energy crisis on inflation.
Despite this, markets still expect the Federal Reserve to keep interest rates at current levels for an extended period, at least over the coming quarters.
Technical Analysis
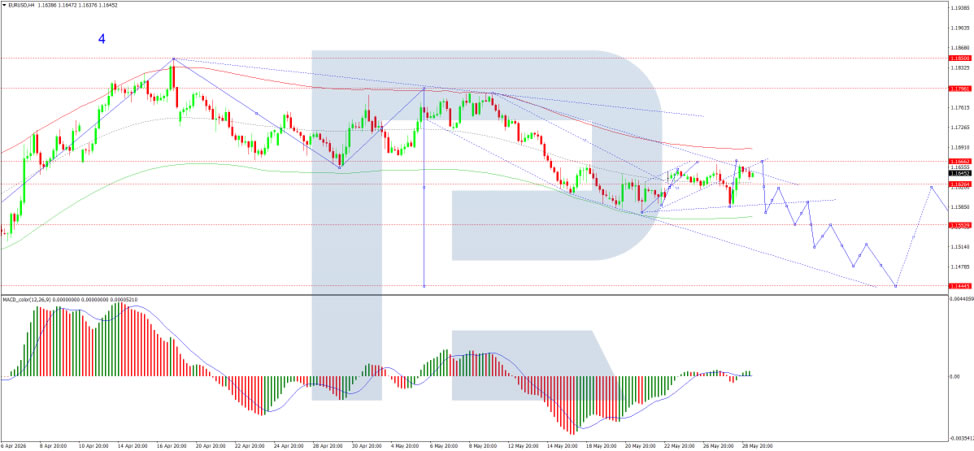
On the H4 EUR/USD chart, the pair is trading within a consolidation range around 1.1616, currently extending down to 1.1585. A move higher towards 1.1666 is likely, ** as a retest from below, followed by a decline towards 1.1555. The MACD indicator supports this scenario, with the signal line above zero and pointing firmly upwards, indicating continued bullish momentum.
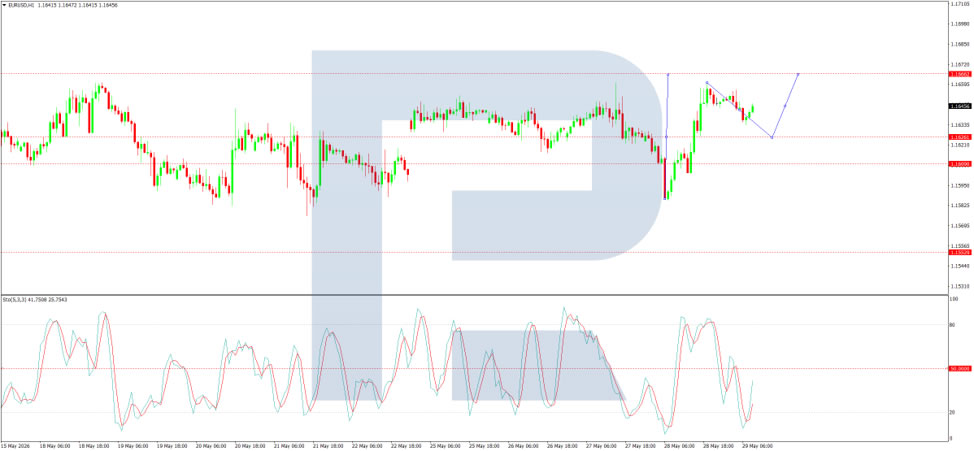
On the H1 chart, EUR/USD has reached 1.1660 and is now pulling back towards 1.1626. A further rise towards 1.1666 may follow, before a possible decline towards 1.1555. The Stochastic oscillator confirms this scenario, with the signal line above 20 and pointing upwards towards 80.
Conclusion
EUR/USD stabilised after heightened volatility as easing geopolitical tensions and softer US inflation data weakened the dollar. Nevertheless, uncertainty surrounding US–Iran negotiations and expectations of prolonged high US interest rates continue to pose risks to the pair.
EUR/USD Stalls Below 1.1660 as Dollar Refuses to Break Despite US-Iran Ceasefire Extension
Markets have spent the past 24 hours receiving what should have been overwhelmingly Dollar-negative news. Negotiators from Washington and Tehran reportedly finalized a draft framework that would extend the current ceasefire, reopen the Strait of Hormuz, lift restrictions on Iranian oil exports, and reduce one of the largest geopolitical risks hanging over global markets. The development triggered another decline in oil prices, with Brent crude nearing a break below $90 per barrel. Meanwhile, enthusiasm surrounding artificial intelligence continued to drive global equities higher, pushing major U.S. and Asian stock indices to fresh records.
Despite all that, the Dollar remains remarkably resilient. The reason may be that foreign exchange traders are not buying the peace narrative as aggressively as equity investors. The proposed framework remains conditional on political approval, and both sides continue to communicate cautiously. Currency markets appear unwilling to completely remove the geopolitical risk premium until a formal agreement is signed and implementation begins. The memory of repeated setbacks throughout the conflict is keeping traders from abandoning defensive positioning entirely.
More importantly, the market is increasingly focused on the inflation consequences of the conflict rather than its potential resolution. The Middle East war already pushed energy prices sharply higher for several months, and the resulting inflation pressures have now appeared in official data, forcing the Federal Reserve to move away from any easing bias. Even if oil prices continue to fall from here, that does not erase the inflation already recorded or the Fed's need to ensure inflation expectations remain anchored. In that environment, U.S. yields remain elevated and continue supporting Dollar demand.
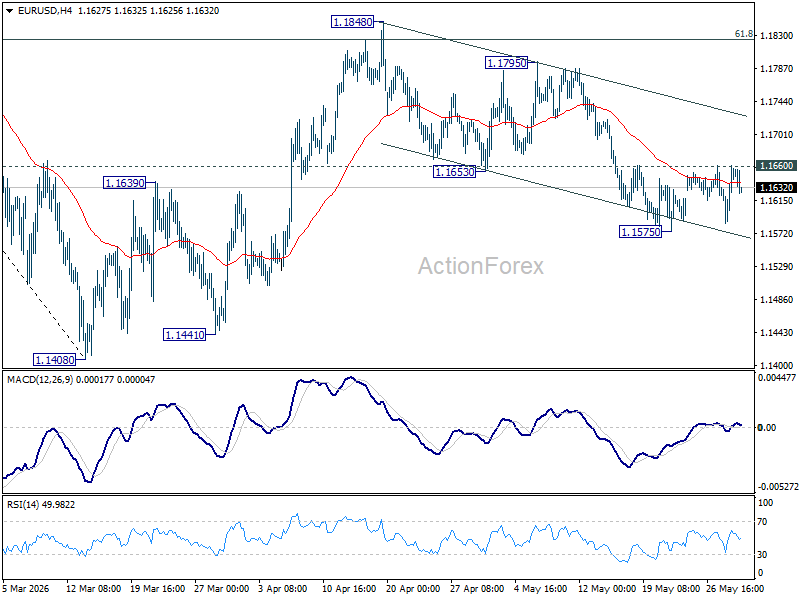
That dynamic helps explain why EUR/USD remains trapped in a relatively narrow range despite favorable conditions for Euro. The pair has recovered from 1.1575 but remains unable to clear 1.1660 resistance. As long as that barrier holds, the recovery can still be viewed as a consolidation within a broader decline from 1.1848.
On the downside, firm break through 1.1575 would reinforce the bearish case and target a return toward 1.1408 low.
Conversely, decisive break above 1.1660 would suggest the fall from 1.1848 has already completed as a correction at 1.1575, and open the way for a stronger recovery toward the falling channel resistance (now at 1.1725) at least.
FTSE 100: Correction Has Ended, but a New Impulse Has Yet to Form
Fundamental backdrop
The UK inflation report for April, published on 20 May, delivered unexpectedly positive figures: annual inflation slowed to 2.8% in April 2026 from 3.3% in March, coming in below the consensus forecast of 3.0% and marking the lowest reading since March last year.
Nevertheless, the relief is being viewed as temporary. The unresolved conflict involving Iran continues to exert pressure on oil prices, while the Bank of England maintains a cautious approach towards rate cuts, unwilling to move ahead of incoming inflation data.
Technical picture
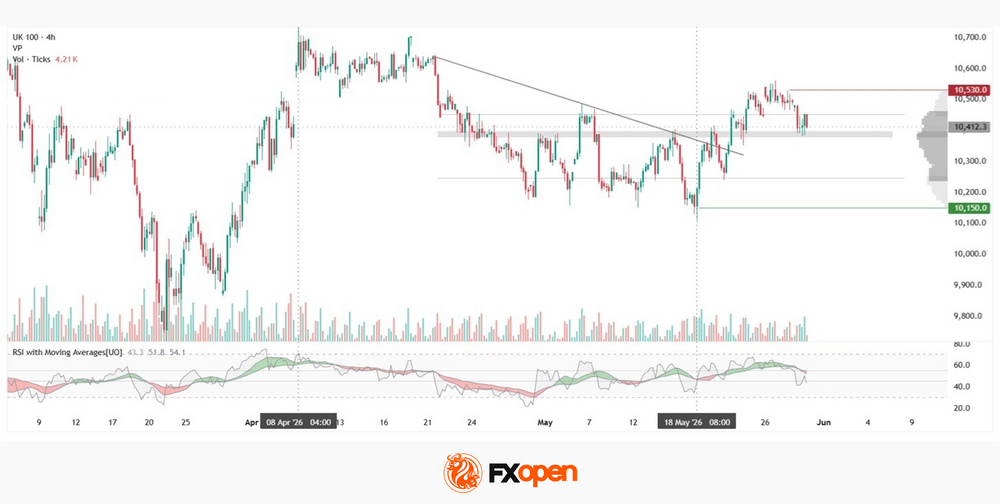
From 8 April to mid-May, the FTSE 100 index (UK100 on FXOpen) remained in a corrective decline: from the 10,700 area, price moved actively lower, but was soon supported by demand, followed by a further compression of quotations around 10,150. In the latter part of May, the trendline was broken to the upside; however, the index failed to establish itself above the upper boundary of the current profile near 10,450 — the latest candlesticks are forming within the range between the POC zone and the aforementioned profile boundary.
The point of control (POC) is concentrated around 10,380–10,390, where the highest trading activity within the current range is located. Should price break higher from the profile, the 10,530 area could become a serious obstacle for buyers. In the event of renewed selling pressure, the lower boundary of the profile near 10,250 may come back into focus, while the 10,150 area represents the next significant reference point.
RSI + MAs currently show a reading of 43, with the indicator positioned below both moving averages (51 and 54), which also casts doubt on the strength of the breakout.
Key takeaways
The descending trendline has been broken, yet RSI remaining below its moving averages points to weak momentum. The nature of the next move will largely depend on how the market reacts to expected Bank of England signals regarding the future rate path against the backdrop of temporarily slowing inflation.
Trade global index CFDs with zero commission and tight spreads (additional fees may apply). Open your FXOpen account now or learn more about trading index CFDs with FXOpen.
This article represents the opinion of the Companies operating under the FXOpen brand only. It is not to be construed as an offer, solicitation, or recommendation with respect to products and services provided by the Companies operating under the FXOpen brand, nor is it to be considered financial advice.
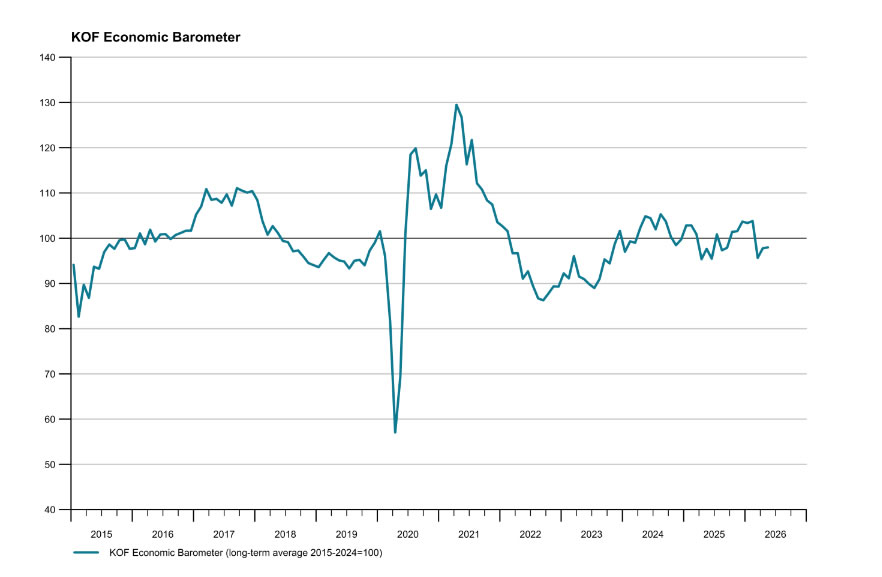
Swiss KOF Barometer Edges Higher to 98.0, But Outlook Remains Subdued
Switzerland's KOF Economic Barometer rose marginally from 97.8 to 98.0 in May, extending the modest improvement seen in the previous month. However, the leading indicator remains below its medium-term average, suggesting that the outlook for the Swiss economy continues to be subdued despite signs of stabilization. The latest reading points to an economy that is expanding only modestly as businesses continue to navigate a challenging external environment.
According to the KOF, underlying developments across sectors were mixed. Manufacturing indicators continued to face pressure, highlighting ongoing weakness in industrial activity. That softness was partly offset by more favorable conditions in financial and insurance services, which helped cushion the broader economy.
On the demand side, foreign demand indicators showed some improvement, offering a potential source of support for exporters in the months ahead. Domestic demand, however, remains less encouraging. KOF noted that indicators for private consumption deteriorated, suggesting households remain cautious despite relatively stable economic conditions.
| Indicator | Previous | Actual |
|---|---|---|
| KOF Economic Barometer | 97.8 | 98.0 |
Sunrise Market Commentary
Markets
News agency Axios has played a prominent part over the past months in reporting on the situation between the US and Iran. Information hasn’t been always that accurate, but financial markets at least treated it as some kind of short term compass. Yesterday, Axios cited two US officials on an agreement on a 60-day MoU to extend the ceasefire and launch negotiations on Iran’s nuclear program. They added that US President Trump still had to give his final approval to the diplomatic breakthrough. The interim deal would contain “unrestricted” shipping through Hormuz (no Iranian toll system) with Iran vowing to remove all mines within 30 days. The US would lift its naval blockade in proportion to the restoration of commercial shipping. The MoU would include an Iranian pledge not to pursue a nuclear weapon, but what to do with the pile of highly enriched uranium remains unsolved. The same goes for the release of frozen Iranian funds. Markets started regaining hope on a way out of the stalemate since the previous weekend. Brent crude currently trades around $92.5/b compared with last week’s close around $104.5/b. Yesterday’s $4/b intraday-drop offered support for both bonds and risk assets. The US yield curve bull flattened with yields ending 1.1 bp (2-yr) to 3.8 bps (30-yr) lower. German yields shed 2 to 3 bps across the curve. Intraday swings were larger though as core bonds had been suffering early on the session. Main US equity benchmarks closed up to 0.9% (Nasdaq) higher following an hesitant start. EUR/USD at first attempted to settle below 1.16 yesterday, before returning to the 1.1650 comfort zone. We continue treating these developments cautiously as on the face of it, the interim deal has more of buying time rather than effectively moving towards a workable solution.
There were plenty of eco data yesterday. US April PCE deflators were a tad softer-than-expected on a monthly basis with headline growing by 0.4% and core by 0.2%. Annual figures nevertheless matched consensus with rises from 3.5% Y/Y to 3.8% Y/Y for the top number and from 3.2% to 3.3% for the underlying series. Next month, our KBC Nowcast suggests a first 4%-reading since May 2023. Based on the unconditional forecast, that could remain the case for several months. Minutes of the April ECB meeting suggested that a June rate hike is in the making: “It had become increasingly likely that adopting a ‘looking through’ approach was not appropriate. It was argued that this situation shifted the primary focus to determining the most appropriate timing for a rate increase.” A number of officials wouldn’t have opposed moving already in April. Today’s eco calendar has some national European inflation numbers in store which could further cement the case. France, Spain, Italy and Germany all report today.
News & Views
CPI inflation in the Tokyo area, which is seen as a precursor for national Japanese trends, eased further this month. CPI ex fresh food rose 0.3% M/M and 1.3% Y/Y (from 1.5%). The core measure excluding fresh food and energy also eased to 0.1% M/M and 1.6% (from 1.9%). However, government measures to trim the cost of utility prices and tuition fees were for a large part responsible for the softer set of inflation data The easing in inflation comes as the BOJ assesses the timing of a next rate hike, probably already at the June16 policy meeting. Aside from mild Tokyo CPI data, a series of national data including April industrial production (+ 0.8% M/M), retail sales (1.3% M/M and 2.1% Y/Y) and labour market data (jobless rate from 2.7% to 2.5%) all come in on the better side of expectations. Today’s data releases don’t change money market expectations for the June policy meeting. Markes still discount a 75-80% probability for a rate hike from 0.75% to 1%. The yen trades little changed (USD/JPY 159.3).
The South African Reserve Bank (SARB) yesterday raised its policy rate by 25 bps to 7%. It was a spilt decision. The move was supported by 4 MPC members. Two policymakers preferred to keep the policy rate on hold. Governor Kganyago indicated that also a 50 bps step was discussed, but that the SARB preferred a more cautious approach as it awaits more data. The hike comes as inflation rose to 4% from 3.1% in April. This was mostly due to higher energy costs, but services inflation also accelerated to 4.6%. The SARB has a 3% inflation target (+/- 1% tolerance band). The SARB also raised inflation forecasts for this year and next year to 4.4% and 3.7% respectively and indicated that these forecasts entail some second round effects. The SARB explored three scenario (also taking into account the potential effects of El Nino), but all these scenario’s imply higher inflation and lower growth (expected at 1.2% this year from 1.4%). They also took notice of a stronger ZAR than last year, helping to contain imported inflation. The rand yesterday continued it recent rebound with USD/ZAR trading near 18.9.
With Hawkish ECB Minutes, Focus Turns to Euro Area Inflation Prints
In focus today
In the euro area, we will receive May flash inflation data from Germany, France, Italy and Spain, covering 75% of the aggregate euro area print. The rise in inflation has so far been largely confined to a few energy components, like car fuel, and we expect energy to remain the primary driver pushing euro area HICP inflation up to 3.2% y/y in May (April: 3.1% y/y). Core inflation is also expected to edge up to 2.3% y/y (April: 2.2% y/y), though mainly driven by base effects rather than a pick-up in underlying momentum.
In Sweden, Q1 national accounts are due, where we expect growth of 0.2% q/q and 2.4% y/y, slightly better than the flash GDP estimate. Households showed signs of weakness at the beginning of the year, but recently the picture has improved, as both the monthly consumption indicator and retail sales have picked up.
In Norway, unemployment figures and retail sales data will be released. The labour market remains relatively tight and despite some tentative signs of rising unemployment, we expect the seasonally adjusted unemployment rate to hold steady at 2.1% in May (April: 2.1%). On the consumption side, households are facing stronger headwinds from lower real wage growth, slowing employment growth and higher mortgage rates, all of which will gradually dampen consumption growth. Against this backdrop, we expect retail sales to have been unchanged in April (March: -0.1%).
Economic and market news
What happened overnight
In Japan, May Tokyo core CPI (excluding fresh food and energy), viewed by the Bank of Japan (BoOJ) as a gauge for trend inflation, increased 1.6% y/y (cons: 1.8%, April: 1.9%). Markets expect inflation to re-accelerate as elevated oil prices and a weak yen keep pressure on the BOJ, with markets largely pricing in a 25bps hike to 1.0% at next month's meeting.
What happened yesterday
In the euro area, the minutes came in on the hawkish side, with the ECB framing rate hikes as a question of not if but when. The ECB appears to be gearing up for a potential June hike, repeatedly noting that more information will be available then. Upside risks to inflation and downside risks to growth had both intensified since the March meeting, creating a "complicated policy trade-off", though members were careful to note there was "no evidence yet of strong second-round effects".
Also in the euro area, firms' selling price expectations declined slightly in both industry and services in the European Commission's May business survey, offering the ECB some relief after April's record surge. Selling price expectations for the industry are still very elevated, though below 2022 levels, and we should therefore expect price increases on core goods. However, the decline in services expectations should give the ECB some comfort as the index has risen only marginally following the Iran war. This suggests that the energy shock is not propagating to broader services prices (at least outside of transportation services).
In the US-Iran war, Axios reported that the two sides have reached an agreement for a 60-day ceasefire extension, which would also include reopening the Strait of Hormuz to shipping, though the deal is still pending approval from both Trump and Iranian leadership. If approved, negotiators would use the extended truce to address issues such as Iran's nuclear programme.
In oil market, Brent crude fell to USD 92/bbl after US and Iran seems to be nearing an agreement to extend the truce another 60 days. That is the lowest level since the ceasefire announcement in the start of April. Between these two announcements, Brent crude has traded well above USD 100/bbl on some days, and we see a risk that this could happen again as the situation remains fragile. Meanwhile, the US made another big draw of 9mb on its strategic reserves last week which helps contain the immediate pressure on oil prices.
In Norway, mainland GDP grew 0.2% q/q in Q1. This is marginally weaker than Norges Bank (NB) expected in the Monetary Policy Report in March of 0.4% q/q and will in isolation lower the probability of a rate hike in June. Revisions were negative as well, leaving the mainland GDP level approximately 0.45 percentage points below what NB had anticipated in Q1. We still view the May inflation figures (10 June) and the Regional Survey (11 June) as decisive for the June decision, but the figures clearly suggest that monetary policy was already restrictive ahead of the March hike.
Additionally, the Oil Investment Survey showed positive adjustments for both 2026 and 2027, though the upward revisions were smaller than at the same time last year, pointing to nominal declines of approximately 1% this year and a flat development next year. The release came in on the weak side, though it is unlikely to be a determining factor for NB's short-term rate setting.
In Sweden, the NIER survey edged up to 99.3 in May (April: 99.2), with consumer confidence rising to 92.4 (April: 91.7) and the manufacturing index increasing to 100.5 (April: 100.0). Notably, price plans also increased, consistent with rising input prices in the PMI, supporting our view of higher inflation pressure ahead. Price plans typically lead inflation by around three months and will be closely watched, as considerable uncertainty remains around whether firms have altered their price-setting behaviour.
In the US, April core PCE came in slightly below expectations at +0.2% m/m (cons: +0.3%), causing a modest dovish market reaction with yields down and the USD broadly weaker. Real private consumption continued to grow, with consumers absorbing higher costs by drawing down savings. Notably, goods prices are becoming an increasingly important driver of core inflation. On the growth side, Q1 GDP was revised down to 1.6% q/q AR from the 2.0% flash estimate, though underlying growth remained fairly solid. Consistent with recent remarks, Fed's Williams noted that monetary policy is "well positioned" while flagging that persistently high inflation would warrant higher rates.
Equities: Equities rebounded yesterday, driven by US. S&P 500 up 0.6% ending not far from best levels, while markets in Nordics and Europe remained sluggish. US and Asia continue to outperform, as the momentum trade in semis/memory resumed yesterday. But this was also a session of growth stock preference; companies within medtech, software and materials fared particularly well. Gains in software triggered by strong earnings from Snowflake, beating estimates, raising its outlook and on top of it all, announcing an AI deal with Amazon; thereby disproving the software-scare among investors.
The latest growth and momentum are benefitting the US sector composition more than Europe, alongside a strong macro backdrop. Along the same lines, Asian equities are rallying this morning (Nikkei 225 2.5%, Kospi 3%, Hang Seng 1%). Since the market troughed on 30 March, US equities have returned nearly twice as much as European equities (S&P 500 19% vs Stoxx 600 10%). It is a crazy outperformance, but we think this gap will continue to grow, and Europe outperforming briefly the week when the Strait of Hormuz reopen is a blip on the curve.
FI and FX: The tentative US-Iran deal to extend the ceasefire is taking centre stage this morning. That said, while oil prices have extended the decline back down towards the lower 90s USD/bbl the reaction in rates and FX markets has still been muted with e.g. interday moves in FX majors kept within +/- 1 standard deviations. More importantly, US PCE inflation yesterday contributed to sending yields lower with 30Y US Treasury yields now firmly back below the 5.00% level, the US swaps curve has bull flattened while EUR/USD FX spot is trading around 1.1640. In the Scandies, short-end rates spreads to EUR have widened for NOK but remained stable in SEK. EUR/SEK and EUR/NOK have both been relatively stable with SEK notably outperforming NOK.