
Sample Category Title
Economics Week Ahead
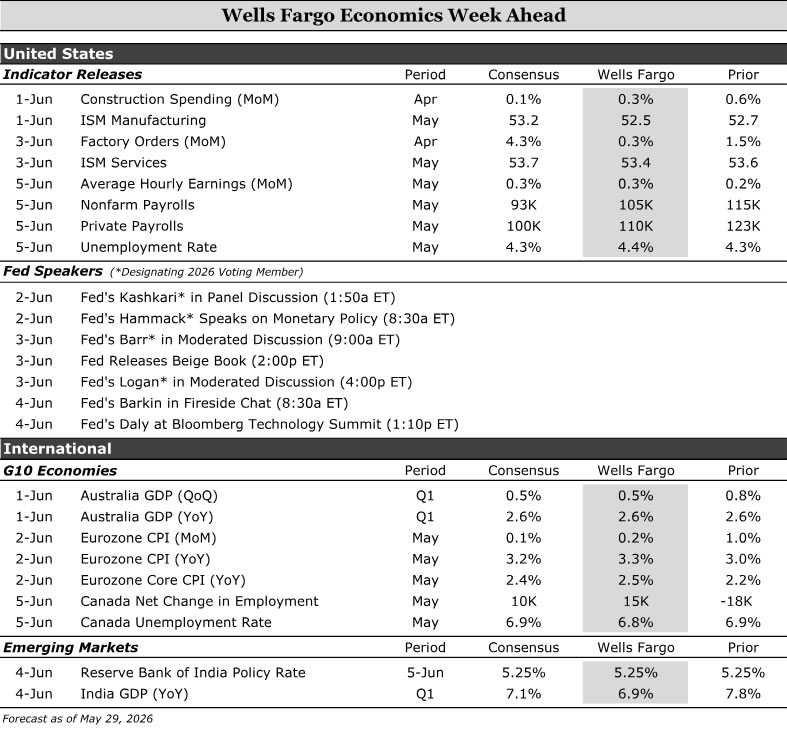
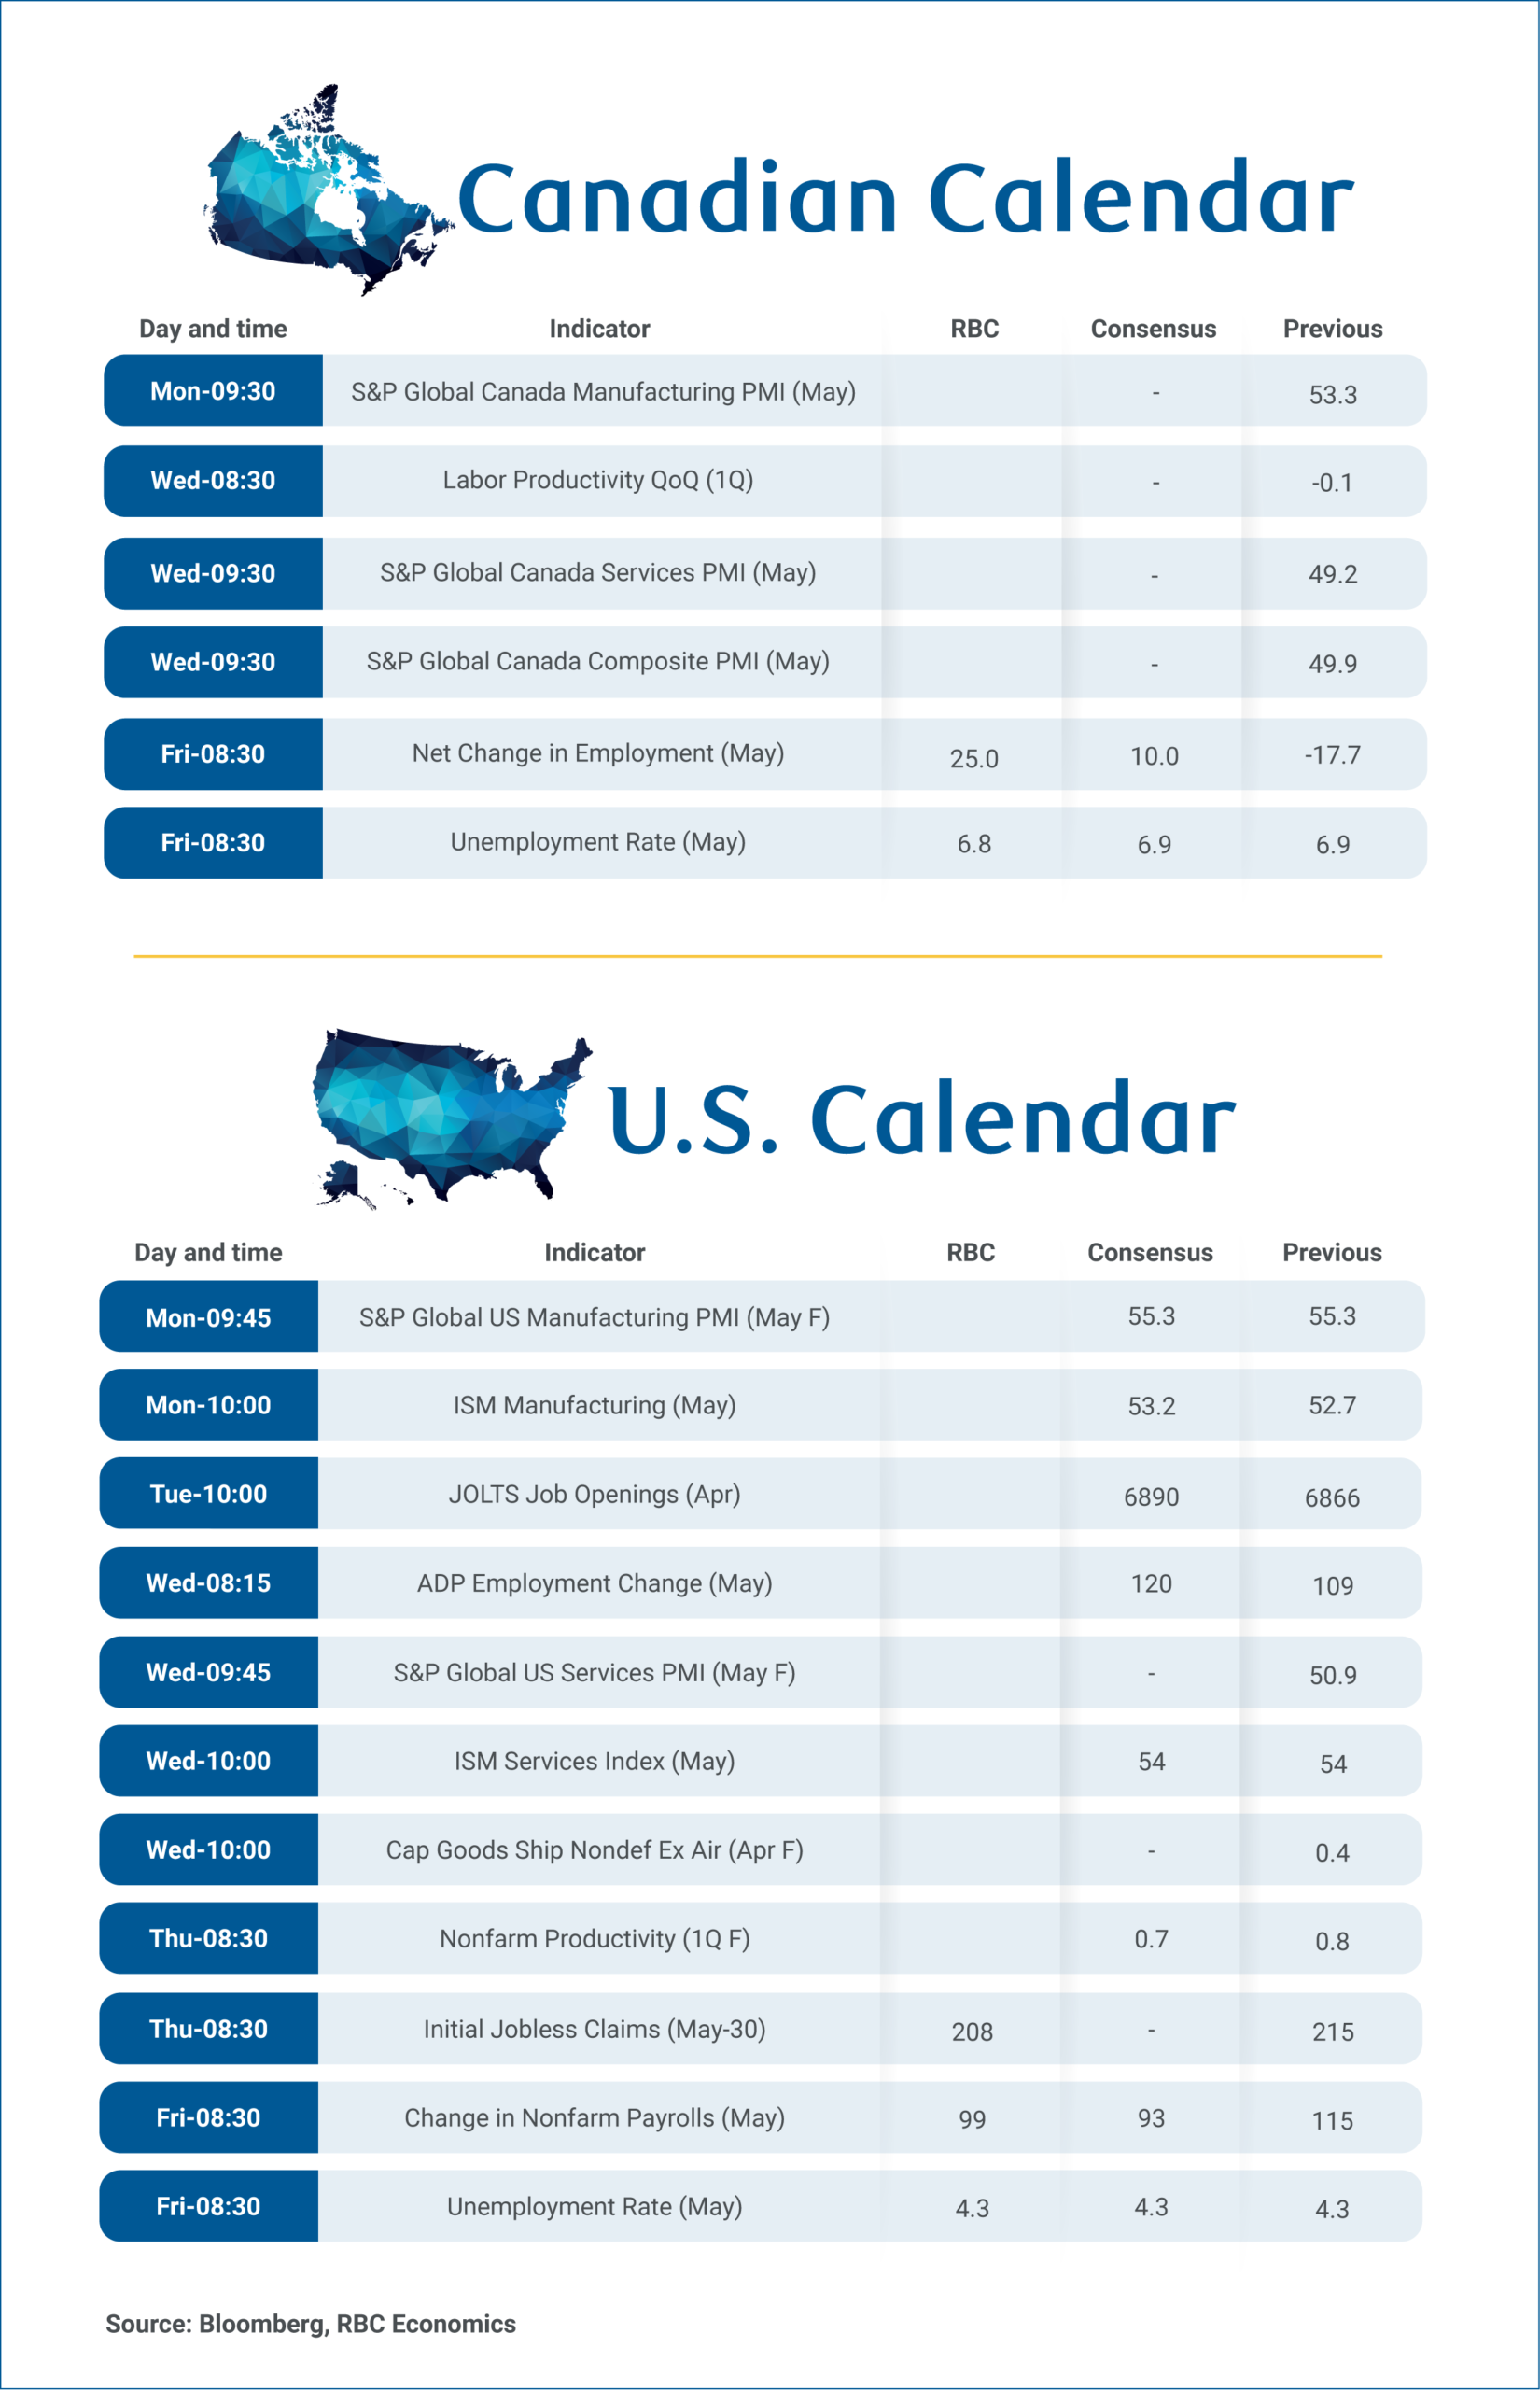
The focus next week is Friday’s U.S. employment report, where we look for May nonfarm payrolls to rise by 105K and the unemployment rate to edge up to 4.4%. Taken together, the report should leave the broader message unchanged: the labor market is no longer deteriorating but still is not meaningfully improving, either. Earlier in the week, the U.S. ISM surveys should point to expansion, with manufacturing holding near April's level at 52.5 and services easing to 53.4 from 53.6, though the prices paid components will matter most as a signal of broader inflationary pressure.
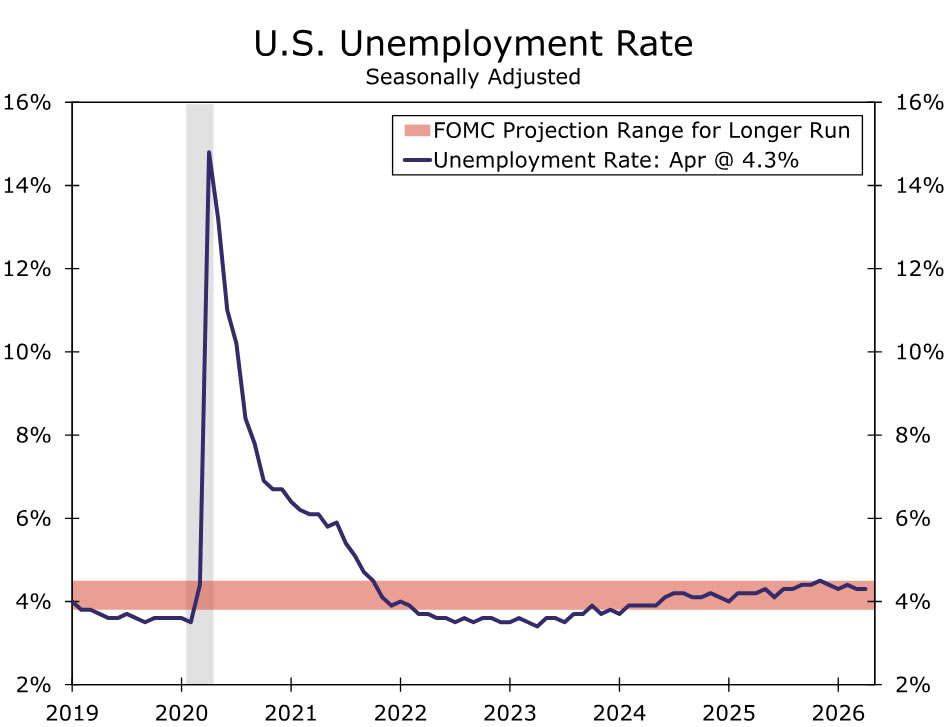
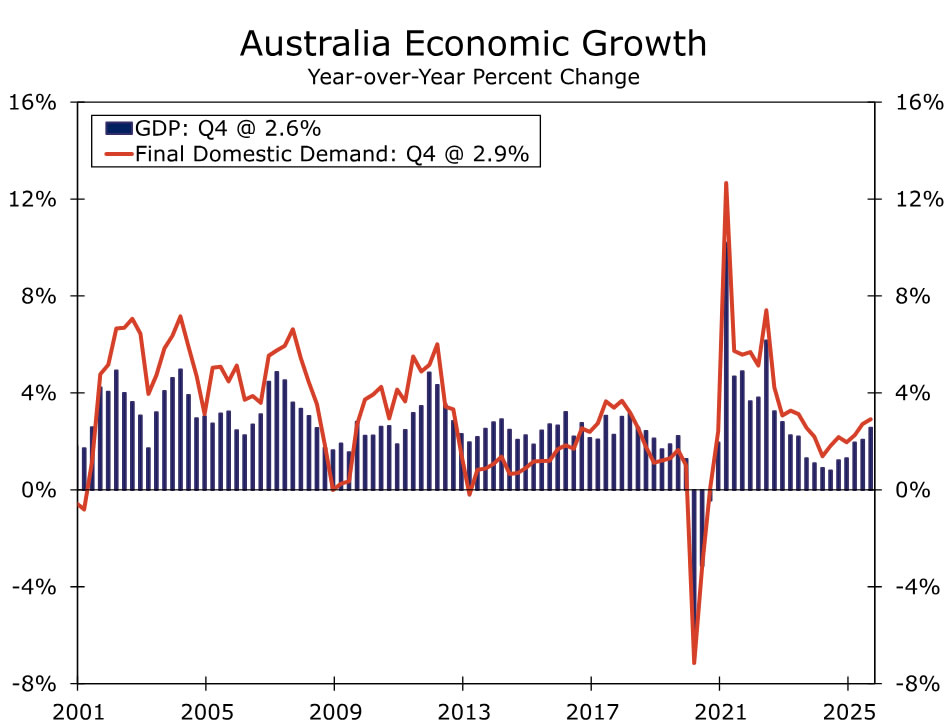
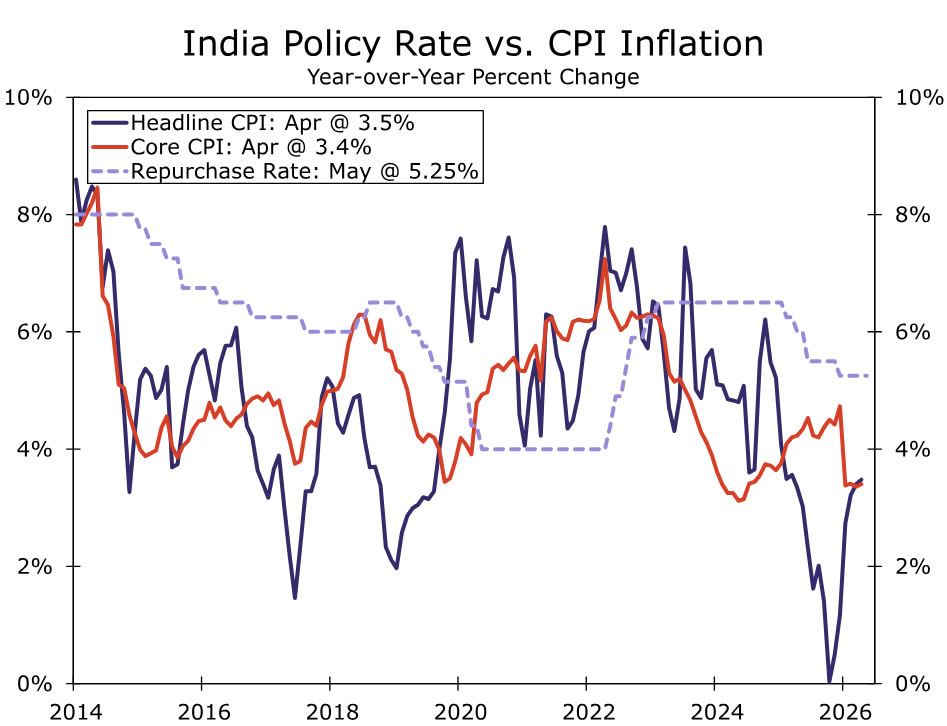
Outside the U.S., we expect Eurozone CPI to rise to 3.3% year-over-year in May from 3.0% last month and core CPI to increase to 2.5% from 2.2%, keeping pressure on the ECB ahead of its June meeting. In Australia, Q1 GDP is likely to remain at a more moderate 2.6% year-over-year rate, and in Canada, we expect employment to rise 15K and the unemployment rate to dip to 6.8%. In emerging markets, the Reserve Bank of India is likely to leave the repurchase rate unchanged at 5.25% next week, though we continue to expect two rate hikes this year.
United States:
- ISM Surveys (Monday & Wednesday), Employment (Friday)
G10 Economies:
- Eurozone CPI (Tuesday), Australia GDP (Wednesday), Canada Labor Force Survey (Friday)
Emerging Markets:
- Reserve Bank of India Policy Rate (Friday)
U.S. Week Ahead
ISM Surveys • Monday & Wednesday
We expect the ISM surveys to indicate continued expansion in May. Regional Fed manufacturing surveys and the Markit PMI both point to little change in underlying conditions, and we look for the ISM manufacturing index to hold near April levels at 52.5.
The prices paid component will get the most attention given the market's focus on assessing the inflationary spillovers from the ongoing conflict in Iran. Manufacturing input costs have moved sharply higher, but there is little evidence of a comparable pickup in services, where pricing pressures appear more contained.
Service-sector activity also looks resilient. We forecast the ISM services index edging down modestly to 53.4 from 53.6 in April. While uncertainty and cost pressures are building, the data continue to suggest demand is holding up rather than deteriorating materially.
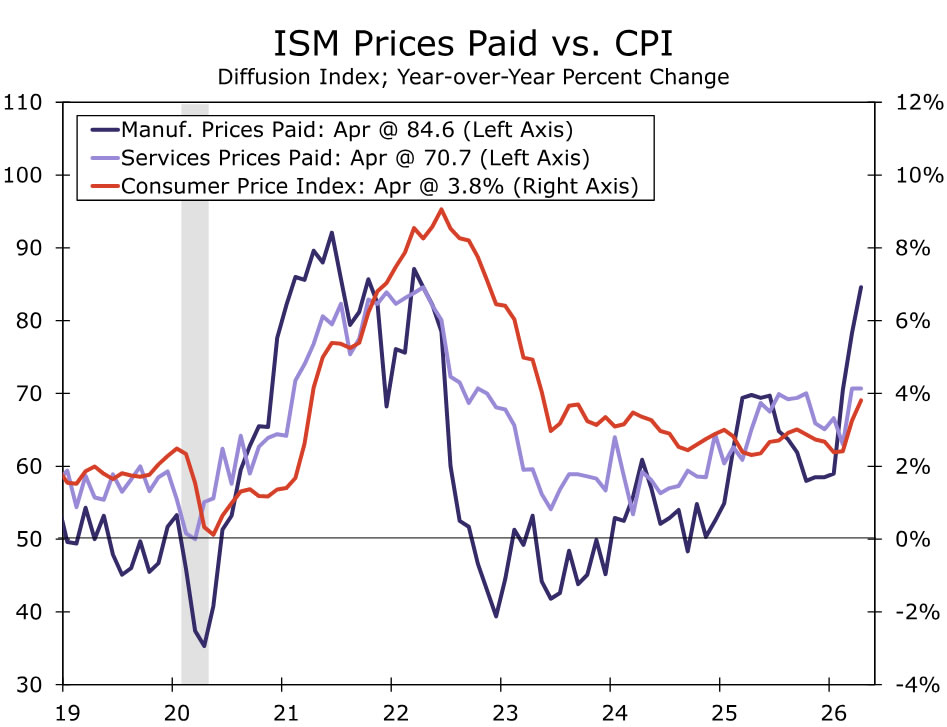
Employment • Friday
The labor market remains stuck in a low fire, low hire equilibrium. Initial jobless claims remain low, and major layoff announcements have been largely limited to tech. Hiring, however, shows few signs of improvement. New job postings on Indeed and regional Fed employment PMIs have been moving sideways, while the Conference Board’s labor differential slipped in May. Together, these indicators suggest there has not been a re-acceleration in labor demand.
With demand little changed, we estimate nonfarm payrolls rose 105K in May. Hiring in cyclically sensitive industries has picked up a bit since late last year, but we expect to see some pockets of weakness following the bankruptcy of Spirit Airlines and additional layoffs hitting the information industry.
Tepid demand for new workers, including recent college grads, is likely to lead to the unemployment rate back up to 4.4%. While most of the drop-off in the participation rate over the past year can be attributed to demographics, the slide also reflects a swath of labor force exits. With the labor force participation rate falling every month this year, we would not be surprised to see a partial rebound in May that pushes the jobless rate higher. Even with an uptick though, the unemployment rate has been largely unchanged over the past year. The stability underscores a labor market that is no longer deteriorating, but also not improving.
G10 Week Ahead
Eurozone CPI • Tuesday
Euro area May CPI is likely to move up to 3.3% year-over-year change from 3.0% in April. On a monthly basis, we expect momentum to ease to 0.2% (from 1.0%) as energy prices stabilize after prior gains. The key question for markets and policymakers is whether price pressures are broadening, as inflation to date has remained concentrated in a narrow set of energy-intensive goods and services. PMI data point to renewed pressure on input costs, although this has yet to feed through to output prices. Focus will remain on services and non-energy industrial goods (NEIG) as indicators of broader pass-through. We look for core CPI to rise to 2.5% year-over-year from 2.2% in April.
Looking ahead to the ECB’s June meeting, the Governing Council will have the May inflation print alongside updated staff forecasts. We continue to see June as the likely starting point for rate hikes, with a follow-up move in Q3, most likely July. That said, a downside surprise in core or continued narrowness in price pressures could tilt the decision toward a hawkish hold in June, with a clear bias to move once broader pass-through becomes evident.
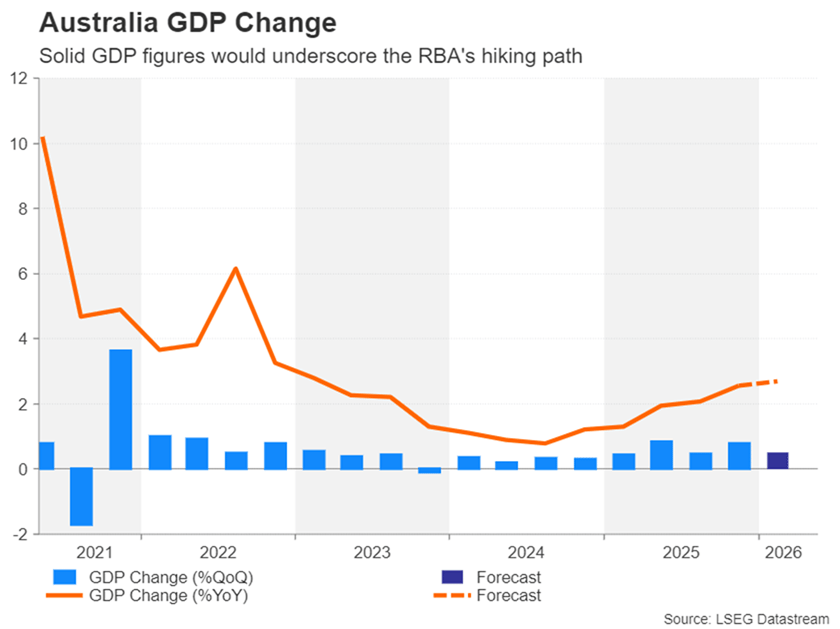
Australia GDP • Wednesday
Australia’s Q1 GDP release next week is likely to show a more moderate pace of growth after the stronger Q4 print. We expect GDP to rise 0.5% quarter-over-quarter and 2.6% year-over-year. While the previous quarter’s headline growth was strong, reaching its fastest annual pace in nearly three years, the underlying details were less convincing. Inventories played an outsized role, while net exports dragged as imports rose sharply.
Q1 indicators have been uneven. PMIs started the year on firmer footing, then softened through the quarter and ended in contraction. Monthly household spending also looked soft in January and February before rebounding sharply in March, though some of that strength may reflect front-loading linked to the Middle East conflict. Investment should provide some support after the stronger Q1 cape print (led by machinery and equipment, driven by a 196% quarter-over-quarter surge in information and telecommunications). However, that is unlikely to fully offset softer consumption and another likely drag from net exports (as shown in the surge of March's import bill).
In terms of monetary policy implications for the Reserve Bank of Australia, a materially softer GDP print would reinforce the drag from higher rates on household spending and confidence. Still, while April headline inflation cooled, underlying price pressures rose to 3.4% year-over-year and underscored continued pass-through risks. Against this backdrop, we continue to see room for one more 25 bps hike in August, taking the Cash Rate to 4.60%.
Canada Labor Force Survey • Friday
We expect the stabilization narrative in the labor market to persist despite April’s unexpected softening. Employment growth is projected to rise by 15k in May, with the unemployment rate declining to 6.8%. The April increase in unemployment was driven by a surge in participation alongside weak hiring rather than layoffs.
Looking ahead, labor demand should be supported by firmer consumer spending, improved business sentiment, and ongoing fiscal support. Elevated energy and commodity prices represent an inflationary tailwind for Canada, likely skewing job gains toward resource-linked sectors. Structurally, labor supply constraints remain intact, with an aging workforce and weaker immigration flows continuing to weigh on participation and push the unemployment rate lower over time.
A weak May print would challenge the stabilization narrative and, coupled with soft Q1 GDP, could push back expectations for a BoC rate hike beyond July, which remains our baseline.
EM Week Ahead
Reserve Bank of India Policy Rate • Friday
Reserve Bank of India (RBI) policymakers will meet next week, and we expect them to leave the Repurchase Rate on hold at 5.25%. We see a hold as likely because inflation is still within the RBI’s 2%-6% target range, helped in part by government subsidies, which gives policymakers some room to assess pass-through before tightening policy. That said, the inflation outlook has become more challenging. Higher energy and food prices are likely to push headline inflation higher in the coming months, especially if the Middle East conflict keeps energy prices elevated or El Niño conditions weigh on the southwest monsoon.
Recent high-frequency indicators suggest that strong momentum in economic activity has continued, and next week’s Q1 GDP print should provide a clearer read on the economy’s underlying strength. Still, the growth outlook has become more vulnerable as higher energy prices, rising shipping and insurance costs, and supply disruptions risk pressuring margins and weighing on downstream production. The rupee has also come under pressure from higher oil prices, short-term capital outflows, and a stronger dollar.
At its April meeting, the MPC maintained a neutral stance, which preserved flexibility to respond to incoming data. With inflation risks moving higher, growth risks shifting to the downside, and currency pressures building, we continue to see policy risks skewed toward tightening. We maintain our view for two rate hikes this year, one in Q3 and one in Q4, which would bring the Repurchase Rate to 5.75%.
Expect Canada’s Unemployment Rate to Tick Lower in May
Canada’s economy had a soft start to 2026. Real GDP growth disappointed consensus expectations and was broadly unchanged in Q1 and the unemployment rate has edged higher.
Still, we expect signs of stabilizing labour demand in the summer and hiring for the federal government census (typically 15,000 jobs) to have driven moderate job growth of about 25,000 in May, while the unemployment rate likely ticked lower to 6.8%.
This improvement follows large counts of job losses earlier this year, but also hidden signs of resilience in the labour market. Critically, layoffs have been limited to heavily trade exposed sectors, and have been declining in total since October 2025. Instead, unemployment increases in 2026 largely reflected longer job searches for new market entrants due to persistently weak hiring.
That is little comfort for those looking for work, but it’s not the kind of labour market softening typically seen, for example, at the beginning of a recession.
In a recent speech, the Bank of Canada’s Deputy Governor Nicolas Vincent also characterized the job market as “low hire, low fire,” and highlighted a high share of people that have been out of work for a long time, and particularly high unemployment among young job seekers.
Overall, hiring intentions took a step back after the Middle East conflict injected new uncertainty into the business operating environment. Total job postings on Indeed.com, however, showed signs of resilience, with job postings starting to bounce back in May after declining in March and April.
Looking ahead, elevated oil prices remain a key risk to the Canadian economy and labour market. Sharply higher oil prices raise revenue flowing into oil producing regions, but could also divert business priorities from hiring toward margin preservation as fuel costs surge.
Meanwhile, concerns about consumer demand (with higher gasoline prices cutting into household purchasing power) could also limit businesses’ ability to pass on those cost increases while remaining competitive. Though, early consumer spending data show limited signs of demand destruction so far.
We will continue to monitor conditions as elevated oil prices persist. However, with household demand broadly holding up right now, our base case forecast remains cautiously optimistic for more stabilization in hiring in the summer, and a gradual decline in the unemployment rate toward the end of this year.
We expect structural tightness in the U.S. labour market to have persisted in May, with the unemployment rate holding steady at a decade-low 4.3% while jobs grew 99k to broadly match the 115k pace in April. Average hourly earnings are expected to have accelerated, rising 0.3% in May. Initial claims likely held low, at 208k vs. the 215k reported this week.
Summary 6/1 – 6/5
Monday, Jun 1, 2026
| GMT | Ccy | Events | Cons | Prev |
|---|---|---|---|---|
| 23:50 | JPY | Capital Spending Q1 | 4.10% | 6.50% |
| 00:30 | JPY | Manufacturing PMI May | 54.5 | 54.5 |
| 01:00 | AUD | TD-MI Inflation Gauge M/M May | 0.60% | |
| 01:45 | CNY | RatingDog Manufacturing PMI May | 51.4 | 52.2 |
| 06:00 | EUR | Germany Retail Sales M/M Apr | -0.40% | -2.00% |
| 06:30 | CHF | Real Retail Sales Y/Y Apr | 0.20% | 0.50% |
| 07:00 | CHF | GDP Q/Q Q1 | 0.50% | 0.10% |
| 07:30 | CHF | Manufacturing PMI May | 54 | 54.5 |
| 07:50 | EUR | France Manufacturing PMI May F | 48.9 | 48.9 |
| 07:55 | EUR | Germany Manufacturing PMI May F | 49.9 | 49.9 |
| 08:00 | EUR | Eurozone Manufacturing PMI May F | 51.4 | 51.4 |
| 08:00 | EUR | Eurozone M3 Money Supply Y/Y Apr | 3.30% | 3.20% |
| 08:30 | GBP | Manufacturing PMI May F | 53.7 | 53.7 |
| 09:00 | EUR | Eurozone Unemployment Rate Apr | 6.20% | 6.20% |
| 13:30 | CAD | Manufacturing PMI May | 53.3 | |
| 13:45 | USD | Manufacturing PMI May F | 55.3 | 55.3 |
| 14:00 | USD | ISM Manufacturing PMI May | 52.6 | 52.7 |
| 14:00 | USD | ISM Manufacturing Prices Paid May | 85.3 | 84.6 |
| 14:00 | USD | ISM Manufacturing Employment Index May | 46.4 | |
| 14:00 | USD | Construction Spending M/M Apr | 0.30% | 0.60% |
| 23:50 | JPY |
| Capital Spending Q1 | |
| Consensus | 4.10% |
| Previous | 6.50% |
| 00:30 | JPY |
| Manufacturing PMI May | |
| Consensus | 54.5 |
| Previous | 54.5 |
| 01:00 | AUD |
| TD-MI Inflation Gauge M/M May | |
| Consensus | |
| Previous | 0.60% |
| 01:45 | CNY |
| RatingDog Manufacturing PMI May | |
| Consensus | 51.4 |
| Previous | 52.2 |
| 06:00 | EUR |
| Germany Retail Sales M/M Apr | |
| Consensus | -0.40% |
| Previous | -2.00% |
| 06:30 | CHF |
| Real Retail Sales Y/Y Apr | |
| Consensus | 0.20% |
| Previous | 0.50% |
| 07:00 | CHF |
| GDP Q/Q Q1 | |
| Consensus | 0.50% |
| Previous | 0.10% |
| 07:30 | CHF |
| Manufacturing PMI May | |
| Consensus | 54 |
| Previous | 54.5 |
| 07:50 | EUR |
| France Manufacturing PMI May F | |
| Consensus | 48.9 |
| Previous | 48.9 |
| 07:55 | EUR |
| Germany Manufacturing PMI May F | |
| Consensus | 49.9 |
| Previous | 49.9 |
| 08:00 | EUR |
| Eurozone Manufacturing PMI May F | |
| Consensus | 51.4 |
| Previous | 51.4 |
| 08:00 | EUR |
| Eurozone M3 Money Supply Y/Y Apr | |
| Consensus | 3.30% |
| Previous | 3.20% |
| 08:30 | GBP |
| Manufacturing PMI May F | |
| Consensus | 53.7 |
| Previous | 53.7 |
| 09:00 | EUR |
| Eurozone Unemployment Rate Apr | |
| Consensus | 6.20% |
| Previous | 6.20% |
| 13:30 | CAD |
| Manufacturing PMI May | |
| Consensus | |
| Previous | 53.3 |
| 13:45 | USD |
| Manufacturing PMI May F | |
| Consensus | 55.3 |
| Previous | 55.3 |
| 14:00 | USD |
| ISM Manufacturing PMI May | |
| Consensus | 52.6 |
| Previous | 52.7 |
| 14:00 | USD |
| ISM Manufacturing Prices Paid May | |
| Consensus | 85.3 |
| Previous | 84.6 |
| 14:00 | USD |
| ISM Manufacturing Employment Index May | |
| Consensus | |
| Previous | 46.4 |
| 14:00 | USD |
| Construction Spending M/M Apr | |
| Consensus | 0.30% |
| Previous | 0.60% |
Tuesday, Jun 2, 2026
| GMT | Ccy | Events | Cons | Prev |
|---|---|---|---|---|
| 23:50 | JPY | Monetary Base Y/Y May | -9.50% | -11.30% |
| 01:30 | AUD | Current Account (AUD) Q1 | -22.8B | -21.1B |
| 01:30 | AUD | Building Permits M/M Apr | -1.50% | -10.50% |
| 08:30 | GBP | Mortgage Approvals Apr | 62K | 64K |
| 08:30 | GBP | M4 Money Supply M/M Apr | 0.60% | 0.80% |
| 09:00 | EUR | Eurozone CPI Y/Y May P | 3.20% | 3.00% |
| 09:00 | EUR | Eurozone Core CPI Y/Y May P | 2.40% | 2.20% |
| 23:50 | JPY |
| Monetary Base Y/Y May | |
| Consensus | -9.50% |
| Previous | -11.30% |
| 01:30 | AUD |
| Current Account (AUD) Q1 | |
| Consensus | -22.8B |
| Previous | -21.1B |
| 01:30 | AUD |
| Building Permits M/M Apr | |
| Consensus | -1.50% |
| Previous | -10.50% |
| 08:30 | GBP |
| Mortgage Approvals Apr | |
| Consensus | 62K |
| Previous | 64K |
| 08:30 | GBP |
| M4 Money Supply M/M Apr | |
| Consensus | 0.60% |
| Previous | 0.80% |
| 09:00 | EUR |
| Eurozone CPI Y/Y May P | |
| Consensus | 3.20% |
| Previous | 3.00% |
| 09:00 | EUR |
| Eurozone Core CPI Y/Y May P | |
| Consensus | 2.40% |
| Previous | 2.20% |
Wednesday, Jun 3, 2026
| GMT | Ccy | Events | Cons | Prev |
|---|---|---|---|---|
| 22:45 | NZD | Building Permits Apr | -1.30% | |
| 22:45 | NZD | Terms of Trade Index Q1 | -2.00% | 3.70% |
| 00:30 | JPY | Services PMI May F | 50 | 50 |
| 01:30 | AUD | GDP Q/Q Q1 | 0.50% | 0.80% |
| 01:45 | CNY | RatingDog Services PMI May | 52.3 | 52.6 |
| 07:50 | EUR | France Services PMI May F | 42.9 | 42.9 |
| 07:55 | EUR | Germany Services PMI May F | 47.8 | 47.8 |
| 08:00 | EUR | Eurozone Services PMI May F | 46.4 | 46.4 |
| 08:30 | GBP | Services PMI May F | 47.9 | 47.9 |
| 09:00 | EUR | Eurozone PPI M/M Apr | 0.40% | 3.40% |
| 09:00 | EUR | Eurozone PPI Y/Y Apr | 4.80% | 2.10% |
| 12:15 | USD | ADP Employment Change May | 110K | 109K |
| 12:30 | CAD | Labor Productivity Q/Q Q1 | 0.70% | -0.10% |
| 13:45 | USD | Services PMI May F | 50.9 | 50.9 |
| 14:00 | USD | ISM Services PMI May | 53.6 | 53.6 |
| 14:00 | USD | Factory Orders M/M Apr | 4.60% | 1.50% |
| 14:30 | USD | Crude Oil Inventories (May 29) | -2.9M | -3.3M |
| 18:00 | USD | Fed's Beige Book |
| 22:45 | NZD |
| Building Permits Apr | |
| Consensus | |
| Previous | -1.30% |
| 22:45 | NZD |
| Terms of Trade Index Q1 | |
| Consensus | -2.00% |
| Previous | 3.70% |
| 00:30 | JPY |
| Services PMI May F | |
| Consensus | 50 |
| Previous | 50 |
| 01:30 | AUD |
| GDP Q/Q Q1 | |
| Consensus | 0.50% |
| Previous | 0.80% |
| 01:45 | CNY |
| RatingDog Services PMI May | |
| Consensus | 52.3 |
| Previous | 52.6 |
| 07:50 | EUR |
| France Services PMI May F | |
| Consensus | 42.9 |
| Previous | 42.9 |
| 07:55 | EUR |
| Germany Services PMI May F | |
| Consensus | 47.8 |
| Previous | 47.8 |
| 08:00 | EUR |
| Eurozone Services PMI May F | |
| Consensus | 46.4 |
| Previous | 46.4 |
| 08:30 | GBP |
| Services PMI May F | |
| Consensus | 47.9 |
| Previous | 47.9 |
| 09:00 | EUR |
| Eurozone PPI M/M Apr | |
| Consensus | 0.40% |
| Previous | 3.40% |
| 09:00 | EUR |
| Eurozone PPI Y/Y Apr | |
| Consensus | 4.80% |
| Previous | 2.10% |
| 12:15 | USD |
| ADP Employment Change May | |
| Consensus | 110K |
| Previous | 109K |
| 12:30 | CAD |
| Labor Productivity Q/Q Q1 | |
| Consensus | 0.70% |
| Previous | -0.10% |
| 13:45 | USD |
| Services PMI May F | |
| Consensus | 50.9 |
| Previous | 50.9 |
| 14:00 | USD |
| ISM Services PMI May | |
| Consensus | 53.6 |
| Previous | 53.6 |
| 14:00 | USD |
| Factory Orders M/M Apr | |
| Consensus | 4.60% |
| Previous | 1.50% |
| 14:30 | USD |
| Crude Oil Inventories (May 29) | |
| Consensus | -2.9M |
| Previous | -3.3M |
| 18:00 | USD |
| Fed's Beige Book | |
| Consensus | |
| Previous | |
Thursday, Jun 4, 2026
| GMT | Ccy | Events | Cons | Prev |
|---|---|---|---|---|
| 01:30 | AUD | Trade Balance (AUD) Apr | -1.61B | -1.84B |
| 06:30 | CHF | CPI M/M May | 0.30% | 0.30% |
| 06:30 | CHF | CPI Y/Y May | 0.80% | 0.60% |
| 07:00 | CHF | Unemployment Rate M/M May | 3.00% | 3.00% |
| 08:30 | GBP | Construction PMI May | 40.1 | 39.7 |
| 10:00 | EUR | Eurozone Retail Sales M/M Apr | -0.30% | -0.10% |
| 12:30 | USD | Initial Jobless Claims (May 29) | 211K | 215K |
| 12:30 | USD | Nonfarm Productivity Q1 | 0.70% | 0.80% |
| 12:30 | USD | Unit Labor Costs Q1 | 2.40% | 2.30% |
| 14:30 | USD | Natural Gas Storage (May 29) | 99B | 92B |
| 01:30 | AUD |
| Trade Balance (AUD) Apr | |
| Consensus | -1.61B |
| Previous | -1.84B |
| 06:30 | CHF |
| CPI M/M May | |
| Consensus | 0.30% |
| Previous | 0.30% |
| 06:30 | CHF |
| CPI Y/Y May | |
| Consensus | 0.80% |
| Previous | 0.60% |
| 07:00 | CHF |
| Unemployment Rate M/M May | |
| Consensus | 3.00% |
| Previous | 3.00% |
| 08:30 | GBP |
| Construction PMI May | |
| Consensus | 40.1 |
| Previous | 39.7 |
| 10:00 | EUR |
| Eurozone Retail Sales M/M Apr | |
| Consensus | -0.30% |
| Previous | -0.10% |
| 12:30 | USD |
| Initial Jobless Claims (May 29) | |
| Consensus | 211K |
| Previous | 215K |
| 12:30 | USD |
| Nonfarm Productivity Q1 | |
| Consensus | 0.70% |
| Previous | 0.80% |
| 12:30 | USD |
| Unit Labor Costs Q1 | |
| Consensus | 2.40% |
| Previous | 2.30% |
| 14:30 | USD |
| Natural Gas Storage (May 29) | |
| Consensus | 99B |
| Previous | 92B |
Friday, Jun 5, 2026
| GMT | Ccy | Events | Cons | Prev |
|---|---|---|---|---|
| 23:30 | JPY | Labor Cash Earnings Y/Y Apr | 3.20% | 2.70% |
| 23:30 | JPY | Overall Household Spending Y/Y Apr | -1.40% | -2.90% |
| 05:00 | JPY | Leading Economic Index Apr P | 114.3 | 114 |
| 07:00 | CHF | Foreign Currency Reserves (CHF) May | 716B | |
| 09:00 | EUR | Eurozone GDP Q/Q Q1 F | 0.10% | 0.10% |
| 12:30 | USD | Nonfarm Payrolls May | 85K | 115K |
| 12:30 | USD | Unemployment Rate May | 4.30% | 4.30% |
| 12:30 | USD | Average Hourly Earnings M/M May | 0.30% | 0.20% |
| 12:30 | CAD | Net Change in Employment May | 10.2K | -17.7K |
| 12:30 | CAD | Unemployment Rate May | 6.90% | 6.90% |
| 14:00 | CAD | Ivey PMI May | 55 | 57.7 |
| 23:30 | JPY |
| Labor Cash Earnings Y/Y Apr | |
| Consensus | 3.20% |
| Previous | 2.70% |
| 23:30 | JPY |
| Overall Household Spending Y/Y Apr | |
| Consensus | -1.40% |
| Previous | -2.90% |
| 05:00 | JPY |
| Leading Economic Index Apr P | |
| Consensus | 114.3 |
| Previous | 114 |
| 07:00 | CHF |
| Foreign Currency Reserves (CHF) May | |
| Consensus | |
| Previous | 716B |
| 09:00 | EUR |
| Eurozone GDP Q/Q Q1 F | |
| Consensus | 0.10% |
| Previous | 0.10% |
| 12:30 | USD |
| Nonfarm Payrolls May | |
| Consensus | 85K |
| Previous | 115K |
| 12:30 | USD |
| Unemployment Rate May | |
| Consensus | 4.30% |
| Previous | 4.30% |
| 12:30 | USD |
| Average Hourly Earnings M/M May | |
| Consensus | 0.30% |
| Previous | 0.20% |
| 12:30 | CAD |
| Net Change in Employment May | |
| Consensus | 10.2K |
| Previous | -17.7K |
| 12:30 | CAD |
| Unemployment Rate May | |
| Consensus | 6.90% |
| Previous | 6.90% |
| 14:00 | CAD |
| Ivey PMI May | |
| Consensus | 55 |
| Previous | 57.7 |
Week Ahead – NFP Report and Eurozone CPI to Test US-Iran Optimism
- Elusive US-Iran deal keeps inflation fears alive amid resilient risk appetite.
- US jobs data to take spotlight as hawkish Fed soundbites grow.
- Eurozone flash CPI to be eyed too as ECB preps for June rate hike.
- But will the yen steal the show as it re-enters 160 zone?
US-Iran Drama Keeps Traders Gripped
It’s been seven weeks since the US and Iran agreed to a ceasefire and engage in talks aimed at negotiating a permanent deal that not just ends the hostilities and reopens the Hormuz Strait but also resolves the long-standing nuclear issue.
Under any circumstances, reaching such a deal would be quite a feat. Hence, it shouldn’t come as too much of a surprise that negotiations are ongoing and there are still significant differences that need to be bridged. However, investors were led to believe that a deal was imminent.
That hasn’t turned out to be the case, and instead, the barrage of missile and drone attacks has switched to a barrage of headlines about the diplomatic push. What’s most unusual, though, is that aside from oil prices, market volatility has been steadily declining during this time, even as traders grapple with making sense of Trump’s daily commentary and conflicting reports from various Iranian sources about where the talks stand.
Yet, the most critical issue for the global economy – the Strait of Hormuz – remains at a stalemate, therefore, there’s been no downgrading of the severity of the ensuing energy crisis. It’s somewhat unnerving that markets even seem to enjoy the US-Iran drama. Surely, a Netflix limited series where the finale has already been recorded would have been the preferable scenario to what seems to be a never-ending soap opera.
Are investors being fooled into believing that a deal is around the corner? Is there a risk of a reality check? Probably, but there would have to be a very big escalation for markets to sit up and take notice, as the recent days’ skirmishes have barely lifted an eyelid, at least in equity markets, where the AI boom has driven Wall Street to new record highs. Perhaps that would change if the incoming economic data continues to bolster rate hike expectations for the Fed and other major central banks.
Will NFP and ISM PMIs Spark Much Reaction?
Certainly, next Friday’s nonfarm payrolls report has the capacity to shift market expectations, as a softish labour market is the Fed’s only excuse to still keep the option of a rate cut on the table. Recent NFP data have been mixed, as either contrasting jobless rate readings or revisions to prior figures have offset the initial reaction to the headline payrolls prints.
For May, analysts expect jobs gains of 96k versus 115k in April. The unemployment rate is forecast to have stayed unchanged at 4.3%, while average hourly earnings growth likely accelerated slightly on a month-on-month basis to 0.3%.
Ahead of the jobs report, the ISM manufacturing and services PMIs will be watched closely on Monday and Wednesday, respectively. Any uptick in the price indices could stoke inflation fears. But of course, the impact would be limited if the employment indices moved in the opposite direction.
Other US releases include the JOLTS job openings for April on Tuesday, factory orders and the ADP employment report on Wednesday, and the Challenger Layoffs for May on Thursday.
A broadly strong set of numbers would weaken the case for the Fed to maintain its easing bias at its June 16-17 gathering, likely creating a dilemma for new chair Kevin Warsh’s first meeting.
For the dollar, however, investors will continue to balance geopolitical risks with rate hike bets, which have moderated slightly on the hope that a US-Iran agreement is near.
Euro Awaits CPI Data Ahead of Expected Hike
In the euro area, traders are already bracing for the first rate hike since September 2023. The signals from ECB policymakers have been getting louder and so the focus is now turning to the pace of increases thereafter rather than the June decision itself. Tuesday’s flash CPI estimates for May will be the last major update from the bloc before the meeting and therefore vital to the decision.
Headline CPI jumped to 3.0% y/y in April – the highest, coincidentally, since September 2023. The core measure that excludes food, energy, tobacco and alcohol eased slightly to 2.2% y/y. If core CPI remains near 2.0%, the European Central Bank will likely be hesitant about flagging a steep rate-hike path, potentially weighing on the euro.
However, it’s also possible the euro could gain from softer-than-expected inflation figures, as a less aggressive ECB would reduce the risk of stagflation and improve the Eurozone outlook somewhat.
In fact, the euro may be more likely to come under pressure from much hotter-than-forecast inflation readings or a major flareup in the Middle East that fuel concerns about a recession.
Aussie’s and Loonie’s Paths Diverge
The energy crisis has had unexpected effects on two key commodity currencies. Oil-exporting Canada has seen the loonie depreciate marginally against the US dollar, while resources-rich Australia has experienced unusual resilience in the risk-sensitive aussie.
Canada’s faltering jobs market and relatively lower inflation as opposed to Australia’s more robust economy and 4%+ inflation have something to do with that. Although Australia is heavily dependent on fuel imports for transportation, it doesn’t need as much for electricity generation, while its exports of resources and minerals have been benefiting from the AI boom. The Canadian economy, on the other hand, has the ongoing trade dispute with Trump and the renegotiation of USMCA hanging over its head, countering some of the effects of higher oil prices.
More to the point, the Reserve Bank of Australia is already on a rate-hiking path, but the Bank of Canada has yet to embark on one. Investors don’t anticipate the BoC to begin raising interest rates before October. If Friday’s employment numbers for May disappoint, the timing could be pushed further back into the year.
The RBA, however, is expected to resume rate hikes in August following its well-telegraphed pause in June. First quarter GDP estimates due on Wednesday are unlikely to greatly change the rate outlook but a strong performance right before the start of the Iran war would nevertheless give the RBA less reason to be cautious.
Aussie traders will also be keeping an eye out on May manufacturing PMIs for China, with both the official and S&P Global versions due on Monday.
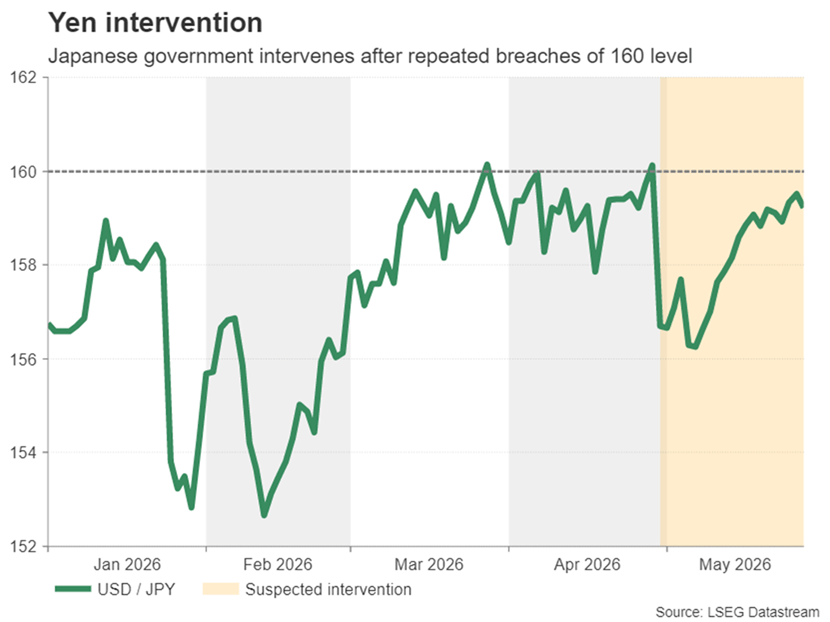
Is Fresh Yen Intervention on the Cards?
In Japan, government energy subsidies have helped to bring down inflation during the Middle East conflict, although this hasn’t stopped the Bank of Japan from acknowledging that underlying price pressures are growing, not just from the energy shock, but also from higher wage growth.
Cash earnings data out on Friday will offer an update on the BoJ’s progress in achieving sustained wage growth. Household spending data will also be watched the same day.
But it’s questionable whether any upside surprises will be able to boost the yen. The recent more hawkish rhetoric from the BoJ hasn’t been able to prevent the yen from returning to the 160-intervention zone. BoJ policymakers continue to play it safe with their forward guidance, refraining from committing to multiple rate hikes, while the ongoing geopolitical risks have exposed Japan’s overreliance on the Middle East for its energy needs.
With the dollar back above 159 yen this week, the Japanese government may be compelled to intervene again in the coming days if the 160 level is breached.
Weekly Focus – Optimism Around Iran Deal Lifts Market Sentiment
Oil markets have stabilised lower for now and global equity markets have rallied this week on the back of renewed optimism around a deal in the Middle East. On Thursday afternoon, media reports emerged that the US and Iranian negotiators had settled on a Memorandum of Understanding (MOU) that would extend the ceasefire by 60 days, allow renewed talks on Iran's nuclear program and enable a gradual reopening of the Strait of Hormuz (SOH). The deal is still pending US President's approval, and Iranian officials have not confirmed media reports. According to US Treasury Scott Bessent Donald Trump's three "red lines" - reopening the Strait, Iran surrendering highly enriched uranium and ending its nuclear program - remain prerequisites for any agreement.
It appears the two sides are negotiating in good faith and there is indeed strong momentum towards a deal. The devil is in the details, however. The US forces and the IRGC have continued to clash this week, underlining the fragility of the current ceasefire and perhaps signalling that there is also growing impatience on both sides as the talks drag on. We think one of the key sticking points for a deal is the SOH issue. If the US ends its blockade of Iranian ports in exchange for Iran allowing more traffic via the strait, the US also effectively forgoes much of its leverage for the upcoming complex nuclear talks. It is unrealistic to expect that an initial MoU would be able to address all the specifics of Iran's nuclear program, and more likely that those talks would take time.
We do think it is possible that a compromise can be found in several other issues - such as those related to Iran's frozen assets, sanctions and even the issue of the highly enriched uranium. Yet, an agreement on these issues hinges on the two sides finding common ground on Iran's overall ambitions regarding the nuclear program and its ambitions in maintaining a role in the governance of the SOH. As Iranian officials have put it, nothing is agreed until everything is agreed on.
As markets are increasingly optimistic that traffic volumes in the SOH could start normalising soon, Brent oil price has stabilised below USD 100 level this week. Short-term inflation expectations, as well as central bank rate pricing, have fallen in tandem. For the ECB, the market remains convinced that they will hike rates by 25bp in June. The April meeting minutes confirmed this view, and we agree. But the timing for the next hike is more uncertain. We still think the ECB could move already in July especially if there is no deal in the Middle East, but risks are skewed towards a hike later in the autumn. For the Fed, we updated our call recently and now expect them to hike in December, followed by a hike in March next year. Economic growth in the US has surprised on the upside recently, underlying price pressures are building up and due to lower labour supply growth going forward, the economy is more prone to overheating than before.
Next week, focus will remain in the Middle East. Over the weekend, we will get official May PMIs from China, followed by the private RatingDog releases for manufacturing PMI on Monday and services on Wednesday. There has been some divergence lately with the private releases being stronger. On Tuesday, all eyes will be on the EA flash inflation print for May. In the US, key data points will be the ISM releases on Monday and Wednesday, as well as labour market data throughout the week.
Sunset Market Commentary
Markets
The euro zone’s four largest countries today released May inflation numbers. On a monthly basis, the pace slowed but most annual numbers rose further. French inflation increased by 0.1% M/M to 2.8% Y/Y (from 2.5%; highest since February 2024). Spanish inflation moved at the same monthly pace but hit 3.6% Y/Y (from 3.5%; second highest since May 2024). Italian prices rose by 0.4% M/M to 3.3% Y/Y (highest since September 2023). German inflation was exception to the rule with a 0.1% M/M-decline and a 2.7% Y/Y (from 2.9%) outcome. Overall, today’s numbers printed near consensus with our in-house KBC Nowcast model pointing to a 3.3% Y/Y reading (up from 3%) for the euro zone on Tuesday. That would be the highest reading since September 2023, moving further away from the ECB’s 2% inflation target. For goods, we expect Y/Y price growth to increase to 0.9%, driven by higher commodity prices. Despite a modest decline in price expectations (surveys), we expect services inflation to rise from 3% to 3.2%. Underlying core CPI is expected to pick up from 2.2% to 2.4%. Today’s numbers and more ECB comments further cement the case for a June 25 bps rate hike. Italian ECB Panetta, usually a dovish profile, said that the outlook seems to call for a rate recalibration to counter the risk of persistent inflationary tensions. More an more governors also point to depleted fuel stocks and rising price expectations as reasons to hike rates. The depleted stocks argument fits with the narrative that we’re just at the end of the beginning of the energy crisis, even if the US and Iran reach some kind of interim agreement. ECB Simkus is the first to look beyond the June meeting, at which he’ll likely support a rate hike. He argues that a second rate hike is more likely than not, but didn’t elaborate on the timing of such move (back-to-back or together with the September Monetary Policy Report?). EMU money markets currently prefer the second option. In our view, if the crisis persists, back-to-back seems to be the more likely and better path to follow.
Overall trading was muted today in anticipation of US President Trump’s (dis)approval of the interim deal. Brent crude hovers around $92/b. Daily changes on core bond yield curves are confined to 1 bp with UK gilts slightly outperforming after BoE governor Bailey said that the central bank can temporarily tolerate higher inflation. EUR/USD treads water near 1.1650. Stock markets have a guarded positive bias.
News & Views
The Swiss Kof economic barometer improved marginally in May from 97.8 to 98. After a sharp drop in March, the index already improved last month. Even so, the outlook for the Swiss economy remains muted as the index remains below its medium term average. Different bundles in the indicator showed mixed developments. On the production side, indicators for manufacturing are particularly under pressure but this is cushioned by a positive outlook in the indicators for financial and insurance services. On the demand side, the indicators for foreign demand are reported the show more favourable developments, but indicators on private consumption experience a setback. After strengthening to the EUR/CHF 0.90 area at the start of the conflict in the Middle East, the franc from mid-March weakened to settle in a relatively tight range roughly between EUR/CHF 0.90 and EUR/CHF 0.925 (currently 0.9125) as the Swiss National Bank warned that it has a greater willingness to intervene in the FX market as necessary to execute its inflation policy. The next SNB monetary policy decision will be released on June 18.
Swedish GDP decreased by 0.2% Q/Q (+2.0% Y.Y) in Q1. Inventories (0.8% positive contribution) and household consumption (+0.6% growth) were the main positives. Gross fixed capital formation dropped 2.3% Q/Q, driven by declines for investments in buildings and constructions. General government consumption decreased by 7.6%. Net exports also contributed negatively (-0.1%) as exports rose 2.2% while imports grew 2.5%. The head of the national accounts commented that the decline in Q1 followed large increases in central government expenditure in the preceding quarter (overall growth in Q4 2025 was 0.8% Q/Q). In a supply side approach, value added in the business sector decreased 0.2% as added value in goods-producing rose 1.1% , but with a 0.8% decrease in services producing industries. Government value added fell by 0.2%. Even as solid household consumption is a positive, today’s mixed growth report supports the Riksbanks’ assessment that “there is scope to wait until there is a clearer picture of the effects of the war and the supply shocks it entails (May policy decision)”.The Riksbank has its next policy meeting on June 17. Markets discount no rate move at that meeting. For August about 75% of a 25 bps rate hike is discounted. After a protracted decline in the February/early April period, the krone recently regained its composure with EUR/SEK since mid-May easing from 11.00 to currently trad near 10.78.
Canada’s GDP Stalls in Q1 amid Import Surge and Weak Domestic Demand
The Canadian economy was essentially flat in Q1 2026 (-0.1% q/q annualized), coming in below both the consensus forecast (1.5% q/q) and the Bank of Canada’s 1.5% projection. Weakness reflected a sharp rise in imports, which offset a sizable inventory restocking, while underlying domestic demand was soft, with final domestic demand declining 0.4% q/q annualized.
Consumer spending grew 1.5% q/q (annualized) in Q1, easing from 2.9% in Q4. The gain was driven by services (+2.0%), while goods spending was much weaker (+0.7%), with declines in durable goods partially offset by gains in non-durables.
Residential investment declined 7.9% q/q (annualized), marking another weak quarter. The pullback was led by a sharp drop in ownership transfer costs (-9.9% q/q), alongside a small decline in new construction (-0.1%), reflecting slow resale activity and softer housing turnover.
Non-residential structures, equipment and machinery investment fell 3.2% q/q (annualized). A steep decline in engineering structures (-4.6% q/q) outweighed gains in machinery and equipment (+2.5%). Intellectual property products investment rose a healthy +13.8%.
Government spending declined modestly, with overall consumption down 1.0% q/q (annualized) and government investment dropping 9.6% q/q annualized, reversing the very strong gains seen in Q4 (24.6%). The pullback reflected lower investment in weapons systems following elevated levels late last year.
Net trade was a significant drag on growth. Exports fell 0.5% q/q (annualized) while imports surged 12.0%, driven in part by gold imports. As a result, net trade subtracted materially from GDP, more than offsetting the positive contribution from inventories.
On the monthly side, March industry GDP reported a 0.1% month-on-month (m/m) decline, while April's flash estimate points to a significant bounce-back (+0.4% m/m) to start Q2. On the industry side, GDP growth was +0.5% q/q in Q2 (annualized).
Key Implications
Well, that's certainly a disappointing report. The surge in first quarter imports was expected to drag on growth, but with residential investment, government spending and non-residential structures investment all posting contractions, there was no room for growth. That said, the wedge between the industry and expenditure measures of GDP, together with the strong flash estimate for April, suggest that growth should bounce back in the second quarter.
The disappointing first quarter figure likely overstates the weakness in the economy as net trade remains noisy and materially subtracted from first quarter growth. Domestic demand growth posted a small contraction but has vacillated between growth and small contractions since late 2024. Looking to Q2, some bounce-back should be expected. Nonetheless, the Canadian economy continues to operate well below capacity, posting a contraction in Q4 and no growth in Q1 – flirting with a technical recession. This suggests that ample slack remains, providing some offset to the inflationary forces coming from the energy shock. Our view remains that as the economy continues to operate below capacity, and if the inflation shock fades, the Bank of Canada will remain on the sidelines.
Stocks Celebrate Peace and AI Boom, FX Markets Stay More Cautious
Global markets are ending the week firmly in risk-on mode, but the enthusiasm is far from evenly distributed. Equity investors are aggressively embracing both AI-driven optimism and growing hopes that the United States and Iran are moving closer to a formal agreement extending the current ceasefire. Reports that negotiators have drafted a 60-day memorandum of understanding, including provisions to reopen the Strait of Hormuz and normalize Iranian oil exports, have fueled another leg lower in oil prices. Brent crude is now approaching the key $90 support level as traders increasingly price a normalization of global energy flows.
The biggest beneficiaries have been equity markets, particularly those tied to the AI theme. KOSPI and Nikkei surged to fresh record highs. Strong US futures suggest that S&P 500 and NASDAQ are going to extend their record-setting runs. European markets are participating in the rally too, but with considerably less enthusiasm. Investors appear to be focusing on the positive implications of lower energy costs, reduced shipping disruptions, and stronger technology demand. For stocks, the combination of peace optimism and AI investment is a powerful tailwind.
Foreign exchange markets, however, are telling a more nuanced story. Kiwi and Aussie are leading weekly performance tables, benefiting from the broader risk-on backdrop. New Zealand Dollar received an additional boost after senior RBNZ officials suggested today that not only is a July rate hike live, but policymakers could potentially consider a larger move if inflation risks continue to build. Aussie has also recovered despite softer domestic inflation data earlier in the week, suggesting investors remain comfortable holding cyclical currencies while risk appetite stays firm.
Yet the broader currency response remains remarkably restrained. Dollar has numerous reasons to weaken, including falling oil prices, easing geopolitical tensions, and record equity markets. Nevertheless, it is only modestly lower for the week and shows little sign of accelerating downside momentum. Part of the explanation is that FX traders remain more skeptical than equity investors about the durability of the peace process. Another factor is that recent inflation data and Fed commentary have significantly reduced expectations for policy easing, helping preserve Dollar's yield advantage.
Elsewhere, Swiss Franc outperforms despite easing geopolitical risks, reflecting expectations that lower oil prices could narrow inflation pressures and limit the need for tighter policy abroad. At the other end of the spectrum, Yen is the weakest performer of the week, though selling pressure remains surprisingly contained as traders remain wary of provoking intervention from Japanese authorities. Loonie is the second worst performer, dragged down by falling oil prices and disappointing Canadian GDP data.
The contrast between asset classes is apparent. Equity markets are pricing a future where diplomacy succeeds, oil prices normalize, and the AI investment boom continues uninterrupted. Currency markets appear far less willing to embrace that best-case scenario. For now, stocks are celebrating peace and technology, while FX traders continue to hedge against the possibility that the story may not unfold quite so smoothly.
Canada GDP Contracts in March, But Early April Rebound Signals Resilience
Canada's economy stumbled in March, but an estimated 0.4% rebound in April suggests the slowdown may not be lasting. Read More.
Fed's Schmid Warns Against Assuming Energy Shock Will Fade Quickly
Kansas City Fed President Jeffrey Schmid warned against assuming the energy-driven inflation shock will fade quickly, saying inflation remains too hot and policymakers must stay vigilant. Read More.
Bailey Pushes Back Against Rate Hike Expectations as BoE Waits for More Evidence
The BoE expects inflation to rise further, yet Bailey is signaling patience rather than preparing markets for tighter policy. Read More.
EUR/USD Stalls Below 1.1660 as Dollar Refuses to Break Despite US-Iran Ceasefire Extension
EUR/USD had every reason to break higher this week. Falling oil, peace optimism, and record stocks still were not enough to crack Dollar resilience. Read More.
Swiss KOF Barometer Edges Higher to 98.0, But Outlook Remains Subdued
Switzerland's KOF Barometer rose again in May, but weak manufacturing and softer consumer demand continue to cloud the outlook. Read More.
RBNZ Hints at Bigger Hikes as Kiwi Surge Accelerates: NZD/JPY and AUD/NZD Analysis
Hawkish RBNZ comments pushed Kiwi sharply higher, putting NZD/JPY near a major breakout and AUD/NZD under renewed pressure. Read More.
RBNZ Hawks Signal Rate Hikes Are Coming, July Meeting Now Live
Fresh comments from policymakers suggest the hurdle for a July rate hike may be lower than markets assume. The next six weeks of data could determine whether the RBNZ begins tightening soon. Read More.
New Zealand ANZ Business Confidence Turns Positive, Inflation Pressures Stay Contained
New Zealand business confidence jumped back into positive territory in May, while inflation and wage expectations eased despite ongoing economic uncertainty. Read More.
Tokyo Inflation Cools Further, But Strong Growth Data Keeps BoJ Normalization on Track
Tokyo inflation cooled for a sixth consecutive month, but stronger production, retail sales, and employment data suggest the BoJ's normalization path remains intact. Read More.
AUD/USD Daily Report
Range trading continues in AUD/USD and intraday bias stays neutral. On the upside, firm break of 0.7183 resistance will suggest that pullback from 0.7277 has completed. Stronger rally should then be seen to retest 0.7277 high. However, decisive break of 0.7076 will indicate that larger scale correction is underway and target 0.6832 support instead.
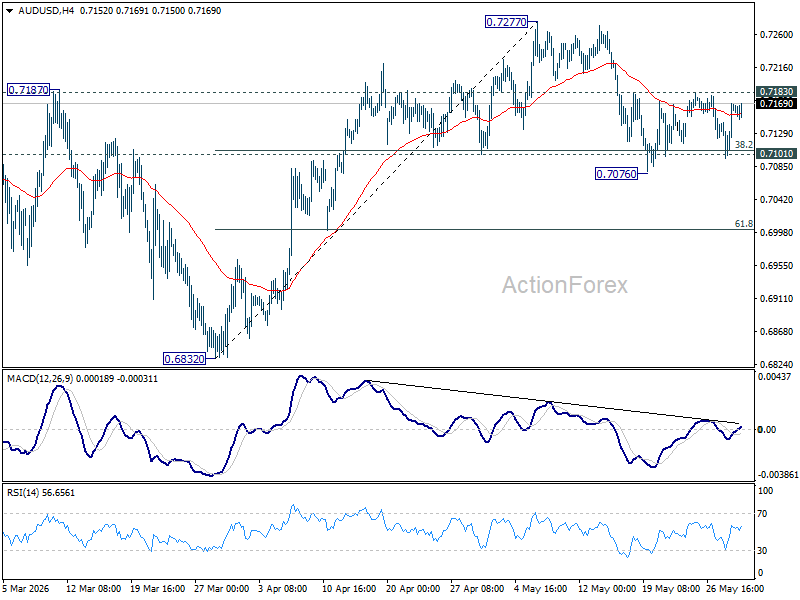
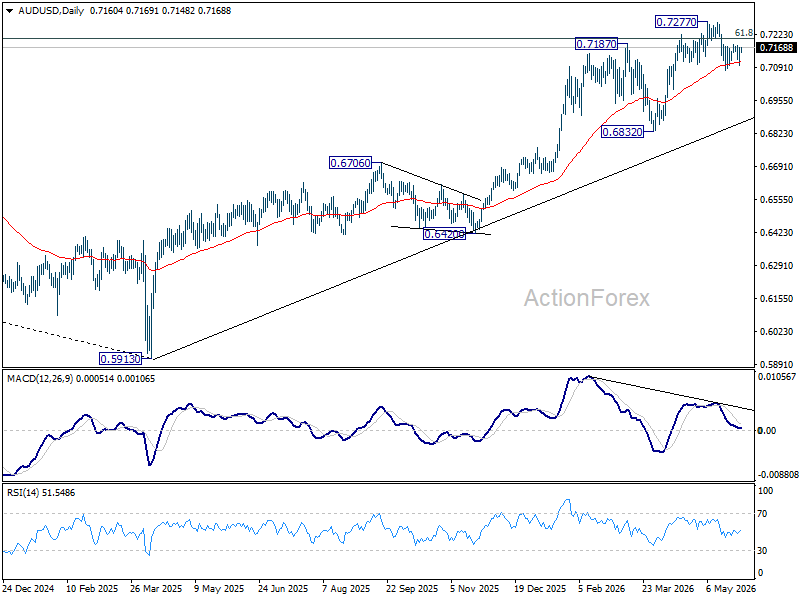
In the bigger picture, rise from 0.5913 (2024 low) is still in progress. Decisive break of 61.8% retracement of 0.8006 to 0.5913 at 0.7206 will solidify the case that it's already reversing the down trend from 0.8006 (2021 high). Further rally should then be seen to retest 0.8006. For now, outlook will remain bullish as long as 0.6832 support holds, in case of pullback.
Canada GDP Contracts in March, But Early April Rebound Signals Resilience
Canada's economy unexpectedly contracted by -0.1% mom in March, missing expectations for a 0.1% expansion and partially reversing February's 0.2% gain. The weakness was concentrated in goods-producing industries, which fell -0.8% and recorded their fifth decline in the past six months.
Lower activity in mining, quarrying, oil and gas extraction, as well as construction, accounted for much of the pullback. Services-producing industries provided some support, edging up 0.1% on stronger wholesale trade, but the gains were not enough to offset the broader weakness, with 8 of 20 industrial sectors posting declines.
The disappointing March figure capped a sluggish first quarter, with real GDP unchanged after a -0.2% contraction in Q4. Meanwhile, GDP per capita rose 0.2% qoq as Canada's population declined for a second consecutive quarter.
There was also a more encouraging signal from the start of Q2. Statistics Canada's advance estimate points to a 0.4% increase in April GDP, driven by gains in mining, oil and gas extraction, manufacturing, and transportation and warehousing. While some sectors, including agriculture and forestry, remained weak, the early rebound suggests March's contraction may prove temporary rather than the start of a broader downturn.
| Indicator | Previous | Actual | Expected |
|---|---|---|---|
| March GDP (MoM) | 0.2% | -0.1% | 0.1% |
| April GDP (Advance Estimate) | -0.1% | 0.4% | |
| Q1 GDP (QoQ) | -0.2% (Q4) | 0.0% | |
| GDP Per Capita (QoQ) | N/A | 0.2% |
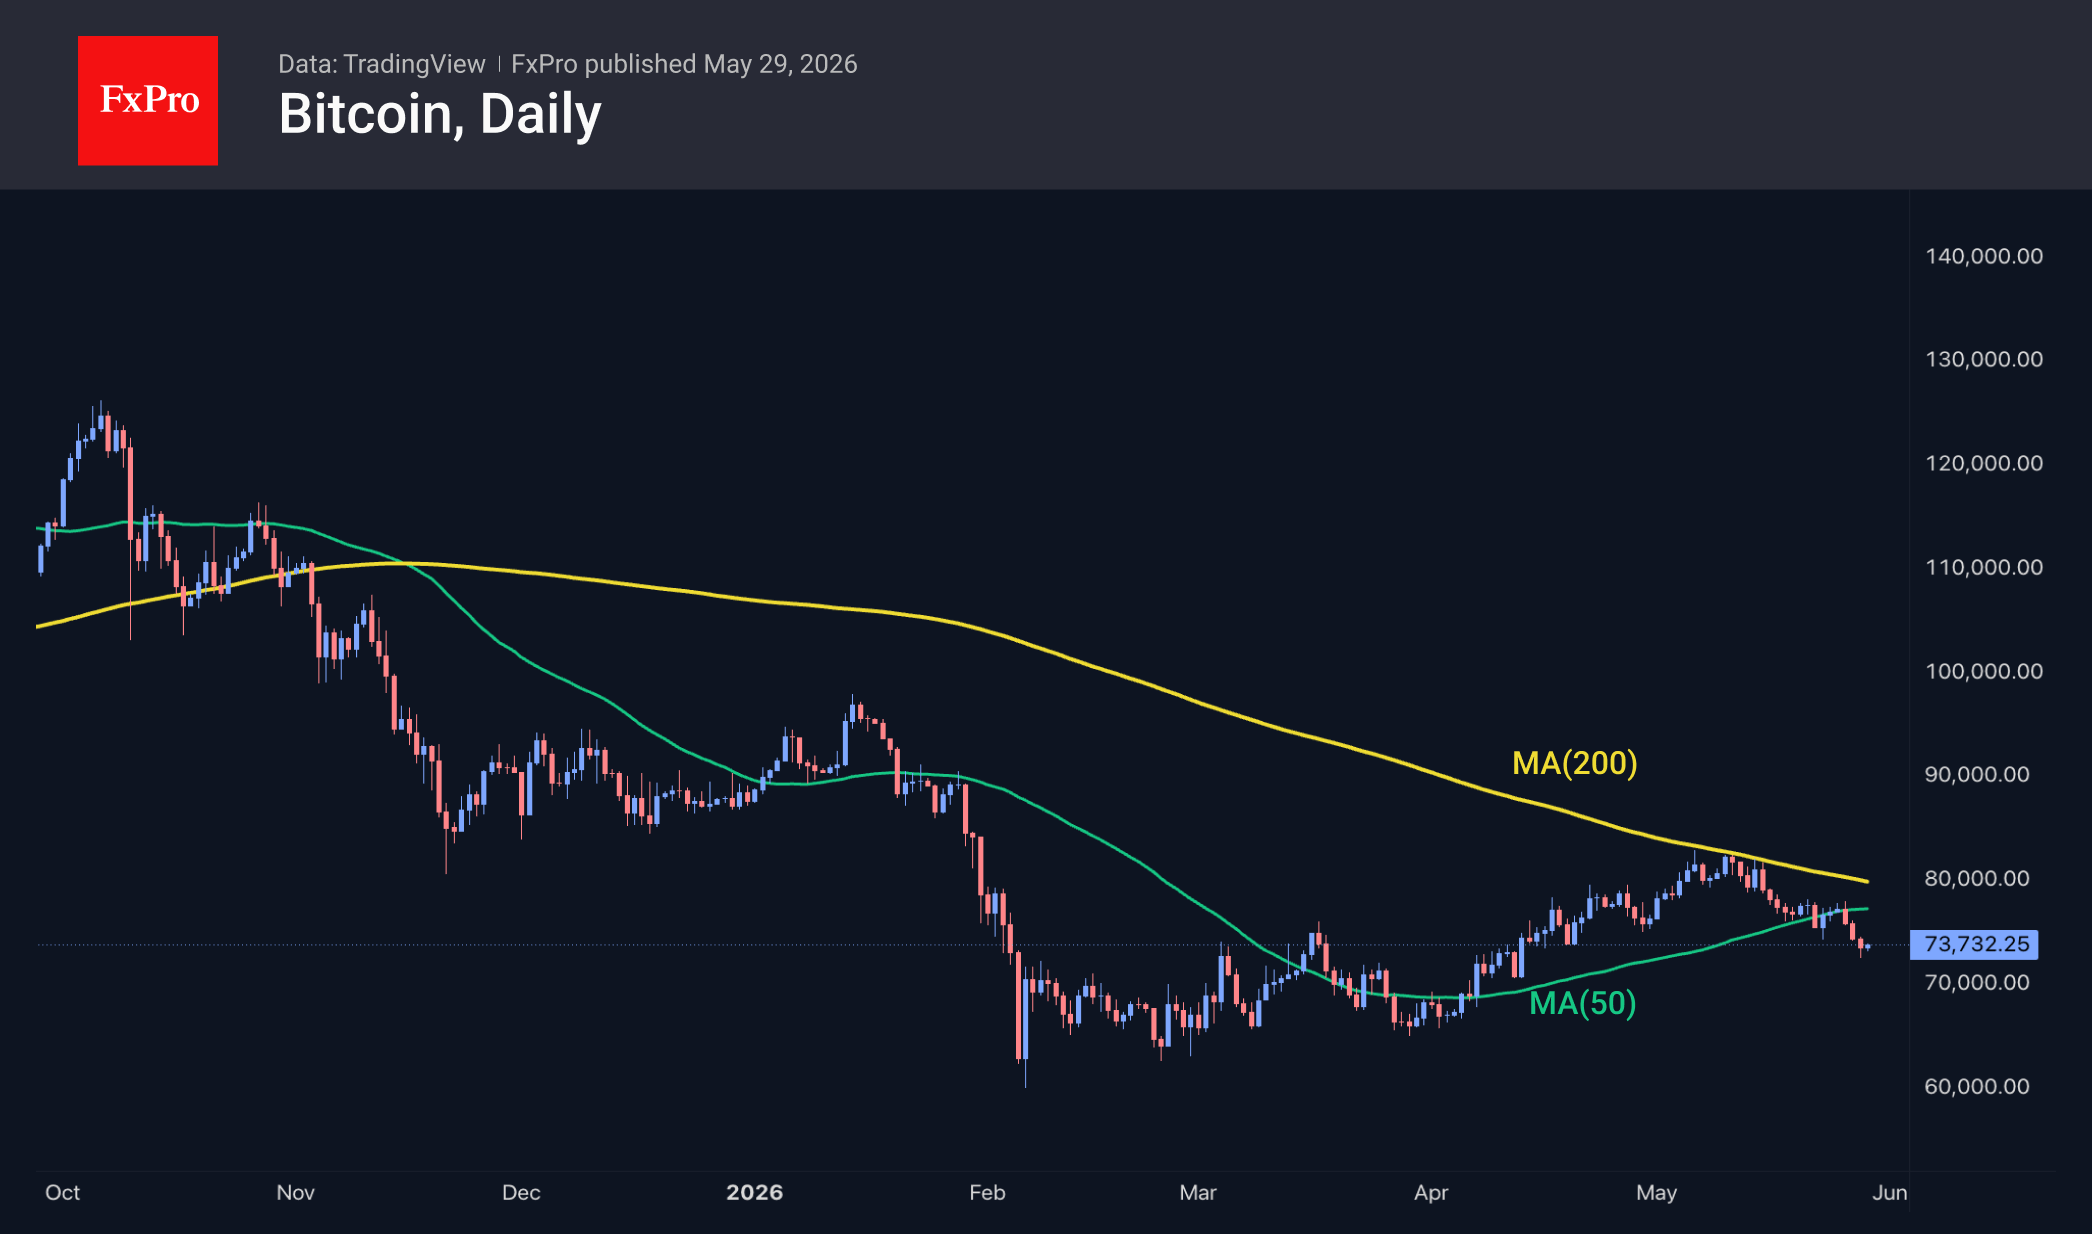
Crypto: Just Enough Optimism to Halt the Decline
Market Overview
The crypto market capitalisation rose by 1% over the past 24 hours, rebounding from the local lows reached the previous day, thanks to a shift towards riskier assets. However, the cryptocurrency market remains 10% below its local peak in early May and 43% below its global peak in October last year. By comparison, over the same period, the Nasdaq 100 gained 4% and 21% respectively, challenging the notion of a direct correlation between these indices. This by no means indicates widespread negativity, as over the past 24 hours Stellar has gained 23%, IOTA 13% and Algorand 10%, whilst the worst-performing coins among those actively traded were Bitcoin Cash (-6.3%), Tron (-3.3%) and Filecoin (-2%).
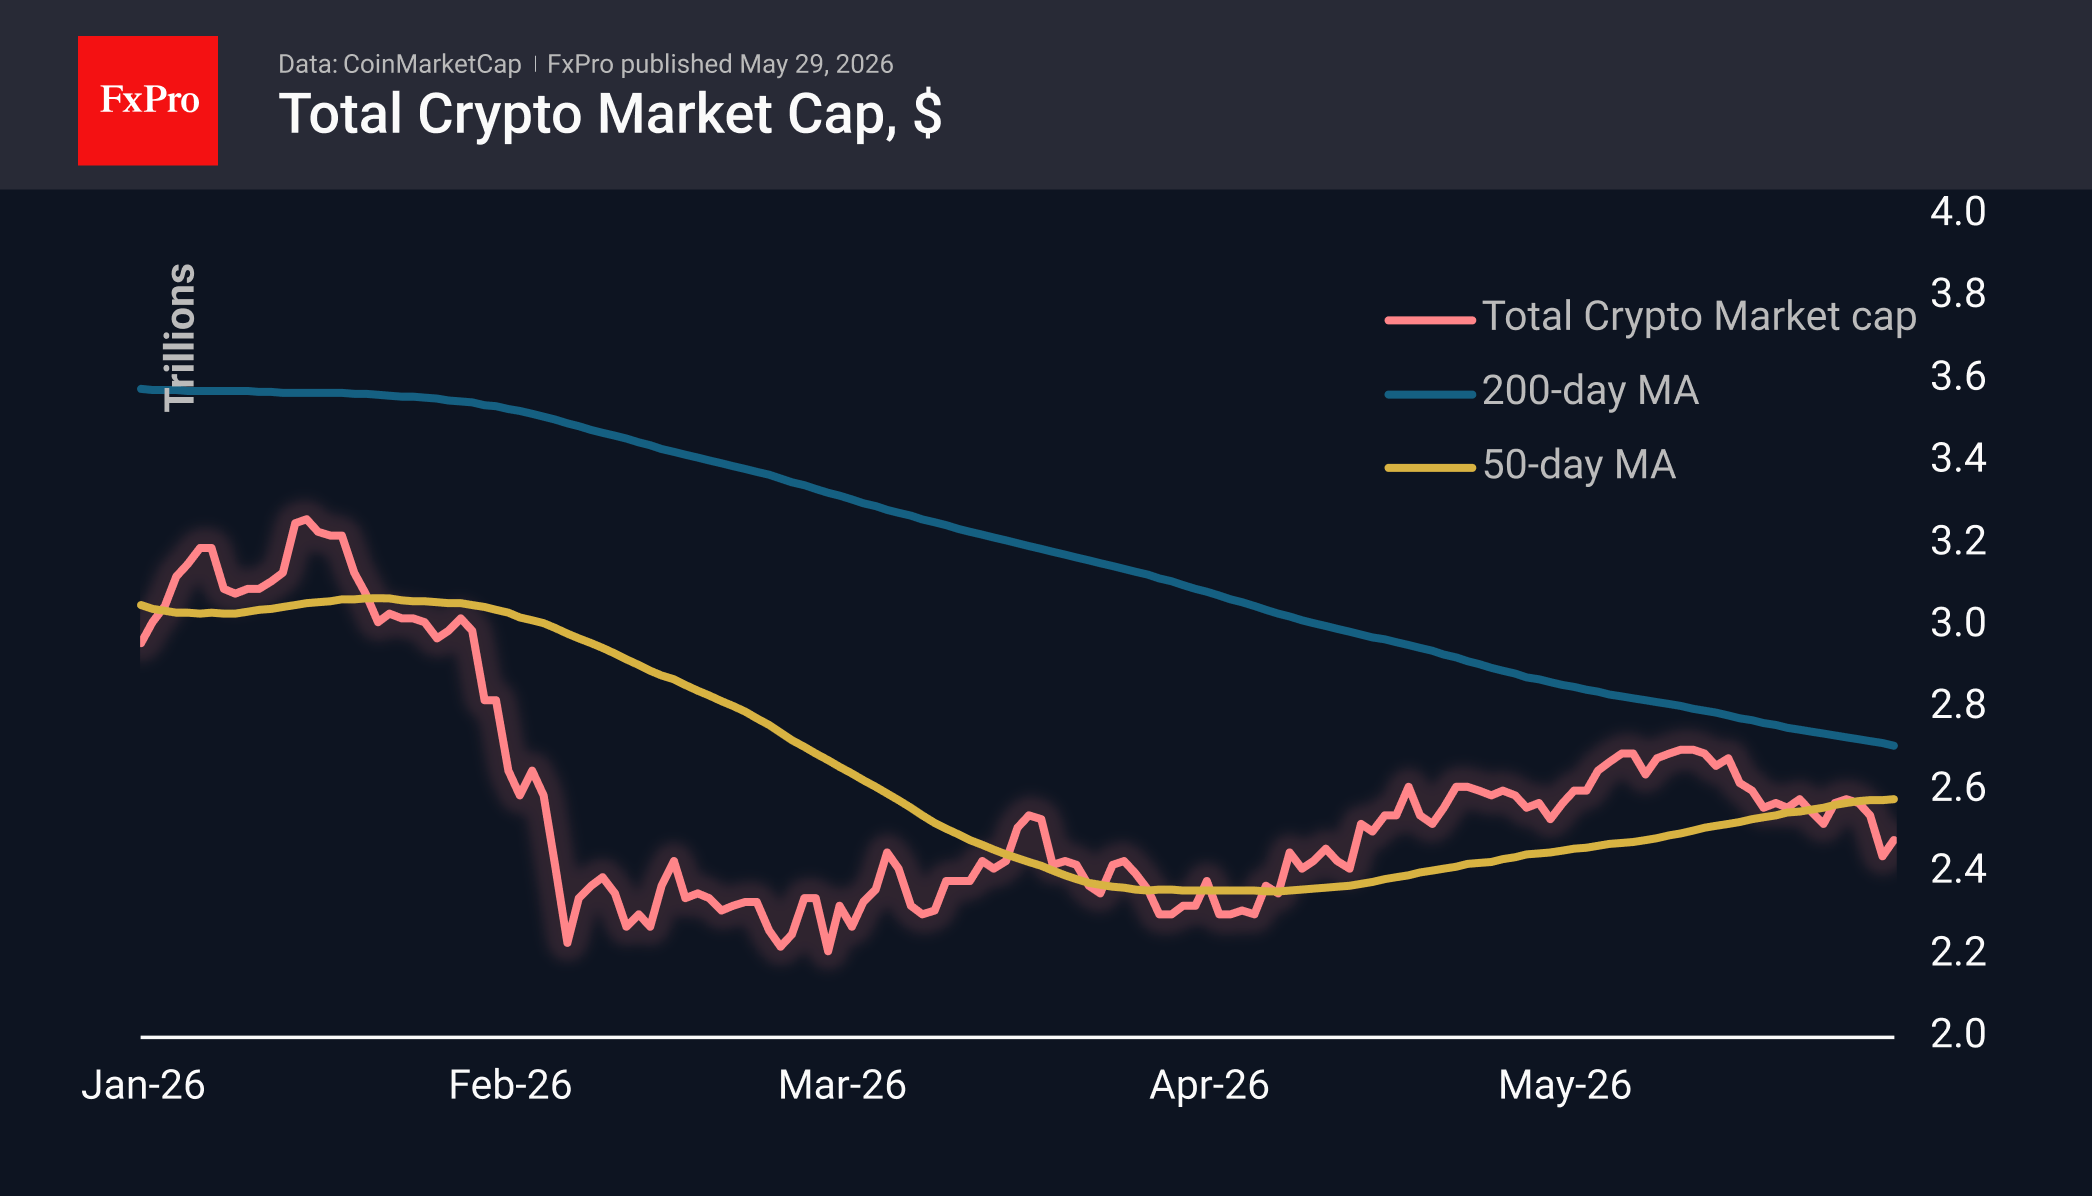
Bitcoin dipped below $73K on Thursday and is trading just above that level at the start of Friday. Weak performance against a backdrop of record highs in equities points to underlying demand weakness, entirely consistent with reports of outflows from institutional investors. Technicals are also on the sellers’ side, who are continuing to recoup the failure below the 50-day moving average following the failed attempt to breach the 200-day moving average earlier in May. Such buyer apathy keeps the possibility of a decline to the $65-67K range as the main scenario.
News Background
Bitcoin could fall to $60K by October, and only then will a new bullish trend begin, according to analyst Benjamin Cowen. In his view, the market is still moving within the framework of the ‘historical model’ of a four-year cycle, despite the launch of ETFs and growing demand from large investors.
The cryptocurrency industry is not ready for the transition to post-quantum cryptography, despite progress in post-quantum cryptography, according to developers at Quantus. They estimate that a direct transition to post-quantum signatures without changes to the BTC network architecture would drastically reduce the number of transactions per block.
According to Arkham Intelligence, US authorities have transferred altcoins totalling around $1.9 million to Coinbase Prime, the largest US crypto exchange. The Department of Justice may sell off altcoins before Bitcoin, as it considers BTC a reserve asset for long-term storage.
The crypto industry is stepping up pressure on US politics ahead of the congressional elections. Hundreds of millions of dollars have already been directed to supporting loyal candidates, and the balance is increasingly shifting towards the Republicans, notes CoinDesk.