Sample Category Title
EUR/USD Daily Outlook
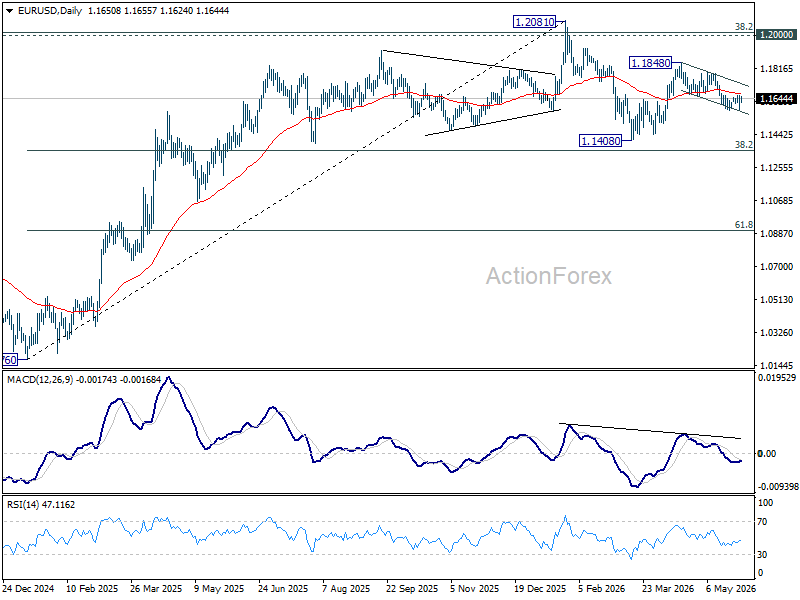
EUR/USD is still bounded in range of 1.1575/1660 and intraday bias remains neutral. On the upside, firm break of 1.1660 resistance will argue that fall from 1.1848 has completed as a correction at 1.1575. Intraday bias will be back on the upside for 1.1795 resistance first. On the downside, break of 1.1575 will solidify the case that rebound from 1.1408 has completed at 1.1848, and bring deeper fall back to retest 1.1408 low.
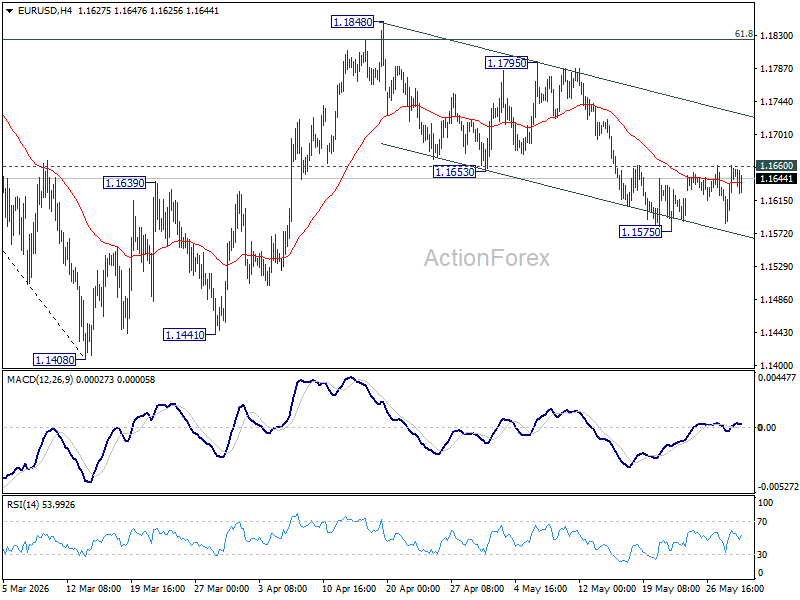
In the bigger picture, the strong support from 38.2% retracement of 1.0176 to 1.2081 at 1.1353 suggests that the pullback from 1.2081 is more likely a corrective move. Strong support was also found in 55 W EMA (now at 1.1544). Focus is back on 1.2 key cluster resistance level. Decisive break there will carry long term bullish implications. Nevertheless, break of 1.1408 support will revive the case of medium term bearish trend reversal.
USD/JPY Daily Outlook
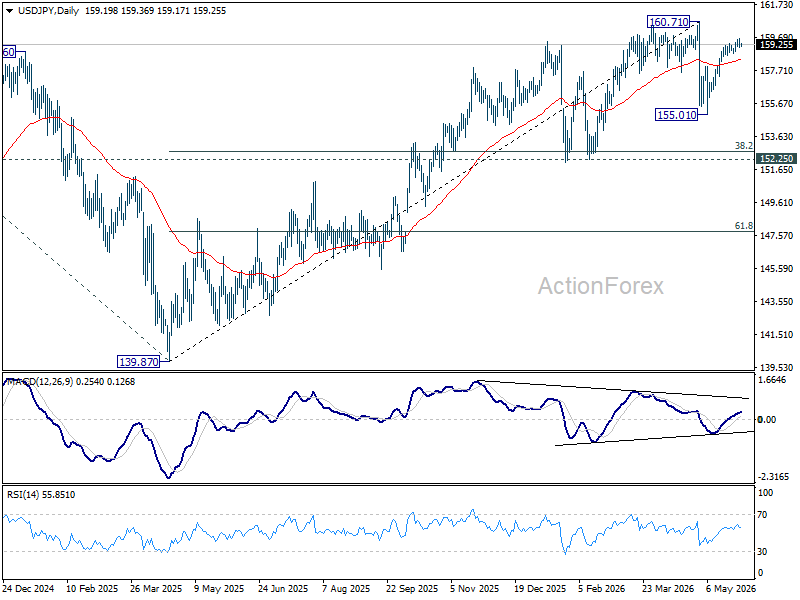
Intraday bias in USD/JPY is turned neutral with current retreat. Rise from 155.01 is seen as the second leg of the corrective pattern from 160.71. While another rise cannot be ruled out, upside should be limited by 160.71 resistance. On the downside, break of 158.74 minor support will turn bias to the downside for 55 D EMA (now at 158.36) and below.
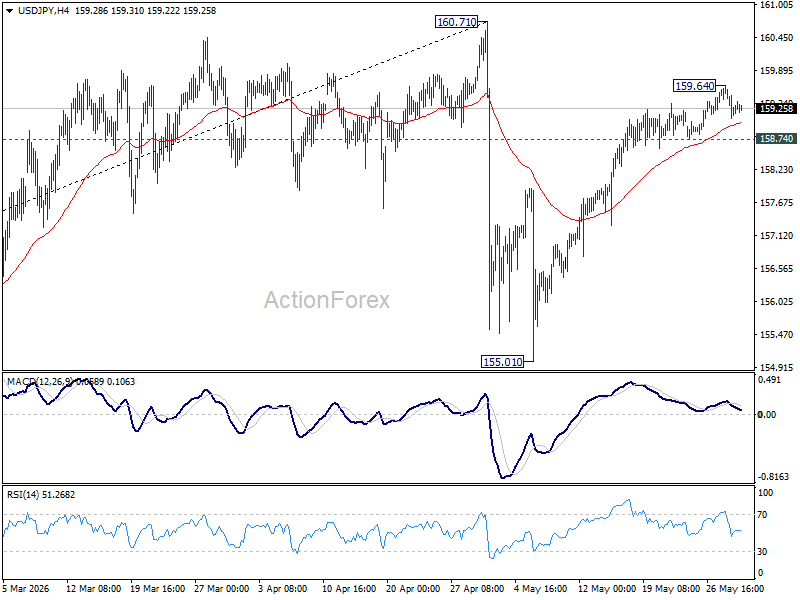
In the bigger picture, for now, corrective pattern from 161.94 (2024 high) is still seen as completed at 139.87. Rise from there is seen as resuming the long term up trend. So, break of 161.94 is expected at a later stage to resume the long term up trend. However, sustained break of 55 W EMA (now at 154.53) will dampen this view and bring deeper fall back towards 139.87 to extend the pattern from 161.94.
GBP/USD Daily Outlook
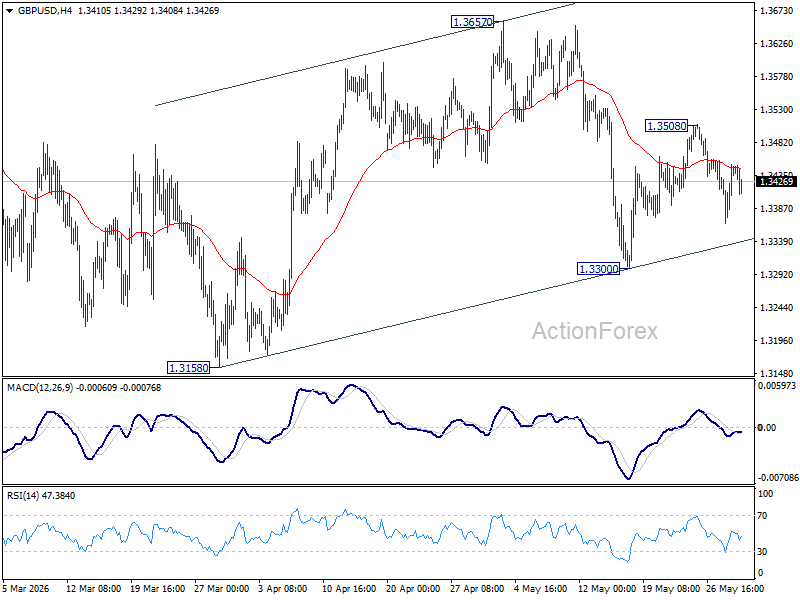
Intraday bias in GBP/USD is turned neutral first with current recovery. On the downside, break of 1.3300 will extend the fall from 1.3657 to 1.3158. On the upside above 1.3508 will extend the rebound from 1.3300 to 1.3657 resistance first.
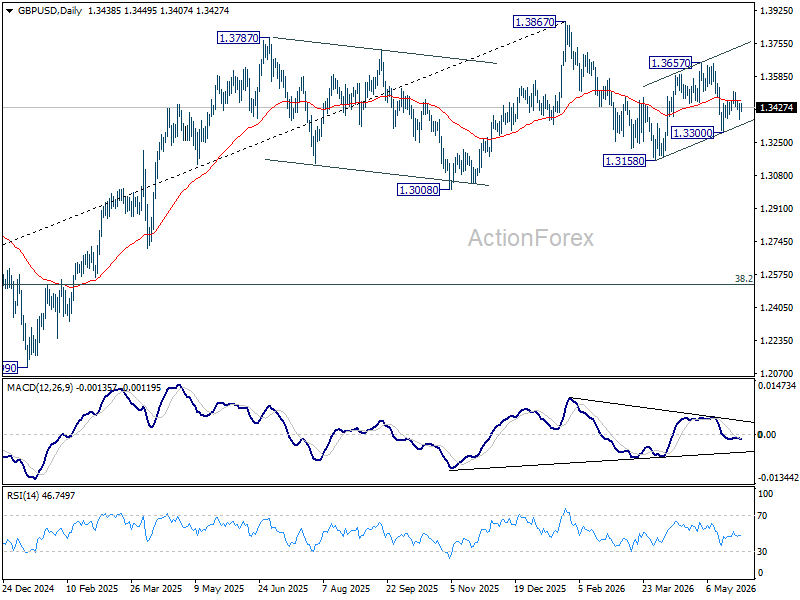
In the bigger picture, current development suggests that price actions from 1.3867 are merely a corrective pattern within the broader up trend from 1.0351 (2022 low). With 1.3008 support intact, medium term bullishness is maintained and break of 1.3867 is in favor for a later stage, towards 1.4248 key resistance (2021 high). However, firm break of 1.3008 will at least bring deeper fall to 38.2% retracement of 1.0351 to 1.3867 at 1.2524, with increased risk of bearish reversal.
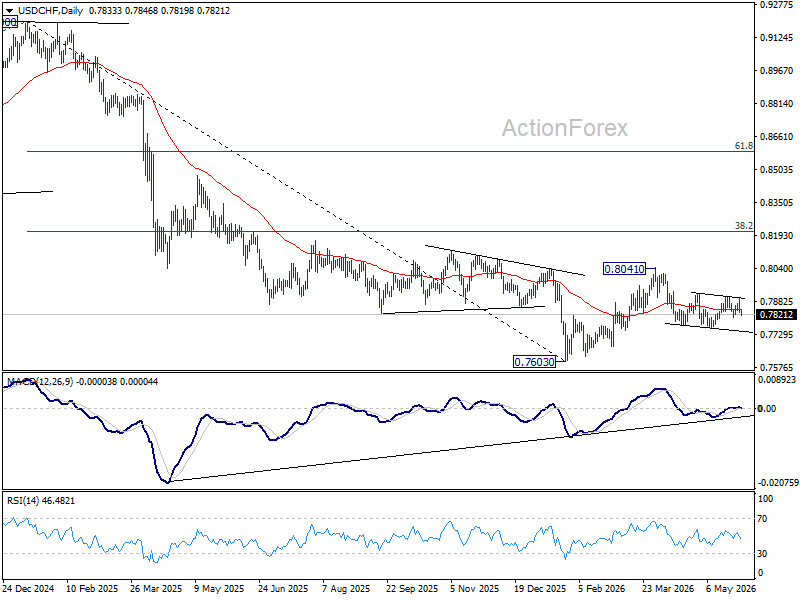
USD/CHF Daily Outlook
USD/CHF reversed after failing to break through 0.7906 resistance, but stays above 0.7807. Intraday bias remains neutral first. On the downside, firm break of 0.7807 will suggest that fall from 0.8041 is ready to resume through 0.7760. Nevertheless, decisive break of 0.7906/23 will indicate that fall from 0.8041 has already completed as a correction.
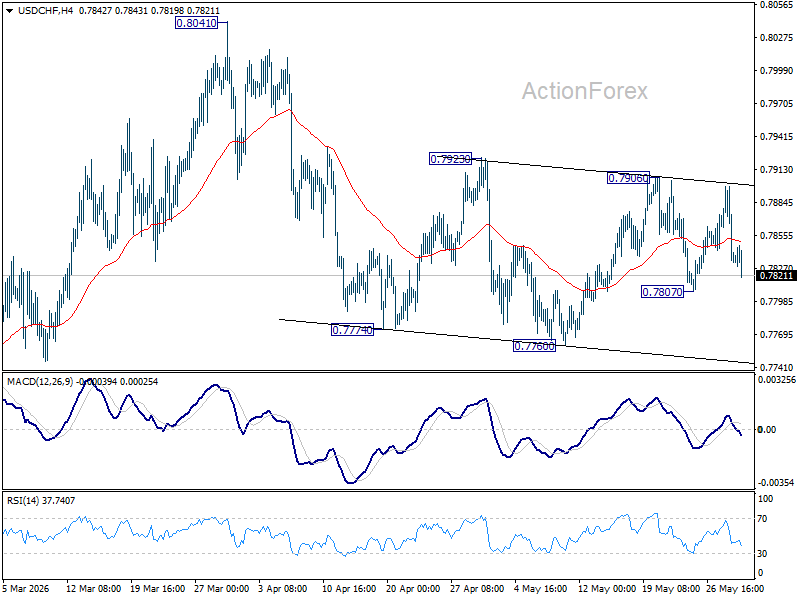
In the bigger picture, as long as 55 W EMA (now at 0.8035) holds, fall from 0.9200 is expected to continue, as part of the larger down trend. Firm break of 0.7603 will target 100% projection of 1.0146 (2022 high) to 0.8332 from 0.9200 at 0.7382.
AUD/USD Daily Report
Range trading continues in AUD/USD and intraday bias stays neutral. On the upside, firm break of 0.7183 resistance will suggest that pullback from 0.7277 has completed. Stronger rally should then be seen to retest 0.7277 high. However, decisive break of 0.7076 will indicate that larger scale correction is underway and target 0.6832 support instead.
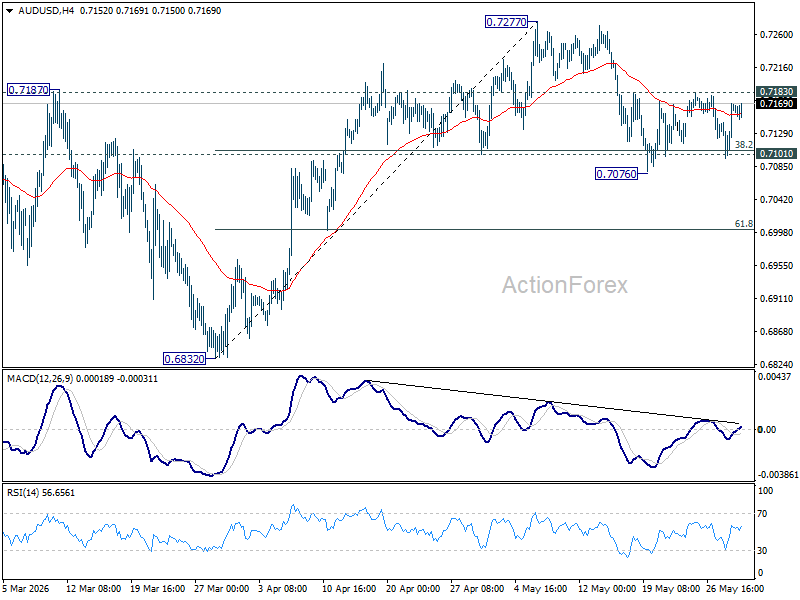
In the bigger picture, rise from 0.5913 (2024 low) is still in progress. Decisive break of 61.8% retracement of 0.8006 to 0.5913 at 0.7206 will solidify the case that it's already reversing the down trend from 0.8006 (2021 high). Further rally should then be seen to retest 0.8006. For now, outlook will remain bullish as long as 0.6832 support holds, in case of pullback.
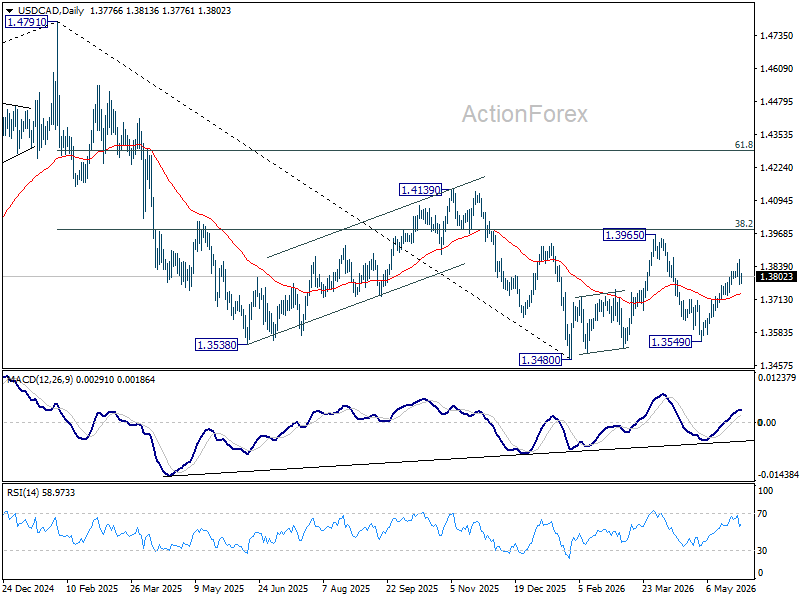
USD/CAD Daily Outlook
Intraday bias in USD/CAD is turned neutral first with current retreat. Further rise is expected as long as 1.3729 support holds. Rise from 1.3549 is seen and the third leg of the pattern from 1.3480. Above 1.3868 will target 1.3965 resistance. On the downside. Break of 1.3729 will suggest that the rebound has completed, and turn bias back to the downside.
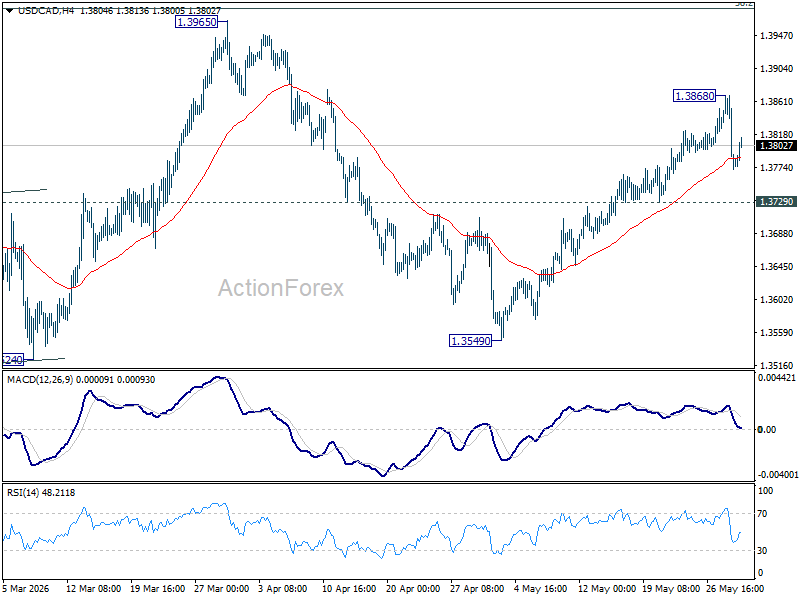
In the bigger picture, price actions from 1.4791 are seen as a corrective pattern to the whole up trend from 1.2005 (2021 low). Deeper fall could be seen, as the pattern extends, to 61.8% retracement of 1.2005 to 1.4791 at 1.3069. However, decisive break of 38.2% retracement of 1.4791 to 1.3480 at 1.3981 will argue that the correction has completed with three waves down to 1.3480 already.
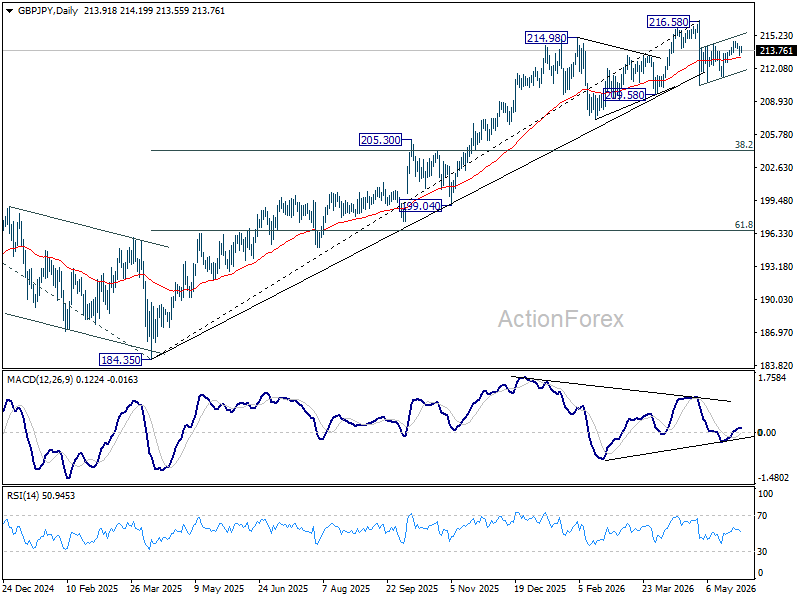
GBP/JPY Daily Outlook
No change in GBP/JPY's outlook and intraday bias stays neutral. On the upside, above 214.66 will extend the rebound from 210.43 to retest 216.58 high. Strong resistance should be seen there to cap upside, at least on first attempt. On the downside, below 213.25 minor support will turn bias back to the downside for 211.23 support instead.
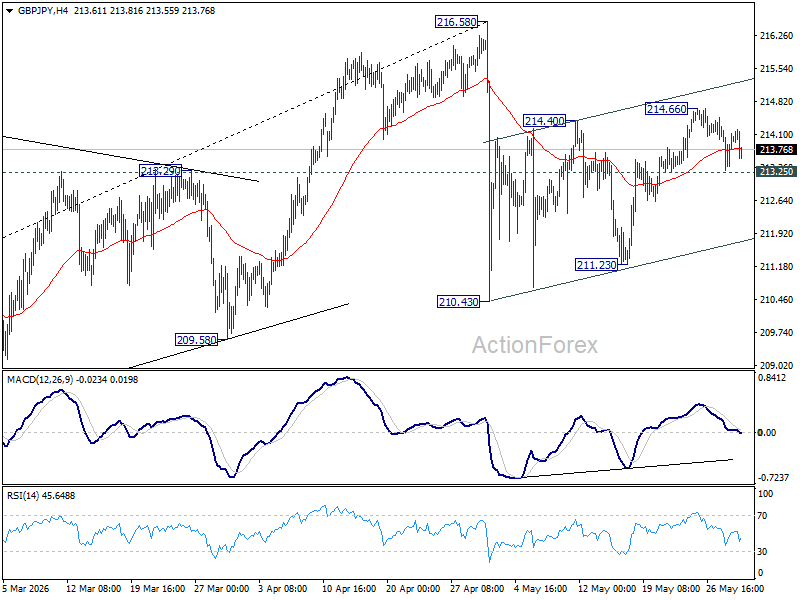
In the bigger picture, while the fall from 216.58 is steep, there is no clear sign of trend reversal yet. The long term up trend could still extend to 61.8% projection of 148.93 (2022 low) to 208.09 (2024 high) from 184.35 at 220.90 on resumption. However, sustained break of 55 W EMA (now at 206.27) will argue that it's already in medium term down trend for 184.35 support.
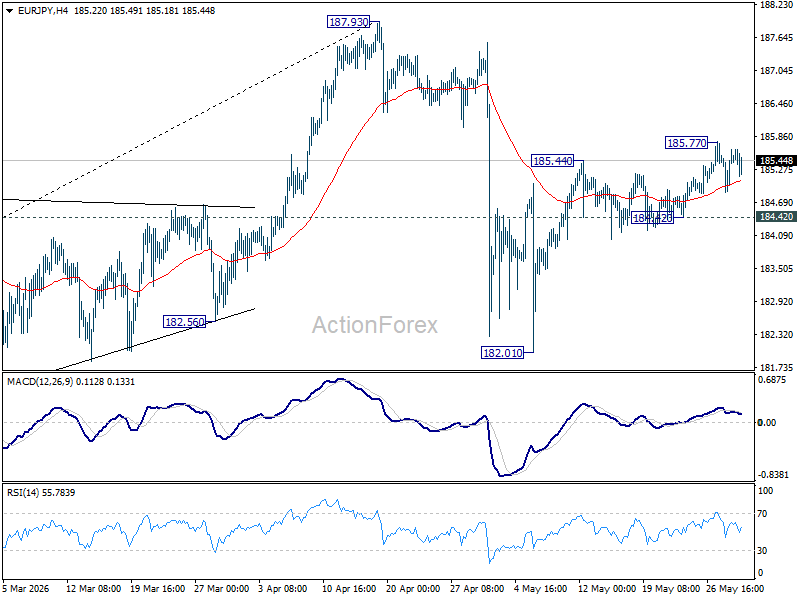
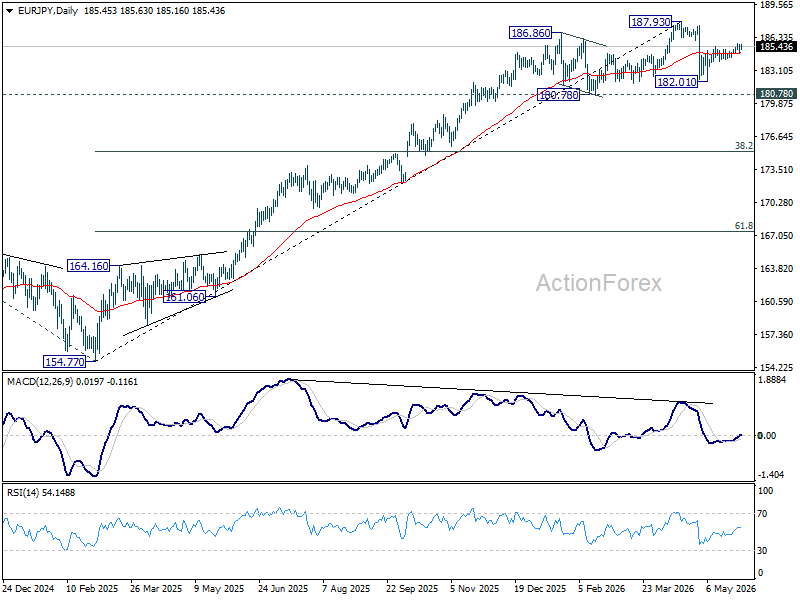
EUR/JPY Daily Outlook
Intraday bias in EUR/JPY remains neutral and more consolidations could be seen below 185.77 temporary top. Rebound from 182.01 is seen as the second leg of the corrective pattern from 187.93. Above 185.77 will target a retest on 187.93 high. Nevertheless, firm break of 184.42 will suggest that the rebound has completed, and turn bias back to the downside for 182.01.
In the bigger picture, the pullback from 187.93 is steep, there is no sign of reversal yet. Uptrend from 114.42 (2020 low) is still expected to resume at a later stage to 78.6% projection of 124.37 (2022 low) to 175.41 (2025 high) from 154.77 at 194.88. However, sustained break of 55 W EMA (now at 178.51) will argue that it's already in a medium term down trend to 175.41 resistance turned support and below.
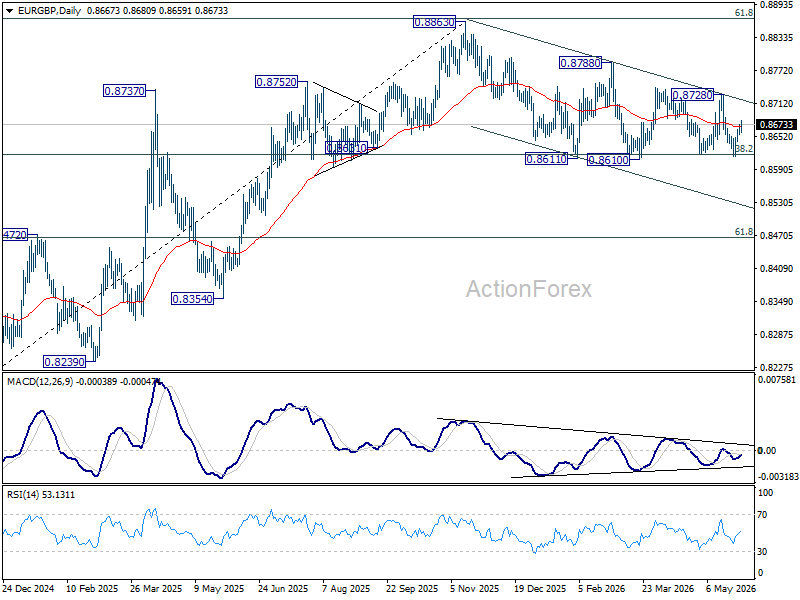
EUR/GBP Daily Outlook
EUR/GBP is still bounded in sideway trading and intraday bias remains neutral. On the downside, decisive break of 0.8610 support will revive the case of bearish trend reversal. Deeper decline should be seen to 61.8% retracement of 0.8221 to 0.8863 at 0.8466. On the upside, break of 0.8728 resistance will bring stronger rally back towards 0.8740 resistance.
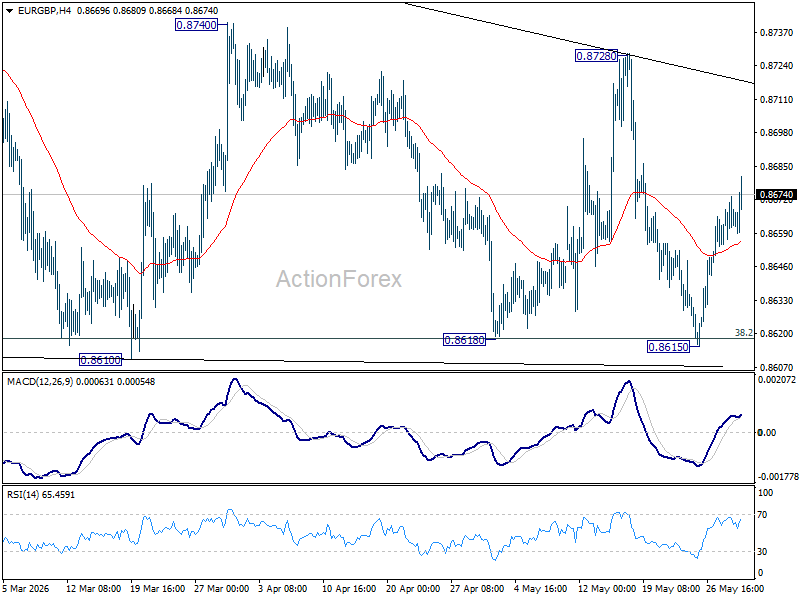
In the bigger picture, focus is staying on 38.2% retracement of 0.8821 to 0.8863 at 0.8618. Strong rebound from there will retain medium term bullishness. Rise from 0.8221 should resume through 0.8863 at a later stage. Nevertheless, sustained break of 0.8618 will confirm that whole rise from 0.8221 has completed at 0.8863. Deeper decline should then be seen to 61.8% retracement at 0.8466 at least.
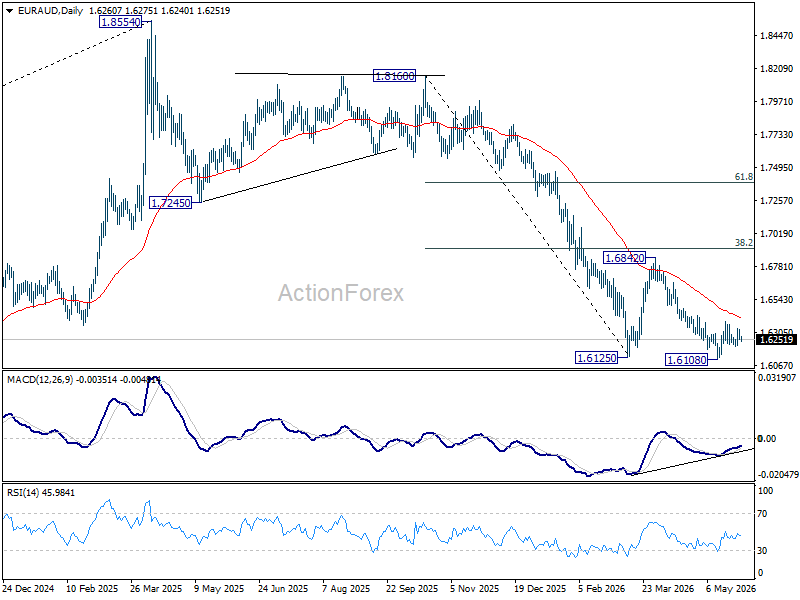
EUR/AUD Daily Outlook
Range trading continues in EUR/AUD and intraday bias remains neutral. Rise from 1.6108 is tentatively seen as the third leg of the pattern from 1.6125. Above 1.6381 will target 55 D EMA (now at 1.6411) and above. Nevertheless, firm break of 1.6108 will resume the larger down trend from 1.8554.
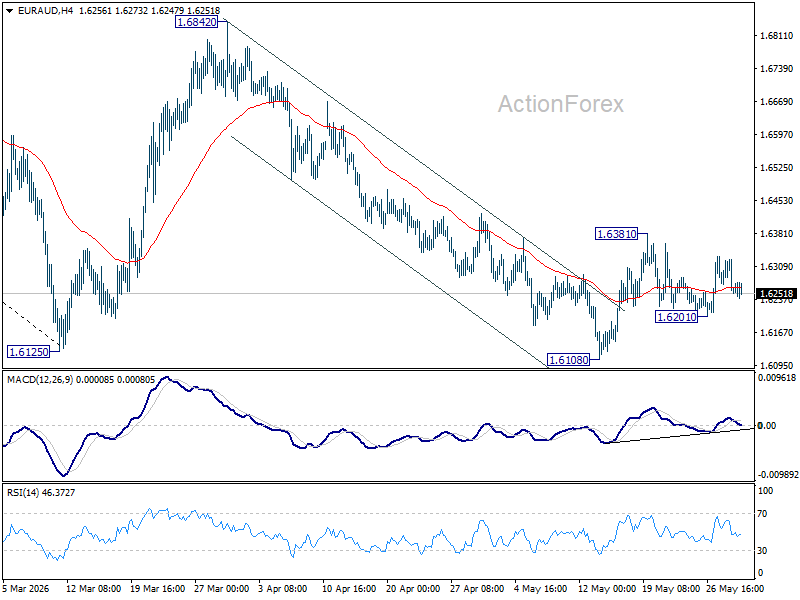
In the bigger picture, fall from 1.8554 (2025 high) is in progress and deeper decline should be seen to 61.8% retracement of 1.4281 to 1.8554 at 1.5913, which is slightly below 1.5963 structural support. Decisive break there will pave the way back to 1.4281 (2022 low). For now, risk will stay on the downside as long as 55 W EMA (now at 1.6984) holds, even in case of strong rebound.