

Sample Category Title
Crypto Market Breaks Above the 50-Day Ma: Bitcoin Eyes $73–74K
Market Overview
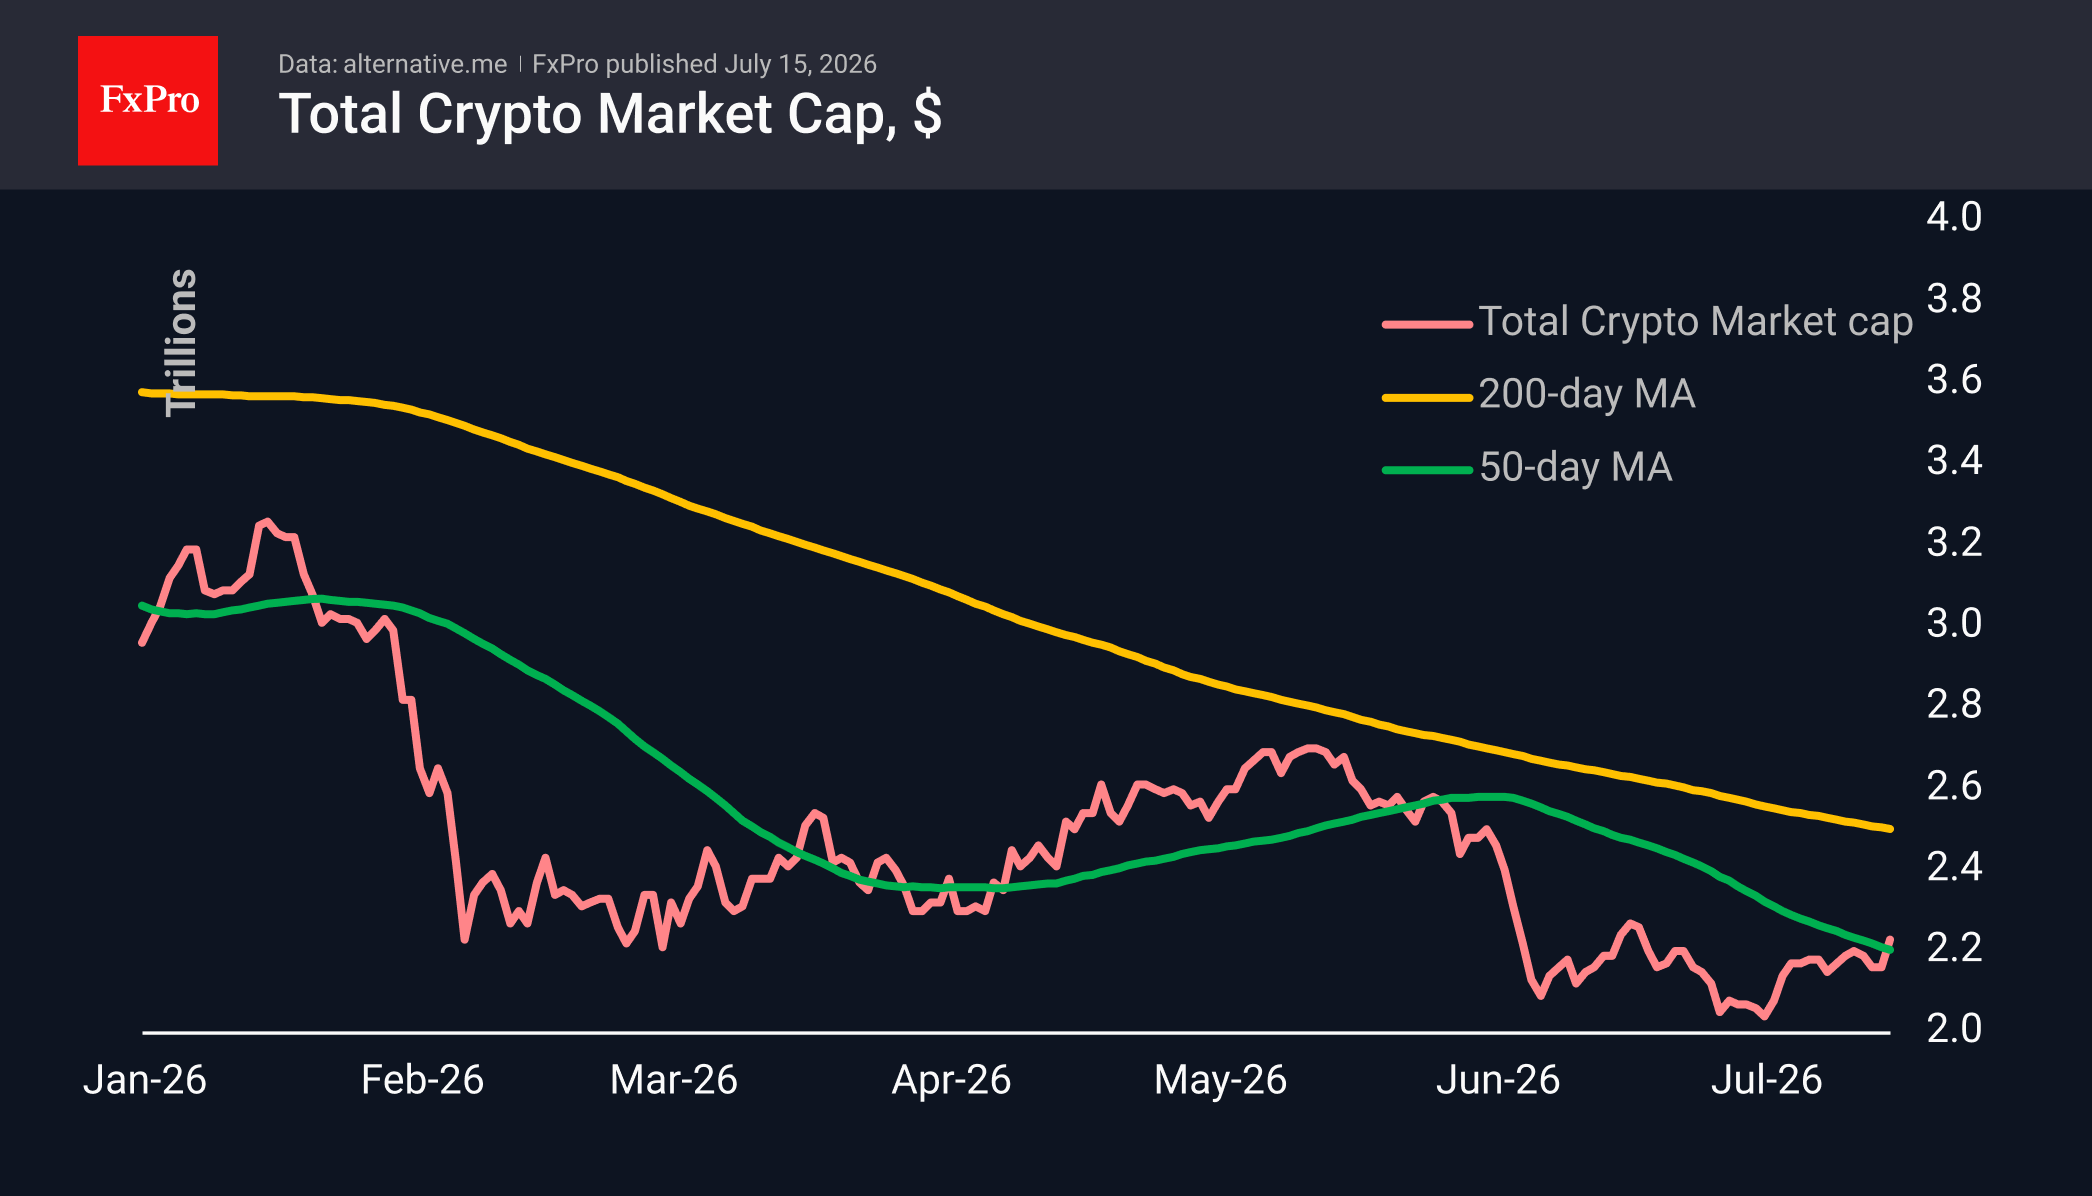
The crypto market capitalisation rose by 3.5% to $2.22T, reaching a three-week high, following the release on Tuesday of weak US inflation data, which showed inflation slowing at its fastest rate in the last six years, thereby reducing the likelihood of a Fed rate hike. The market has risen above its 50-day moving average, signalling one of the first indications of a shift towards a medium-term bullish trend. Among the most popular coins, the top performers over the last 24 hours were Zcash (+8.8%), Chainlink (+5.2%) and Ethereum (+4.9%). Meanwhile, among the laggards, there was also a very moderate pullback, with losses for IOTA (-1.7%), Internet Computer (-0.8%) and Theta Network (-0.4%).
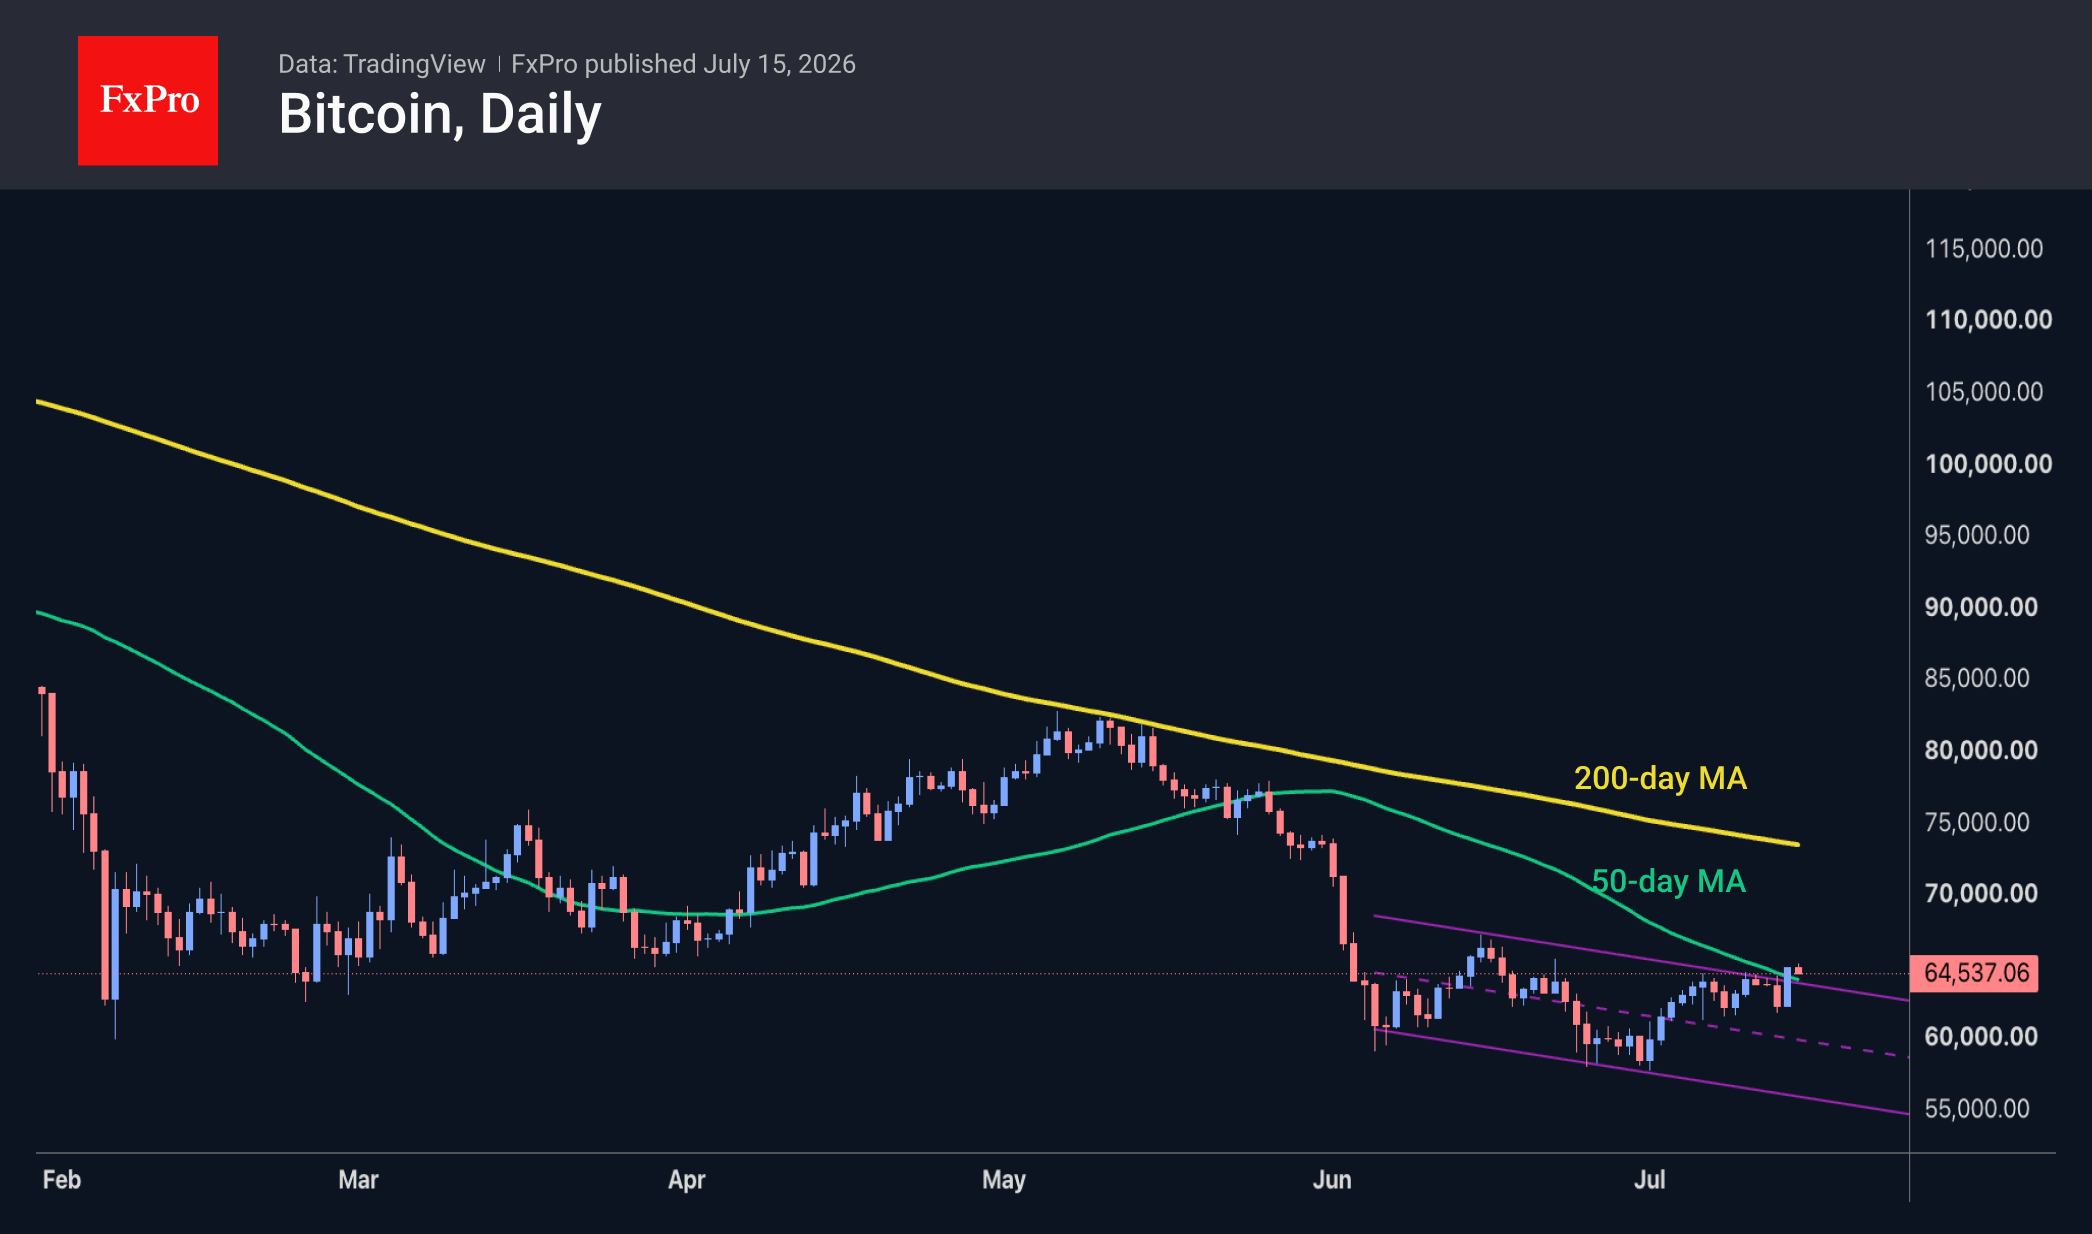
Bitcoin is trading near $65K following an impressive surge on Tuesday, which helped it close above the 50-day moving average and the upper boundary of the downward channel in place since early June. This is a strong signal of a potential trend reversal, further supported by fundamental data: lower inflation figures. Provided the leading cryptocurrency does not face obstacles in the form of deteriorating geopolitical conditions, the next significant resistance level may not be reached until $73–74K. This is where the downward momentum originated in early June, and it is also where the 200-day moving average is located.
News Background
Current levels of network activity point to waning interest in Bitcoin. Trading volumes in US spot ETFs have fallen by 78% from this year’s peak levels. Recent price movements lack the reliable support of organic demand that typically accompanies sustained growth, according to Glassnode.
According to The Block, the number of posts mentioning Bitcoin and Ethereum on social media platform X has fallen to annual lows. Comparable levels were also recorded in 2020, while institutional participation has since increased.
A survey by the cryptocurrency exchange Coinbase has shown that most investors doubt the decline in the leading cryptocurrency has come to an end. Meanwhile, Bitcoin has fallen to levels corresponding to the estimated cost of mining. Historically, such a range has always marked a trend reversal, notes analyst Quentin Francos.
According to Arkham Intelligence, the US authorities have transferred Bitcoin and Ethereum with a combined value of around $300 million to the Coinbase Prime crypto exchange. The movement of crypto assets does not necessarily imply an imminent sale; nevertheless, transferring them to such a platform is seen as preparation for a sale or exchange.
US banks have called on the Senate to explicitly include a ban on yields on stablecoins in the CLARITY Act, a key piece of legislation regulating the crypto market. The current wording of the bill leaves room for payments that are economically similar to interest on deposits.
The FxPro Analyst Team
Brent Crude Oil: from Ceasefire to Crossfire — What’s Next?
Just weeks ago, traders were pricing in peace. Now they're pricing in war again—and that reversal says everything about how fragile the current Middle East calm really is.
Brent crude has surged to $86 a barrel, its highest level in a month, after the Washington-Tehran ceasefire effectively collapsed. US strikes hit Iranian defence infrastructure, Iranian missiles struck Emirati tankers, and Washington reinstated its naval blockade of Iranian ports.
Additionally, yesterday's June CPI year-on-year print eased bullish pressure on the dollar and gave a lift to dollar-denominated assets. Headline inflation fell to 3.5% year-on-year, well below the expected 3.8%, largely thanks to a sharp drop in energy prices during June. However, the read looks backward-looking rather than structural: it reflects June's energy weakness, before the ceasefire unraveled.
Technical Analysis of Brent Crude Oil
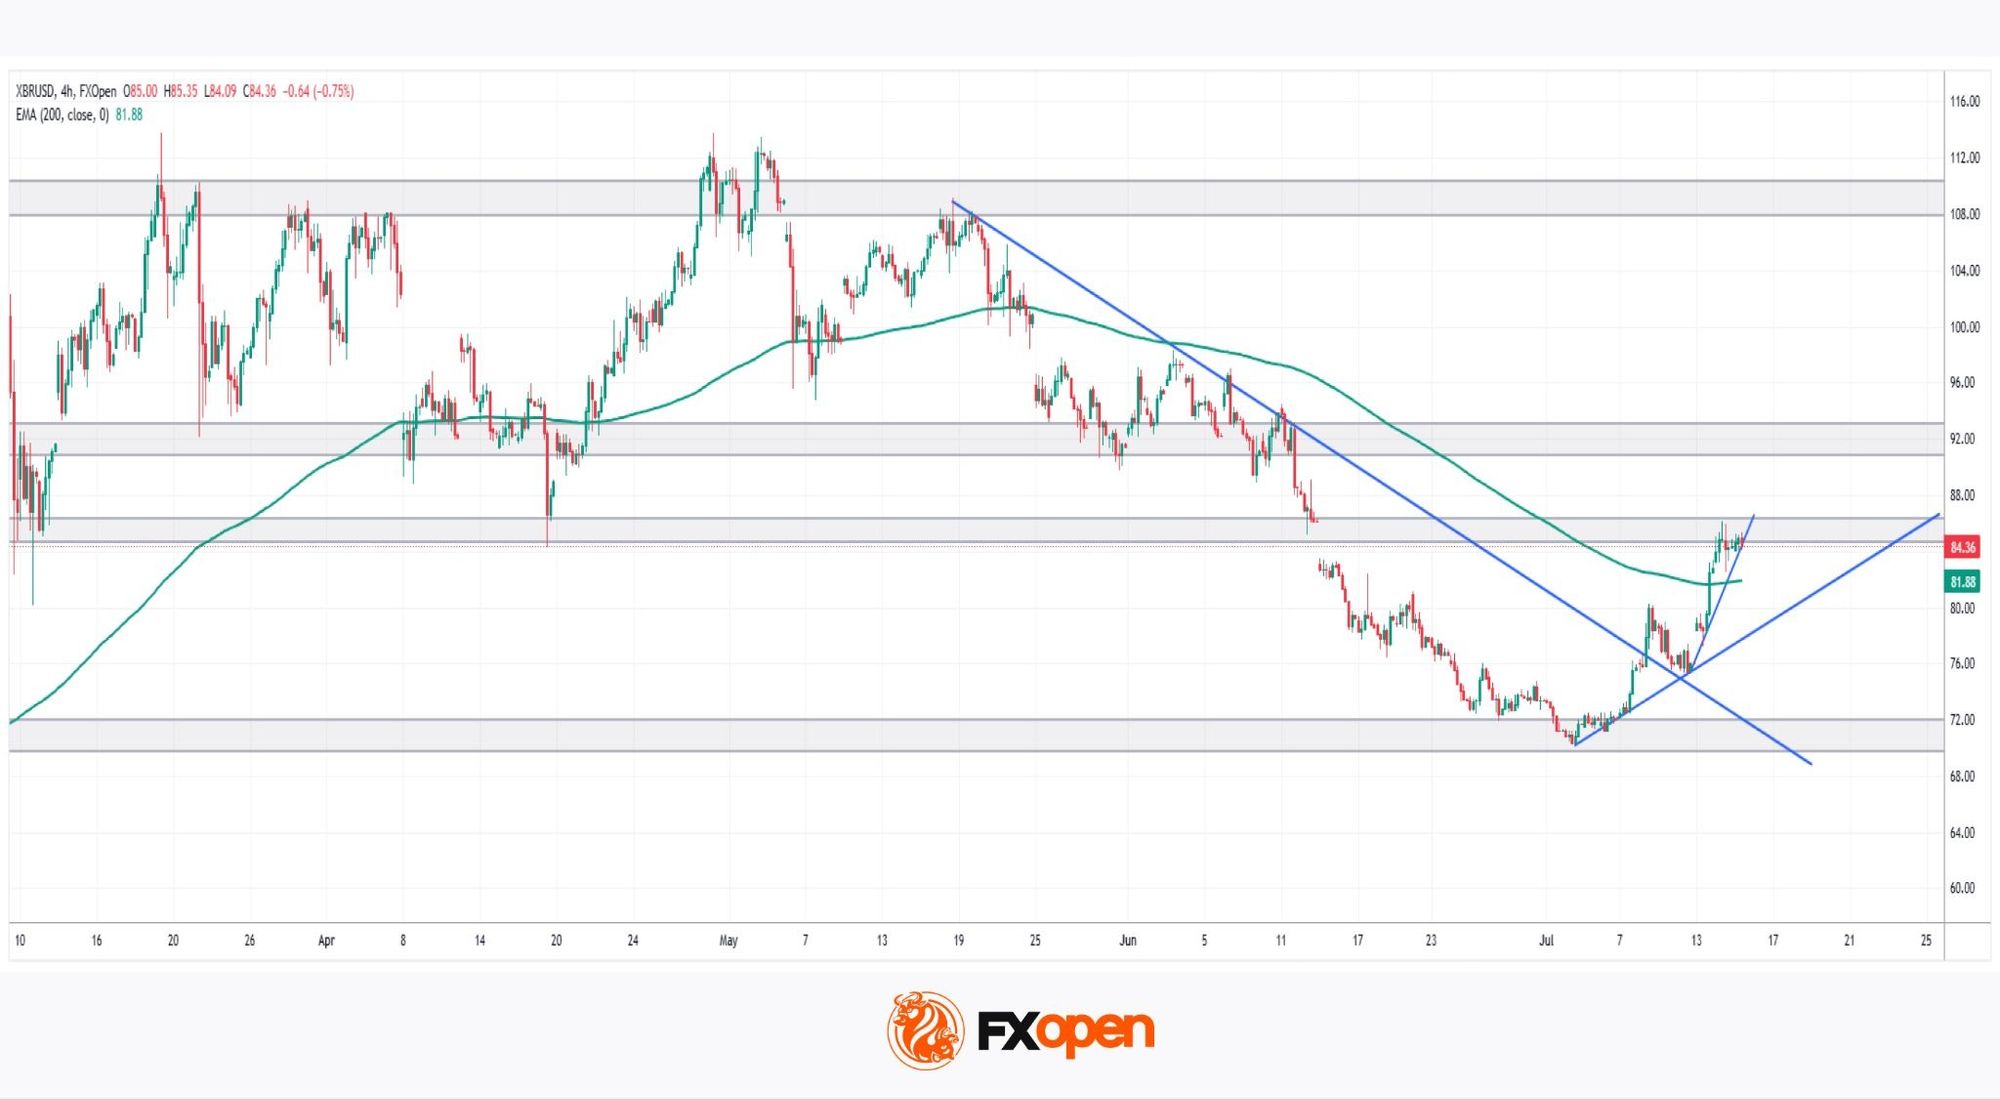
As the chart shows, Brent entered a clear downtrend after being repeatedly rejected from the psychological $110 zone in May, marked by lower highs and lower lows and a descending trendline respected for nearly two months.
Bullish Scenario
After bottoming near $70 in early July, Brent shifted character, printing higher highs and higher lows due to renewed Middle East tensions. This was confirmed by a break and retest of the descending trendline, followed by a reclaim and retest of the 200-period EMA. With two ascending trendlines now supporting the move, price sits at a key juncture: the $85 zone, a former support turned resistance. A confirmed break here would open the path back toward the $90-$92 zone.
Bearish Scenario
Alternatively, Brent could reject $85 once again, pulling the price back into the $70–$80 range that has defined the past month. Confirmation would come from a break below both the short-term trendline and the 200-period EMA, signaling that buyers have lost control and exposing the range lows.
Brent Crude now sits at a genuine crossroads, caught between an unresolved geopolitical crisis and a technical structure hinting at renewed strength. Whether this bounce marks a real turning point or just another head-fake within a volatile range will likely hinge on who blinks first—Washington and Tehran, or buyers and sellers at $85. Either way, the next move could set the tone for the entire energy market this summer.
Start trading commodity CFDs with tight spreads (additional fees may apply). Open your trading account now or learn more about trading commodity CFDs with FXOpen.
This article represents the opinion of the Companies operating under the FXOpen brand only. It is not to be construed as an offer, solicitation, or recommendation with respect to products and services provided by the Companies operating under the FXOpen brand, nor is it to be considered financial advice.
Silver Risks Falling to $50 as Dollar Holds Firm and Solar Demand Shifts
Silver's recovery lost momentum below the $60 mark this week despite softer-than-expected US inflation, highlighting a macro backdrop that has become less supportive than many investors anticipated. Ordinarily, a downside surprise in CPI would trigger a broader Dollar selloff and provide precious metals with a meaningful tailwind. This time, however, the Dollar's decline proved relatively shallow and uneven, while buying interest in Silver remained subdued. Together, those factors have kept the metal trapped within its recent trading range and preserved a bearish near-term outlook.
The first headwind has been the Dollar itself. Although the Dollar Index initially fell following June's weaker CPI report, it recovered a meaningful portion of those losses after Federal Reserve Chair Kevin Warsh reaffirmed the Fed's commitment to restoring price stability while avoiding any dovish policy signals during his congressional testimony. The Dollar's weakness was also concentrated in a handful of currencies with their own domestic catalysts, particularly the Canadian Dollar, supported by stronger oil prices and a more hawkish Bank of Canada outlook, and the New Zealand Dollar following hawkish comments from RBNZ Chief Economist Paul Conway. Against the Euro, Sterling, Swiss Franc and Yen, Dollar weakness was comparatively modest. Without a broad-based decline in the US currency, Silver has struggled to attract the sustained buying that typically follows softer US inflation.
Muted demand has reinforced that pressure. While positioning data are not yet available to confirm investor behavior, price action suggests opportunistic buying following the CPI release was considerably weaker than in previous episodes of Dollar weakness. The inability to reclaim the $60 level despite an ostensibly supportive inflation report indicates that buyers remain cautious, leaving the metal vulnerable if the Dollar regains strength or Treasury yields move higher again.
Beyond the immediate macro backdrop, Silver also faces a more structural challenge through industrial demand. The market is currently in its sixth consecutive annual supply deficit, but unlike many commodities, higher prices do not necessarily generate a meaningful increase in supply. Around 70% of global Silver production comes as a by-product of copper, lead and zinc mining, meaning output decisions depend primarily on those metals rather than Silver prices. New mine development also typically requires seven to ten years, leaving demand adjustment as the principal mechanism for balancing the market.
That demand adjustment may already be underway. China's largest solar manufacturer, Longi Green Energy, has begun commercial production using copper-metallized solar cells, reducing reliance on Silver in one of the metal's fastest-growing industrial applications. Given that the solar sector accounted for roughly 17% of global Silver demand last year, broader adoption of copper metallization could gradually weaken one of Silver's most important structural demand drivers. The transition is unlikely to transform the market overnight, but it represents a notable shift in the long-term balance between supply and demand.
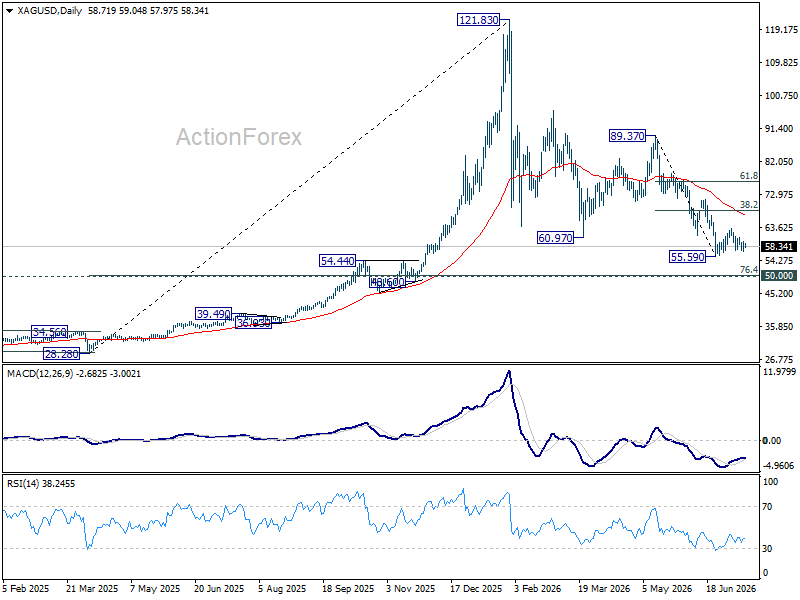
Technically, the outlook remains bearish while resistance at 63.25 caps upside. A break below 55.59 would resume the broader decline from the record high of 121.83 to o 76.4% retracement of 28.28 to 121.83 at 50.35, which is close to 50 psychological level.
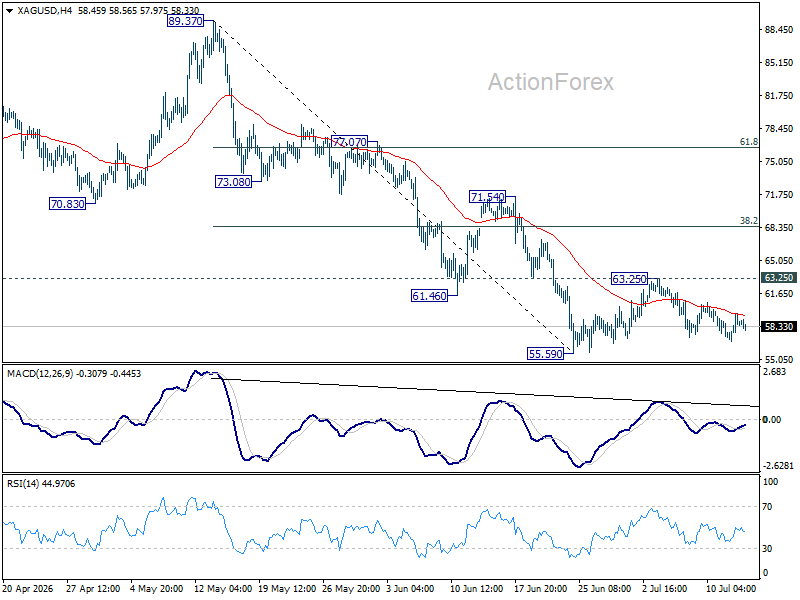
Conversely, sustained break above 63.25 would delay the bearish scenario and extend the corrective rebound toward with another rising leg to 38.2% retracement of 89.37 to 55.59 at 68.49 instead.
Until the Dollar weakens more broadly, however, Silver appears increasingly vulnerable to another leg lower.
AUD/USD and USD/CAD React to Softer US Inflation
Commodity-linked currencies strengthened after US inflation data came in weaker than expected. The Consumer Price Index (CPI) slowed to 3.5% year-on-year in June, below the 3.8% forecast, while core inflation eased to 2.6% versus expectations of 2.8%. On a monthly basis, headline CPI unexpectedly fell by 0.4%, while core CPI was unchanged. The moderation in inflationary pressure increased expectations that the Federal Reserve may adopt a more accommodative policy stance, putting pressure on the US dollar and supporting both the Australian and Canadian dollars against the greenback.
However, despite the weaker US dollar, the next move in USD/CAD will largely depend on the Bank of Canada's policy decision. Later today, the central bank will announce its interest rate decision, publish its updated Monetary Policy Report, and hold a press conference with the Governor. If policymakers maintain a cautiously hawkish tone on inflation, the Canadian dollar could receive additional support. Conversely, a more dovish message may limit CAD gains despite the broader weakness in the US dollar.
Market participants will also focus on the release of the US Producer Price Index (PPI), which will provide further insight into inflation trends following the softer CPI report. In addition, US crude oil inventory data could influence USD/CAD, as oil prices traditionally have a significant impact on the Canadian dollar.
AUD/USD
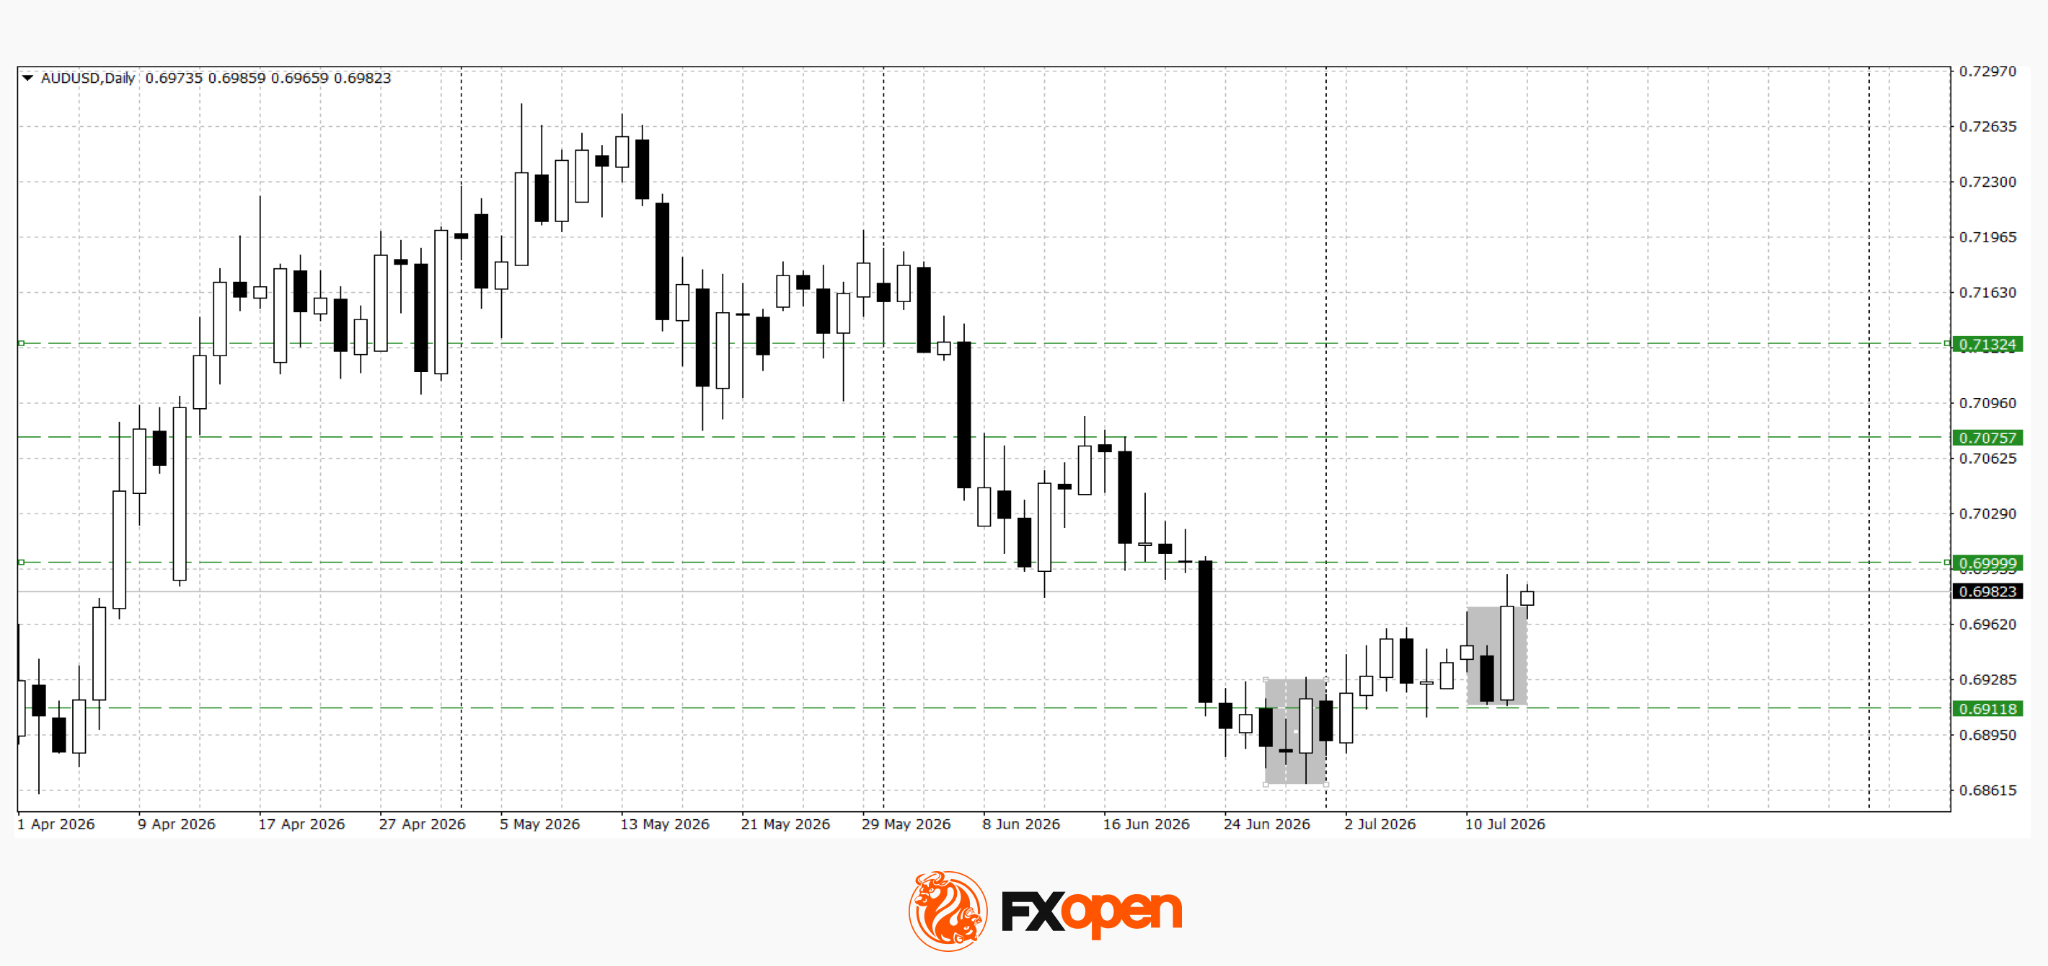
The AUD/USD pair continues to develop the bullish engulfing reversal pattern. Yesterday, buyers managed to test the key resistance level around 0.7000. If the pair secures a sustained break above this level, the rally could extend towards the 0.7080–0.7130 area. The bullish scenario would be invalidated by a move below 0.6900.
Key events for AUD/USD:
- Today at 14:00 (GMT+3): US MBA Mortgage Market Index
- Today at 15:30 (GMT+3): US Producer Price Index (PPI)
- Today at 15:45 (GMT+3): Speech by FOMC member John Williams
USD/CAD
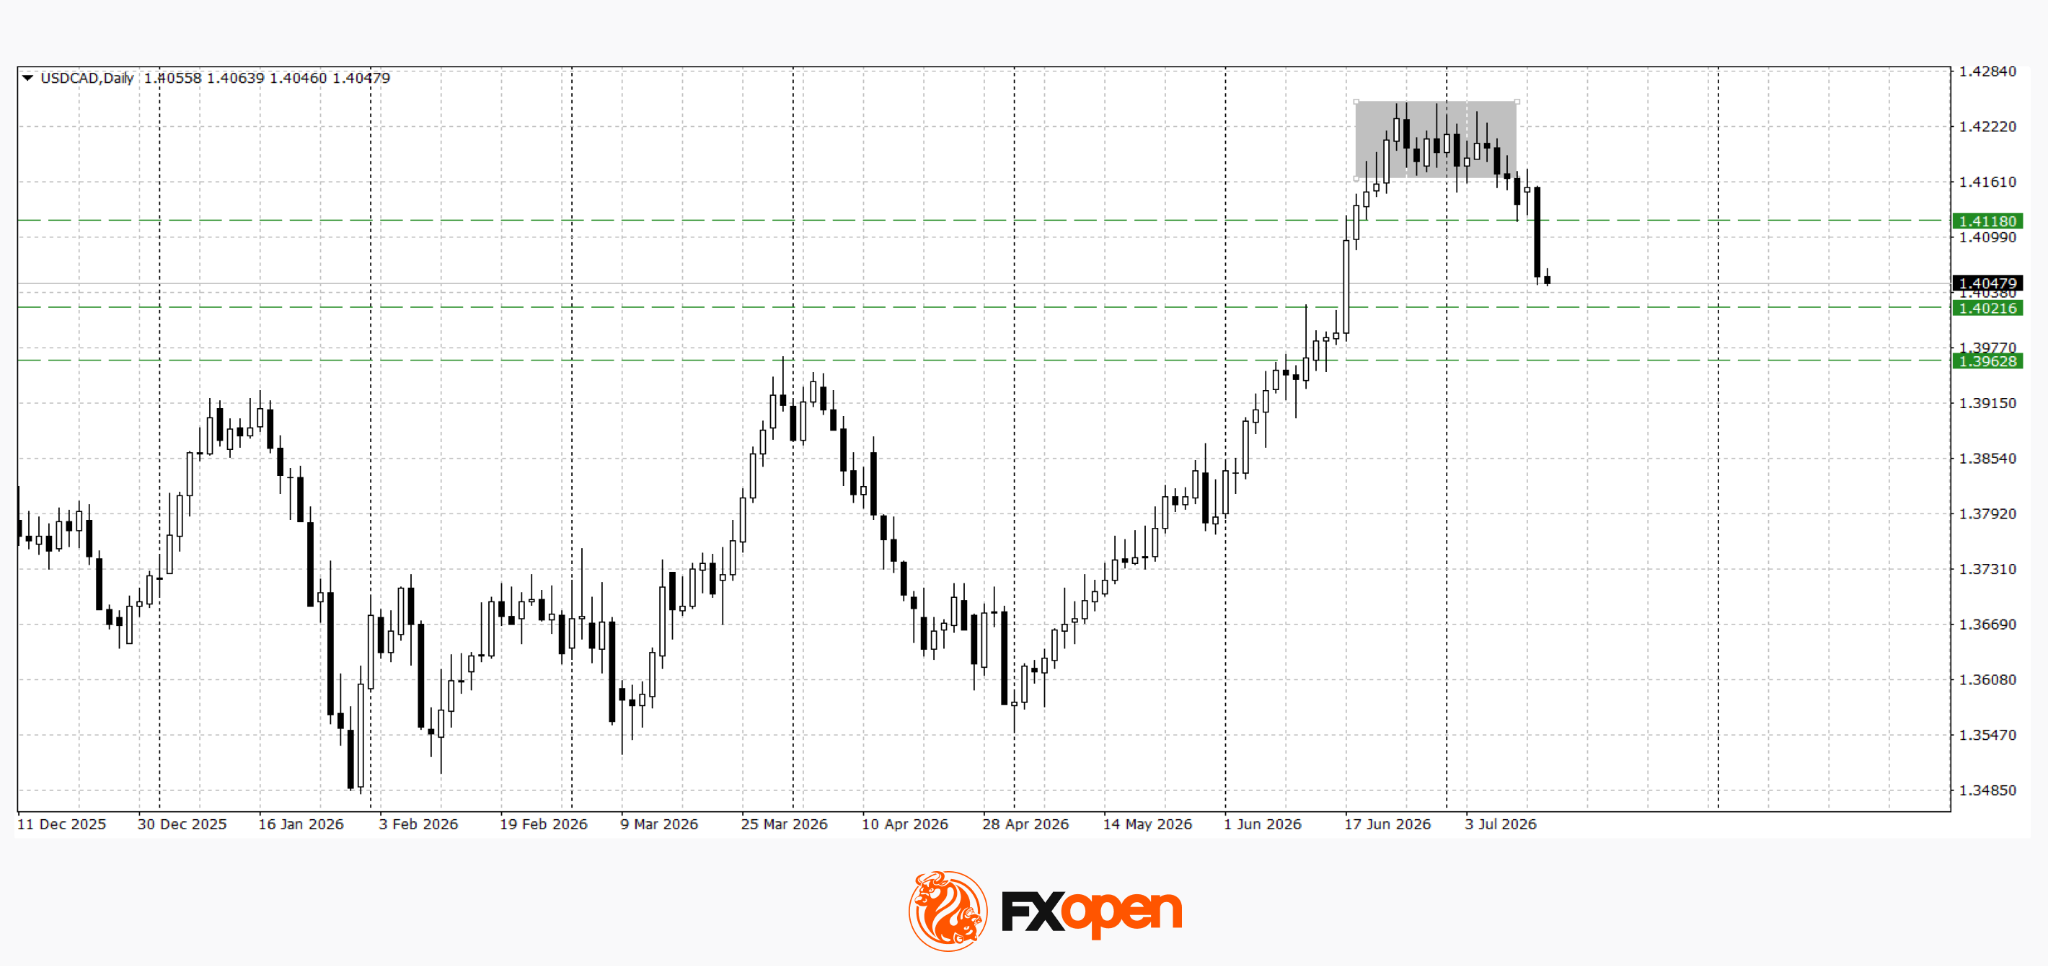
Following confirmation of the bearish tower top reversal pattern, selling pressure on USD/CAD intensified, reinforced by the weaker-than-expected US inflation data. As a result, the pair declined below 1.4100. Technical analysis suggests there is scope for a further move lower towards the 1.3960–1.4020 area. A decisive break back above 1.4120 could revive the bullish outlook.
Key events for USD/CAD:
- Today at 16:45 (GMT+3): Bank of Canada interest rate decision
- Today at 17:30 (GMT+3): US Crude Oil Inventories
- Today at 17:30 (GMT+3): Bank of Canada press conference
Overall, the weaker US inflation report strengthened expectations of a more accommodative Federal Reserve, weighing on the US dollar and supporting commodity-linked currencies. However, the next moves in AUD/USD and USD/CAD will depend on upcoming economic data and the Bank of Canada's policy guidance.
Trade over 50 forex markets 24 hours a day with FXOpen. Take advantage of low commissions, deep liquidity, and spreads from 0.0 pips (additional fees may apply). Open your FXOpen account now or learn more about trading forex with FXOpen.
This article represents the opinion of the Companies operating under the FXOpen brand only. It is not to be construed as an offer, solicitation, or recommendation with respect to products and services provided by the Companies operating under the FXOpen brand, nor is it to be considered financial advice.
GBP/USD Awaits Political News: What Will Happen Next
GBP/USD rose to 1.3403 on Wednesday, with British politics taking centre stage for investors.
The market is assessing the upcoming change of prime minister, with Andy Burnham set to take office on 20 July. Of additional interest is the potential candidate for the new Chancellor of the Exchequer. In betting markets, Ed Miliband is considered the favourite, whom investors perceive as a supporter of more active fiscal spending.
At the same time, market participants are monitoring escalating tensions in the Middle East, rising oil prices, and increased inflation risks. The United States has continued its strikes on Iran following Donald Trump's restoration of a naval blockade on Iranian shipping and his proposal for a 20% fee to cover the costs of securing the Strait of Hormuz.
Against this backdrop, markets have strengthened expectations of further rate hikes from the Bank of England. Investors are now almost fully pricing in two rate increases in 2026, with a September hike already largely reflected in quotes.
In the US, weaker-than-expected inflation data for June has eased pressure on the Federal Reserve. However, Christopher Waller warned that the regulator could tighten policy again if inflation remains above the 2% target.
Technical Analysis
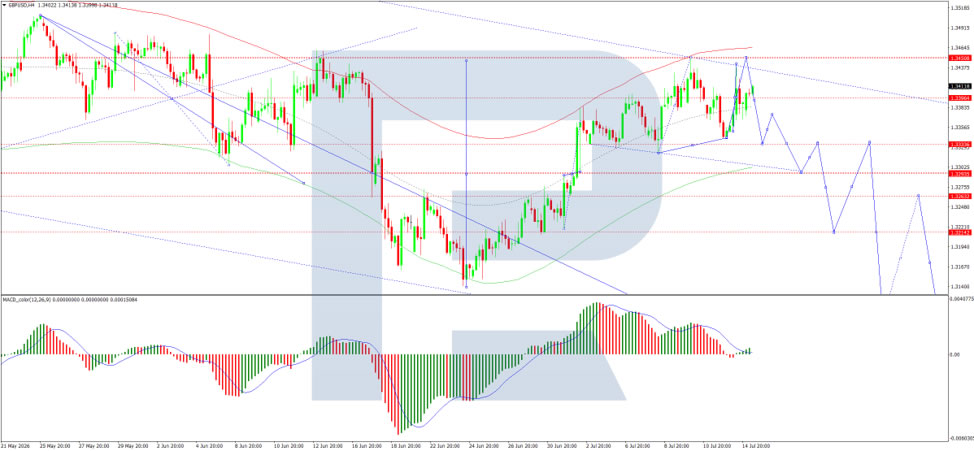
On the H4 GBP/USD chart, the market is shaping a growth wave towards 1.3451. A wide consolidation range is practically forming around the 1.3393 level. An upside breakout from this range would open potential for the wave to continue to 1.3453. A downside breakout would suggest the potential for the wave to continue to 1.3333, with the prospect of the trend extending to 1.3090. Technically, this scenario is confirmed by the MACD indicator, whose signal line is above the zero level and pointing strictly downwards.
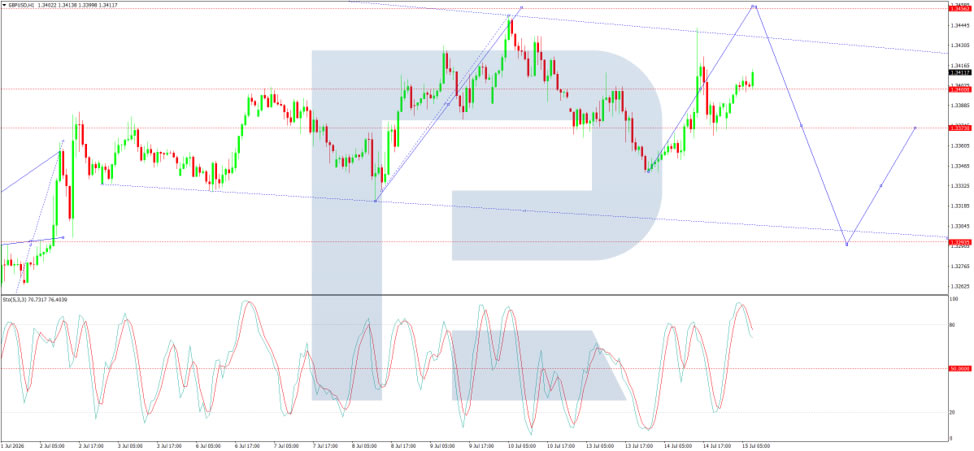
On the H1 chart, the market has formed a compact consolidation range around the 1.3400 level, currently extending down to 1.3370. An increase to 1.3451 is expected, followed by a decline to 1.3330. Technically, this scenario is confirmed by the Stochastic oscillator, with its signal line below the 80 level and pointing strictly downwards to 20.
Conclusion
GBP/USD has edged higher as markets focus on the upcoming UK political transition, with Andy Burnham set to become prime minister on 20 July. The potential appointment of Ed Miliband as Chancellor-seen as favouring more active fiscal spending-adds an element of intrigue. Meanwhile, geopolitical tensions in the Middle East, including renewed US strikes on Iran and a proposed 20% fee for securing the Strait of Hormuz, have pushed oil prices higher and reinforced Bank of England tightening expectations. Markets are now pricing in two rate hikes for 2026, with September already priced in. In the US, softer inflation data has eased pressure on the Fed, though officials remain vigilant. Technically, the pound may see further upside towards 1.3451 before a potential pullback, with the broader direction hinging on UK political developments and geopolitical risks.
Sunrise Market Commentary
Markets
The June US CPI inflation report rendered a huge downward surprise. A larger than expected decline in energy inflation pulled prices 0.4% lower M/M (vs -0.1% consensus) with the Y/Y-reading slowing from 4.2% to 3.5% (vs 3.8%). Underlying price growth was weaker than feared as well though with prices flat on the month and 2.6% higher Y/Y (from 2.9% vs 2.8% consensus). Details showed a broad-based impact with shelter costs being the most significant drag. Core goods prices were lower as well (used and new vehicles & apparel, home furnishings and prescription drugs standing out) with super core (services excluding airfare and lodging) inflation moderating. As several Fed governors hyped the core CPI number in the run-up, markets were positioned for an upward surprise. A 0.3% M/M core reading even had the potential of sealing the deal on a July Fed rate hike! Being wrong-footed by the number, the front end of the US yield curve rallied with the US 2-yr yield closing 8.9 bps lower. The intraday drop was larger, but partly compensated for by Fed Warsh's semi-annual testimony before Congress. His comments closely echoed the ones from after the June FOMC meeting, but the anti-inflation rhetoric was slightly more forceful. He indicated "no tolerance" for persistently elevated inflation with a resolute commitment to restoring price stability. During the Q&A he also commented on the June CPI report saying it doesn't mean mission accomplished. Warsh was slightly more upbeat on growth, referring to a solid instead of a moderate growth pace with a special mention of AI/capex investments. Prices for consumer electronics were by the way still contributing upward pressure on June CPI. The long end of the US yield curve didn't really cheer the benign inflation print. The US 10-yr yield and 30-yr yield ended respectively 3.3 bps and 0.1 bp lower. Probably because of Warsh's hawkish messaging and as energy prices remain upwardly oriented because of continuous attacks between the US and Iran in the Middle East including the reinstalment of the naval blockade. The energy story was key for European bonds yesterday which didn't join the rally at the front end of the US yield curve. The relative loss of interest rate support pushed EUR/USD from below 1.14 to an intraday high at 1.1462. First minor technical resistance (1.1473) remained out of reach. Today's eco calendar only contains second-tier numbers, leaving way for general (risk) sentiment to dictate intraday gyrations across markets.
News & Views
The Chinese economy grew 0.9% q/q in Q2, decelerating from Q1's 1.3% and the slowest pace in more than two years. In y/y terms, GDP was 4.3% higher, below China's 4.5-5% growth target for this year. That's reviving calls for additional government stimulus even as 2026 growth so far is nicely within that corridor (4.7% YtD). The June economic update that accompanied today's GDP release surprised to the upside in terms of retail sales, which defied expectations for back-to-back y/y drop by rising 1%. The industrial engine is humming at increased speed, 5.3% y/y vs 4.5% in Q1 amid exports soaring to record highs. But fixed asset investments continue to slump. The 5.7% drop was larger than expected and the biggest in the series stretching back to 1992, excluding the pandemic period. Property investment remains the poster child of weak capital spending, contracting at an unseen (even during Covid) 18%. The Chinese yuan reacted stoic with USD/CNY trading near the recent multiyear lows around 6.77.
IFO in a study released yesterday warned that "The European Union (EU) is at risk of failing to meet its own goal of becoming more independent with regard to critical raw materials". IFO mentions that the EU accounts for more than 5% of global production for only four of the 27 critical raw materials examined. For nine of them, its share is zero. IFO researcher Gourevich advocates that Europe should have already established stable partnerships with resource-rich countries and systematically developed its own reserves, but so far there is little more than declarations of intent and too many uncertainties. The study also warns that the EU's dependence on imports is very high, especially in future fields. Europe has to source almost all of the essential and in some cases rare raw materials for batteries, semiconductors, renewables, and defense from abroad. According to Gourevich, swift action is needed to ensure a supply at reasonable prices: "The EU should now back up its partnerships with resource-rich countries through actual projects and funding commitments. Announcements are no longer enough."
China Has Need for Urgent Stimulus
Q2 GDP and the June partial data highlighted (yet again) aggregate growth’s reliance on external demand. Domestic businesses and households are in need of immediate, pro-active support.
Q2 GDP and the June activity data provided a mixed read on China’s economy. Q2 GDP met expectations in the quarter at 0.9%, but the annual rate disappointed, coming in at 4.3%yr. Year-to-date, growth is on track to meet our expectation of 4.7%ytd; however, that rate is towards the bottom of authorities’ 4.5%-5.0% full-year guidance.
Delving into the detail, it is evident the industrial sector continues to drive aggregate momentum. Having dipped near 4.0%yr in April and May, growth in industrial production rebounded to 5.3%yr in June, keeping the year-to-date pulse at 5.4%. High-tech manufacturing categories such as integrated circuits (18.8%yr) and industrial robots (28.1%yr) are behind the recent gains, while motor vehicle production is unchanged over the year (-0.2%yr). Note though, within the vehicle category, production of new-energy vehicles is up 29.4%yr.
This rotation towards high-tech manufacturing is likely a negative for employment given the level of automation used in new factories, so too the relocation of assembly work to neighbouring nations –mobile phone production was down 13.5%yr in June. For aggregate activity though, the integration of Asian production and trade combined with rapid technological development continues to produce significant net gains for the trade position, 27%yr growth in exports and a 36%yr gain for imports leaving the monthly trade surplus at USD126bn in June – just inside January 2025’s record high and a multiple of the surplus prior to the pandemic.
The domestic growth story remains downbeat overall, primarily due to declining investment. Fixed asset investment’s contraction accelerated in June to -5.7%ytd from -4.1%ytd in May. Mining and transport-related investment have grown year-to-date, but manufacturing and utilities investment remain in a lull after years of rapid growth; meanwhile, healthcare, education, recreation and, of course, property investment continue to decline at a rapid rate. Property investment’s 18%ytd fall is arguably most notable, coming after a -11.2%ytd, -10.1%ytd and -7.9%ytd result in June 2025, 2024 and 2023 respectively and despite significant support from authorities over the period. Further material losses are likely given residential property sales were down 13.7%ytd in June and as prices are yet to stabilise – new and existing home prices fell 0.15% and 0.32% respectively in the month.
For the consumer though, there are some emerging positives. Having disappointed earlier in 2026, annual growth rebounded from -0.6%yr to +1.0%yr in June, leaving sales 1.3% higher year-to-date. Spending by category was mixed, in part due to volatility created by several past incentive programs. The property sector’s decline also continues to weigh heavily on demand for construction goods and appliances, although there was some evidence of accelerating discretionary spending, likely aided by equity market gains over the past year and a half and broadly stable labour markets across the major cities and immediate surrounds.
All told, Q2 GDP and the June partial data highlight China’s economic resilience and also give a degree of hope that domestic demand will strengthen over the coming year(s), as authorities intend. That said, as we have recently discussed, there remains a clear disconnect between the income generated by China’s major exporters and the financial prospects of the average Chinese household. Until the returns of trade are distributed more equitably to households, through wages, taxes and wealth gains, Chinese authorities need to fill the gap.
Following such significant declines across essential local infrastructure, and with confidence impaired, today there is little risk of wide-spread capital misallocation or speculative excess. Pro-active support in scale via the local governments and state-owned entities is therefore the best course to speed aid. As the property sector stabilises and businesses recognise a broadening uptrend across the domestic economy, the private sector will also contribute. Our 4.7%ytd expectation for 2026 remains in place but, in the absence of immediate stimulus, is likely to become a stretch target.
USD/CAD to Test Key Support Around 1.4 as Three Tailwinds Boost Loonie Ahead of BoC
By the time the Bank of Canada announces its policy decision today, the Canadian Dollar has already built a powerful foundation for further gains. USD/CAD has fallen to its lowest level in nearly a month, supported not by a single catalyst but by three reinforcing forces: a broad retreat in the US Dollar after softer inflation data, higher oil prices that strengthen Canada's export outlook, and growing expectations that the Bank of Canada may sound more hawkish than markets anticipated only a week ago.
The first two drivers have already reshaped the currency outlook. June's weaker-than-expected US CPI prompted investors to scale back Federal Reserve tightening expectations, weighing on the Dollar across major currency pairs. At the same time, Brent crude has surged above $86 as renewed US-Iran hostilities threaten energy supplies through the Strait of Hormuz. For Canada, rising oil prices are more than just a global inflation story—they improve the country's terms of trade and typically provide direct support for the Canadian Dollar, helping explain why the Loonie has outperformed most of its peers following the inflation data.
The Bank of Canada now has an opportunity either to reinforce or challenge that momentum. Economists overwhelmingly expect a sixth consecutive hold at 2.25%, making the decision itself unlikely to surprise. The more important question is whether Governor Tiff Macklem adjusts his message in response to oil's renewed surge. His previous characterization of policy as balancing weaker growth against energy-driven inflation was formed before Brent's latest rally, meaning the Monetary Policy Report may already understate current inflation risks. Markets will therefore pay closer attention to Macklem's live assessment than to the published projections.
That leaves the accompanying statement and Macklem's press conference as the key market events. Investors will focus on whether the Governor continues to describe policy as a balanced dilemma or acknowledges that the renewed energy shock has tilted inflation risks higher. Any discussion of the ongoing CUSMA trade review will also be closely watched, as it remains an important downside risk to Canada's growth outlook. Even without signaling an imminent rate increase, a modestly more hawkish tone could encourage markets to further increase expectations of tightening in early 2027, where pricing is already becoming increasingly balanced.
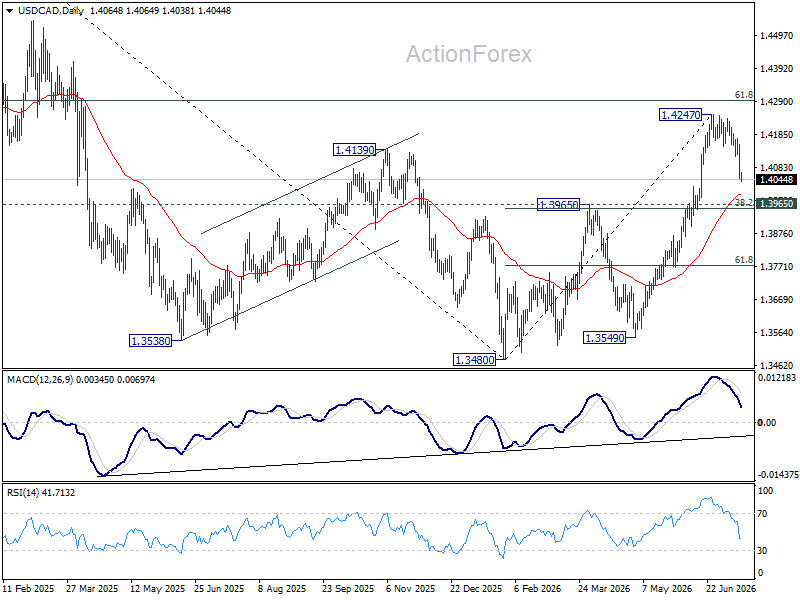
Technically, USD/CAD is approaching an important inflection point. While the decline from 1.4247 has accelerated, it is still viewed as a correction within the broader uptrend from 1.3480. Strong support is expected between former resistance at 1.3965 and 38.2% retracement of 1.3480 to 1.4247 at 1.3954. Break of 1.4159 minor resistance will indicae that the correction has completed.
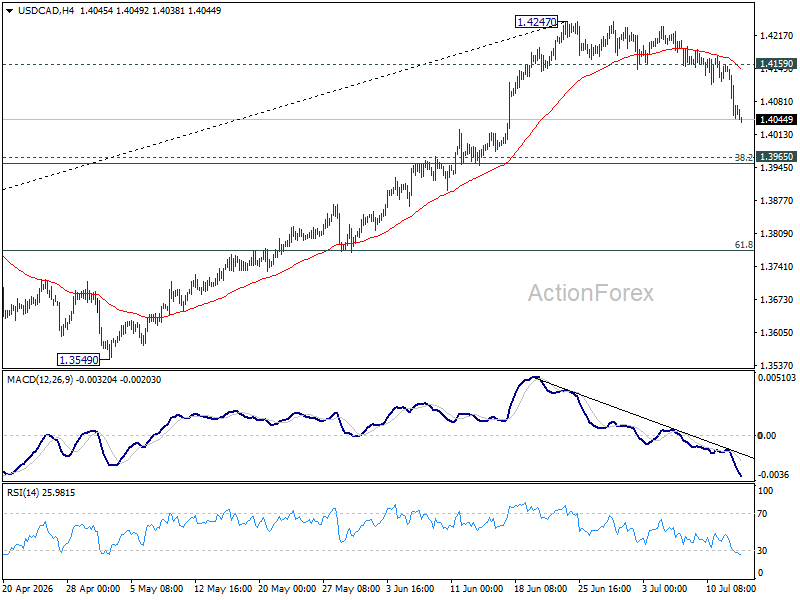
However, a decisive break below 1.3954/65 would suggest the advance from 1.3480 has completed as a three-wave corrective rebound after failing near 61.8% retracement of 1.4791 to 1.3480 at 1.4290. Such a development would shift the near-term technical outlook decisively in favour of further Canadian Dollar strength.
China’s Economy Slows to 4.3%, Weakest Growth Since 2022 Despite June Data Beat
China's economy expanded 4.3% year-on-year in the second quarter, slowing from 5.0% in the first quarter and missing expectations of 4.5%. It marked the weakest pace of growth since 2022. That left first-half GDP growth at 4.7%, only narrowly within Beijing's full-year target range of 4.5% to 5.0%. The figures underline an economy that continues to lose momentum despite pockets of resilience, with domestic demand remaining the principal weakness.
June's activity data, however, painted a somewhat more encouraging picture. Industrial production accelerated from 4.5% to 5.3% year-on-year, comfortably beating expectations, while retail sales returned to growth at 1.0% after contracting -0.6% previously. Those gains suggest manufacturing activity and household spending improved toward the end of the quarter.
Nevertheless, investment remained a significant drag. Fixed asset investment fell -5.7% year-to-date, a steeper decline than the -4.1% fall recorded previously, while property investment contracted -18.0% in the first half of the year, extending one of the economy's most persistent headwinds.
National Bureau of Statistics Deputy Director Mao Shengyong described the economy as having operated "within an appropriate range" during the first half of the year, but acknowledged that rising external uncertainty and weak domestic demand continue to weigh on the outlook. He emphasized the need to strengthen the domestic market, cultivate new sources of growth and provide greater support for employment.
Economic Data
| Indicator | Actual | Expected | Previous |
|---|---|---|---|
| GDP (Q2, YoY) | 4.3% | 4.5% | 5.0% |
| Industrial Production (YoY) | 5.3% | 4.7% | 4.5% |
| Retail Sales (YoY) | 1.0% | -0.1% | -0.6% |
| Fixed Asset Investment (YTD, YoY) | -5.7% | -4.9% | -4.1% |
| Property Investment (H1, YoY) | -18.0% | — | -16.2% |
Market Takeaways
- Q2 GDP slowed more than expected, marking China's weakest annual growth since 2022.
- Industrial production and retail sales both exceeded forecasts, suggesting activity improved toward the end of the quarter.
- Domestic demand remained the economy's weakest link despite the rebound in retail sales.
- Fixed asset investment deteriorated further, while the property sector remained a major drag on growth.
- The mixed data reinforce expectations that Beijing will need to rely more on domestic demand and structural policy support to meet its full-year growth target.
- The divergence between improving monthly activity and slowing quarterly GDP suggests the recovery remains uneven rather than broad-based.
GBP/USD Climbs with Confidence as Buyers Regain Control
Key Highlights
- GBP/USD started a fresh increase above 1.3300 and 1.3350.
- A key bullish trend line is forming with support at 1.3370 on the 4-hour chart.
- Gold struggled near $4,120 and corrected some gains.
- WTI Crude Oil prices gained pace for a move above $80.00.
GBP/USD Technical Analysis
The British Pound remained in a positive zone above 1.3320 against the US Dollar. GBP/USD corrected some gains from 1.3450, but the bulls protected losses.
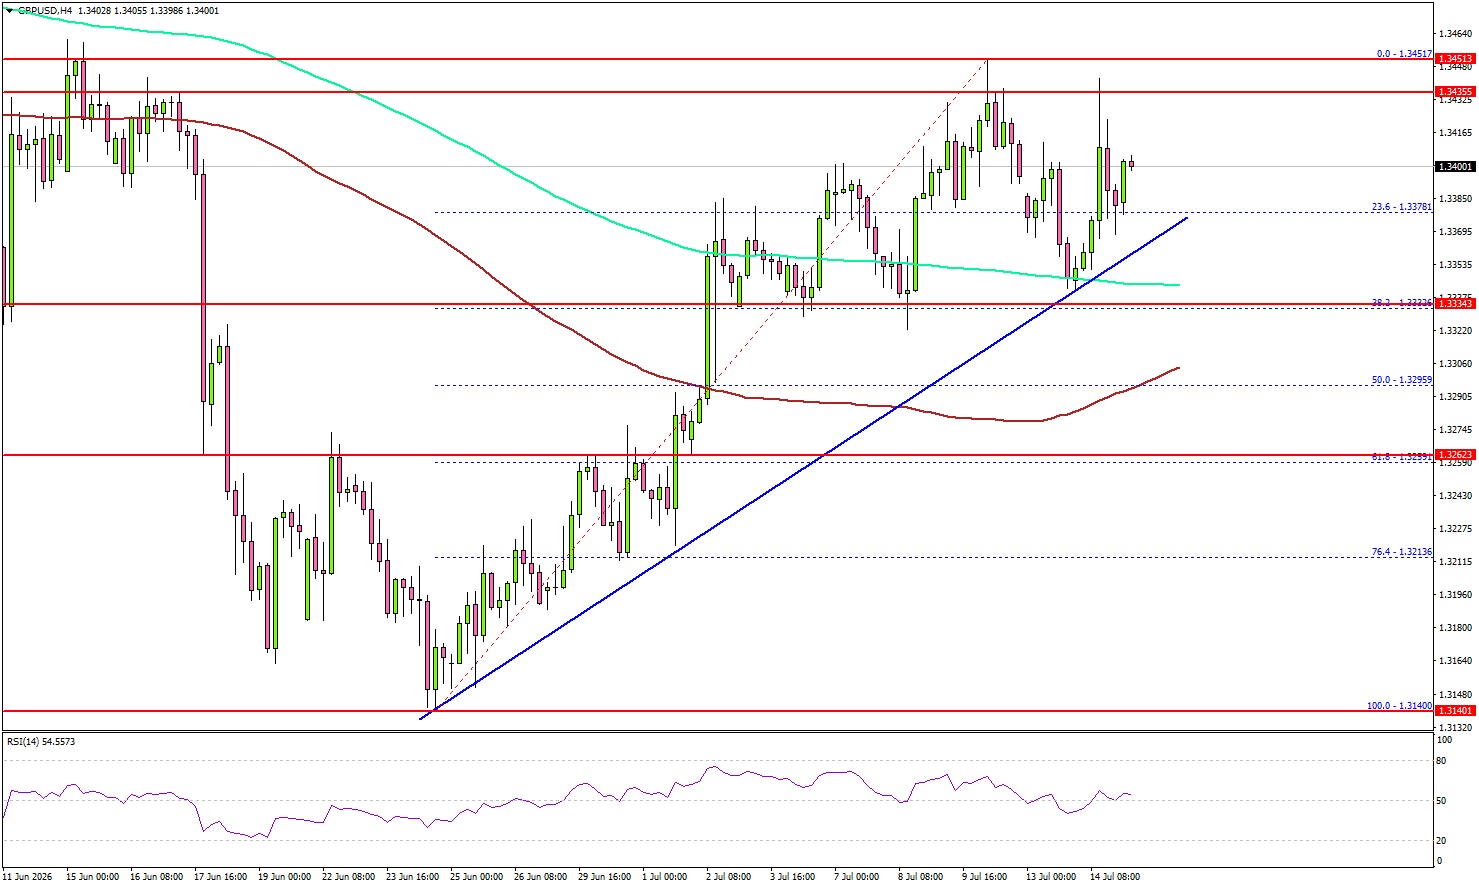
Looking at the 4-hour chart, the pair tested the 38.2% Fibonacci retracement level of the upward move from the 1.3140 swing low to the 1.3451 high. Besides, the pair remained stable above the 100 simple moving average (red, 4-hour) and the 200 simple moving average (green, 4-hour).
The pair is again rising above 1.3400. On the upside, the bears might remain active near 1.3435 and 1.3450. The next major resistance might be 1.3500.
A close above 1.3500 could start a steady increase. In the stated case, the bulls could aim for a move to 1.3620. If there is a fresh decline, the pair might find support near 1.3370. There is also a key bullish trend line forming with support at 1.3370.
The first major support could be near 1.3300 and the 100 simple moving average (red, 4-hour). A downside break and close below 1.3300 might send the pair toward the 50% Fibonacci retracement level at 1.3260. Any more losses could open the doors for a test of 1.3200.
Looking at EUR/USD, the pair recovered some losses, but the bears are still active near the 1.1475 resistance zone.
Upcoming Key Economic Events:
- US Producer Price Index for June 2026 (MoM) – Forecast 0%, versus +1.1% previous.
- US Producer Price Index for June 2026 (YoY) – Forecast +6.2%, versus +6.5% previous.
- Fed's Cook speech.
- Fed's Beige Book.