
Sample Category Title
GBP/USD Daily Outlook
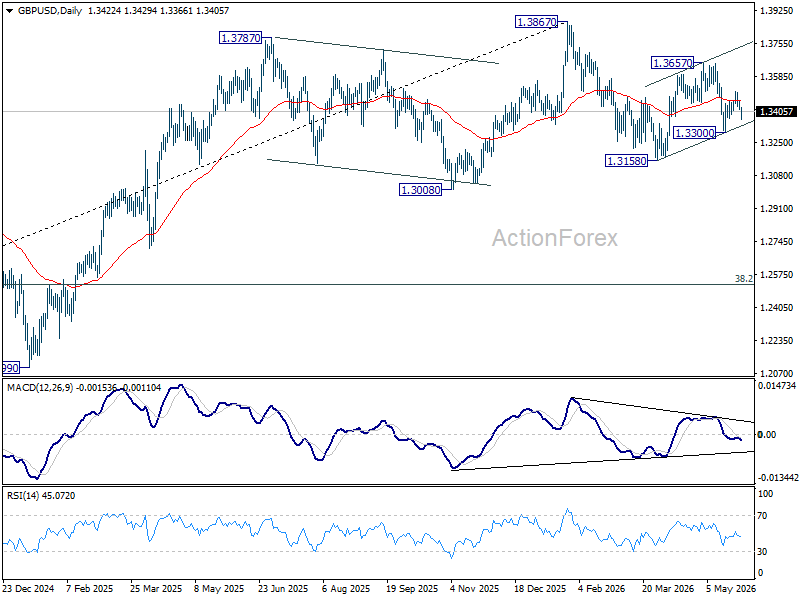
GBP/USD's break of 1.3412 suggests that recovery from 1.3300 has completed at 1.3508. Intraday bias is back on the downside. Break of 1.3300 will extend the fall from 1.3657 to 1.3158. On the upside above 1.3508 will extend the rebound from 1.3300 to 1.3657 resistance first.
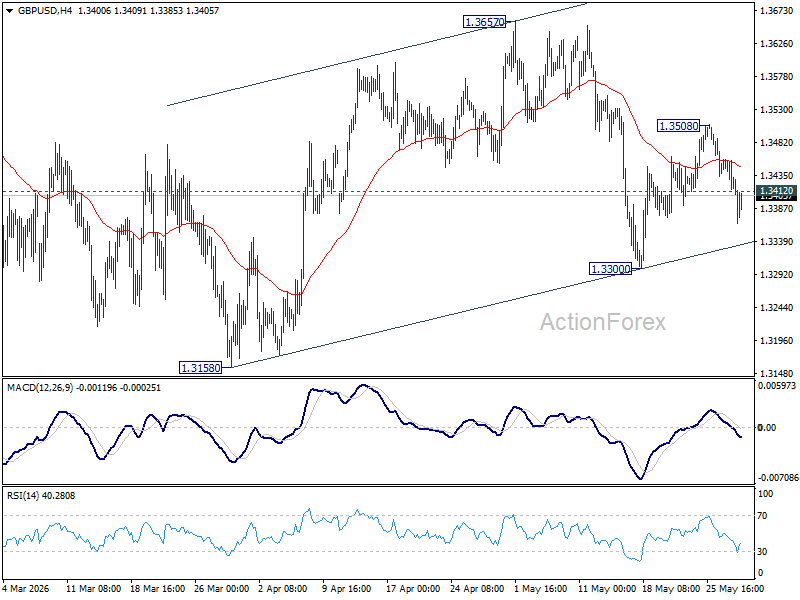
In the bigger picture, current development suggests that price actions from 1.3867 are merely a corrective pattern within the broader up trend from 1.0351 (2022 low). With 1.3008 support intact, medium term bullishness is maintained and break of 1.3867 is in favor for a later stage, towards 1.4248 key resistance (2021 high). However, firm break of 1.3008 will at least bring deeper fall to 38.2% retracement of 1.0351 to 1.3867 at 1.2524, with increased risk of bearish reversal.
USD/CHF Daily Outlook
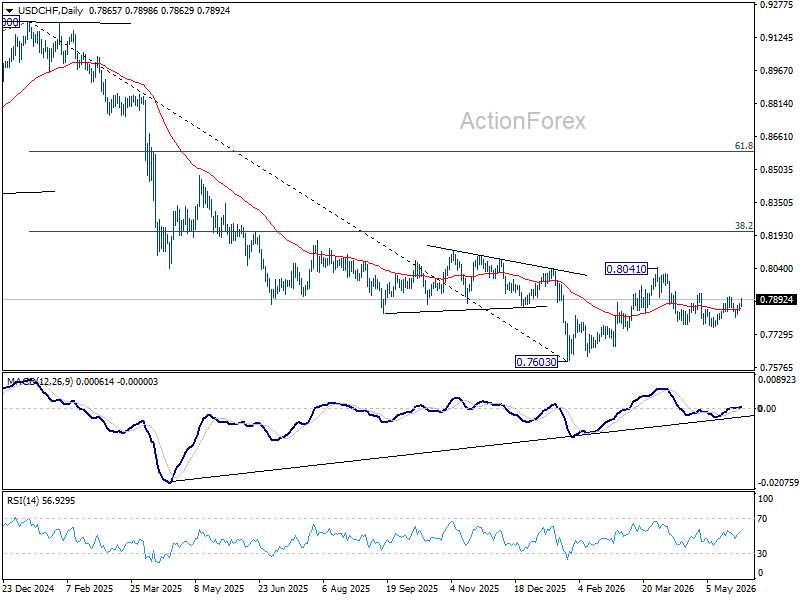
Intraday bias in USD/CHF remains neutral first. Firm break of 0.7906/23 will indicate that fall from 0.8041 has already completed as a correction. Further rally should be seen to retest 0.8041. On the downside, though, below 0.7807 will resume the fall from 0.8041 through 0.7760.
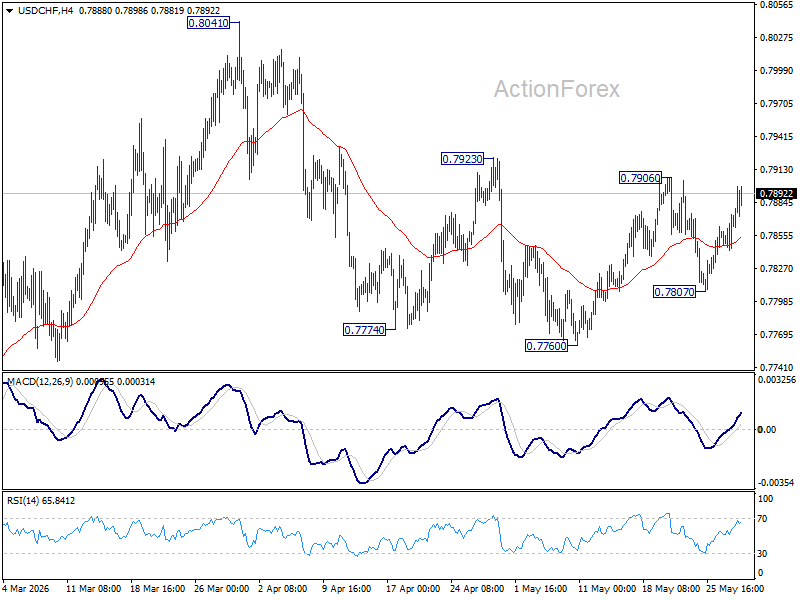
In the bigger picture, as long as 55 W EMA (now at 0.8035) holds, fall from 0.9200 is expected to continue, as part of the larger down trend. Firm break of 0.7603 will target 100% projection of 1.0146 (2022 high) to 0.8332 from 0.9200 at 0.7382.
AUD/USD Daily Report
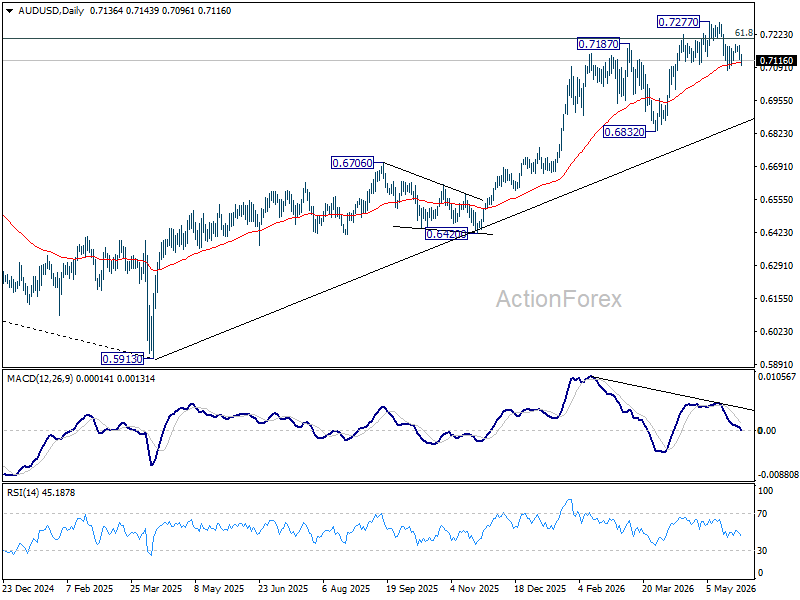
Intraday bias in AUD/USD remains neutral at this point On the upside, firm break of 0.7183 resistance will suggest that pullback from 0.7277 has completed. Stronger rally should then be seen to retest 0.7277 high. However, decisive break of 0.7076 will indicate that larger scale correction is underway and target 0.6832 support instead.
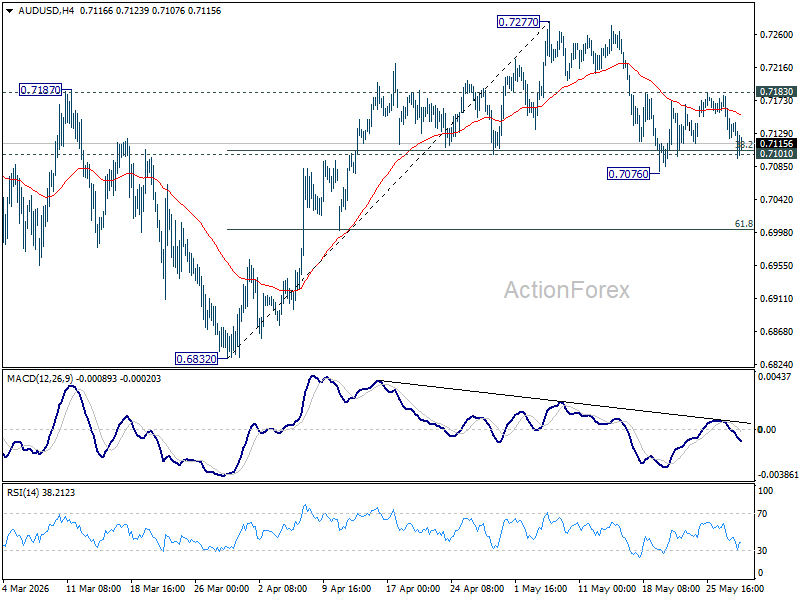
In the bigger picture, rise from 0.5913 (2024 low) is still in progress. Decisive break of 61.8% retracement of 0.8006 to 0.5913 at 0.7206 will solidify the case that it's already reversing the down trend from 0.8006 (2021 high). Further rally should then be seen to retest 0.8006. For now, outlook will remain bullish as long as 0.6832 support holds, in case of pullback.
USD/CAD Daily Outlook
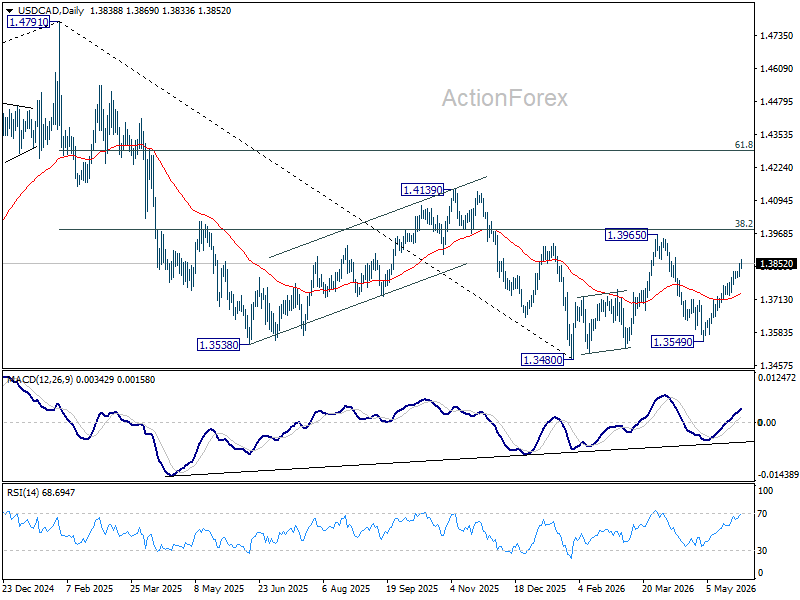
Intraday bias in USD/CAD remains on the upside at this point. Rise from 1.3549 is seen and the third leg of the pattern from 1.3480 and should target 1.3965 resistance. On the downside, below 1.3793 minor support will turn intraday bias neutral again.
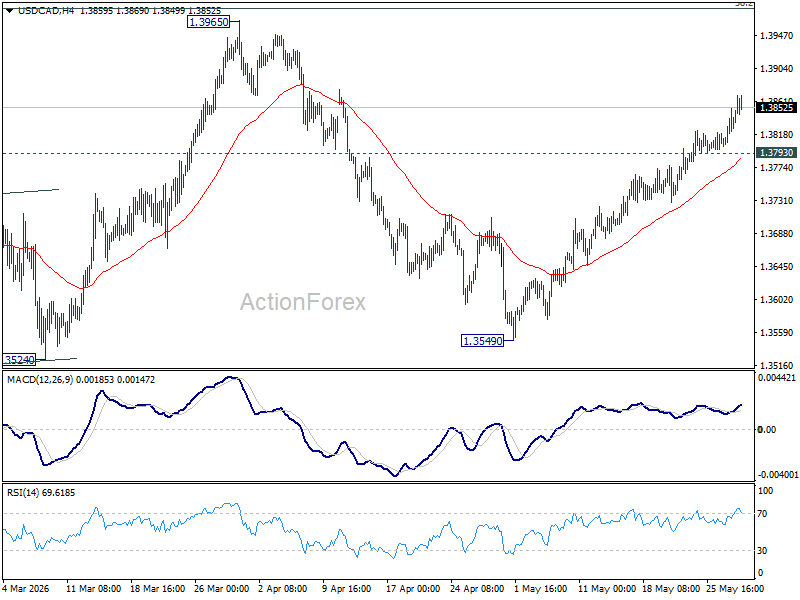
In the bigger picture, price actions from 1.4791 are seen as a corrective pattern to the whole up trend from 1.2005 (2021 low). Deeper fall could be seen, as the pattern extends, to 61.8% retracement of 1.2005 to 1.4791 at 1.3069. However, decisive break of 38.2% retracement of 1.4791 to 1.3480 at 1.3981 will argue that the correction has completed with three waves down to 1.3480 already.
GBP/JPY Daily Outlook
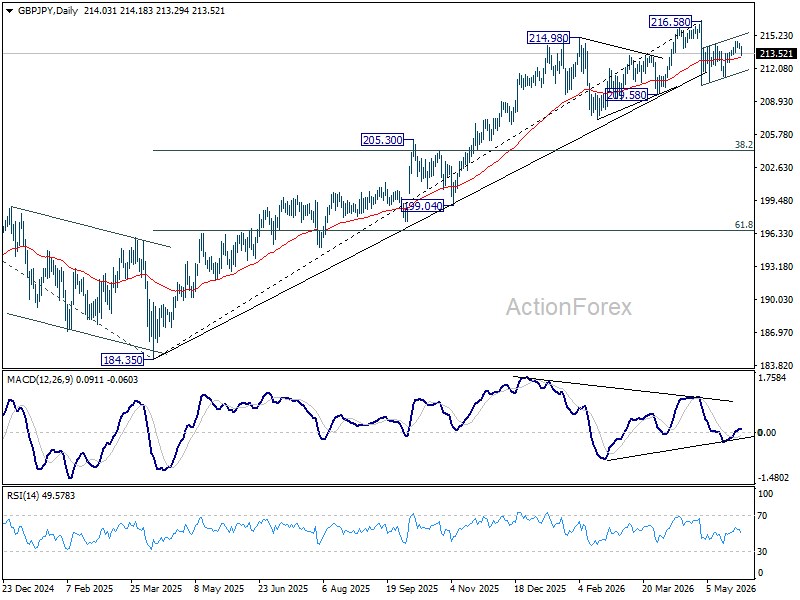
Intraday bias in GBP/JPY remains neutral at this point. On the upside, above 214.66 will extend the rebound from 210.43 to retest 216.58 high. Strong resistance should be seen there to cap upside, at least on first attempt. On the downside, below 213.25 minor support will turn bias back to the downside for 211.23 support instead.
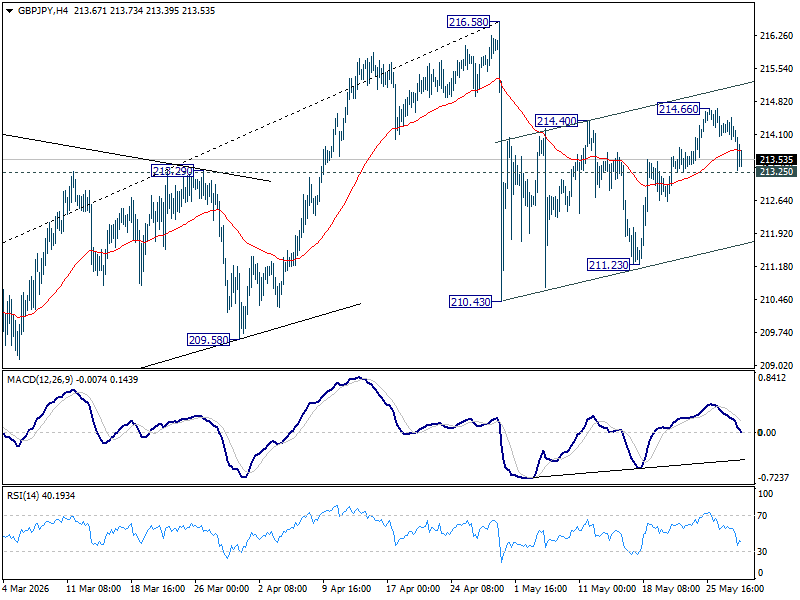
In the bigger picture, while the fall from 216.58 is steep, there is no clear sign of trend reversal yet. The long term up trend could still extend to 61.8% projection of 148.93 (2022 low) to 208.09 (2024 high) from 184.35 at 220.90 on resumption. However, sustained break of 55 W EMA (now at 206.27) will argue that it's already in medium term down trend for 184.35 support.
EUR/JPY Daily Outlook
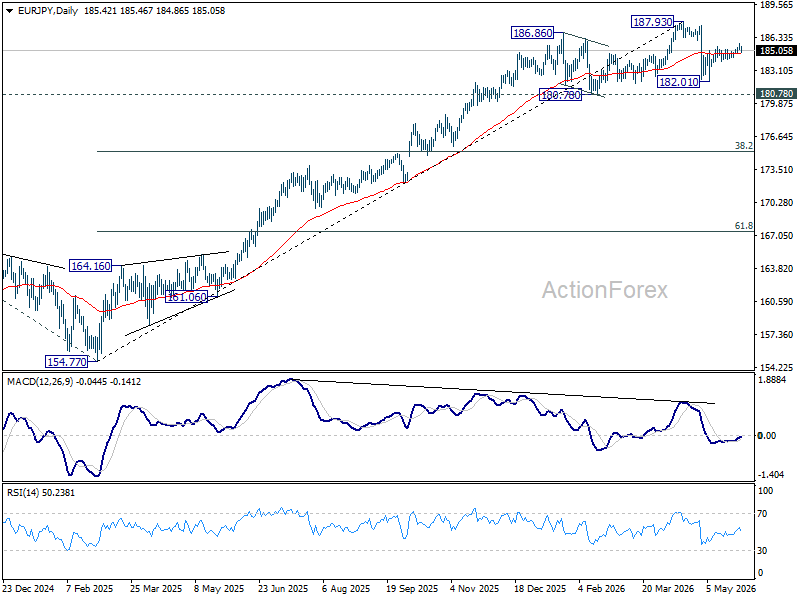
Intraday bias in EUR/JPY is turned neutral again with current retreat. Rebound from 182.01 is seen as the second leg of the corrective pattern from 187.93. Above 185.77 will target a retest on 187.93 high. Nevertheless, firm break of 184.42 will suggest that the rebound has completed, and turn bias back to the downside for 182.01.
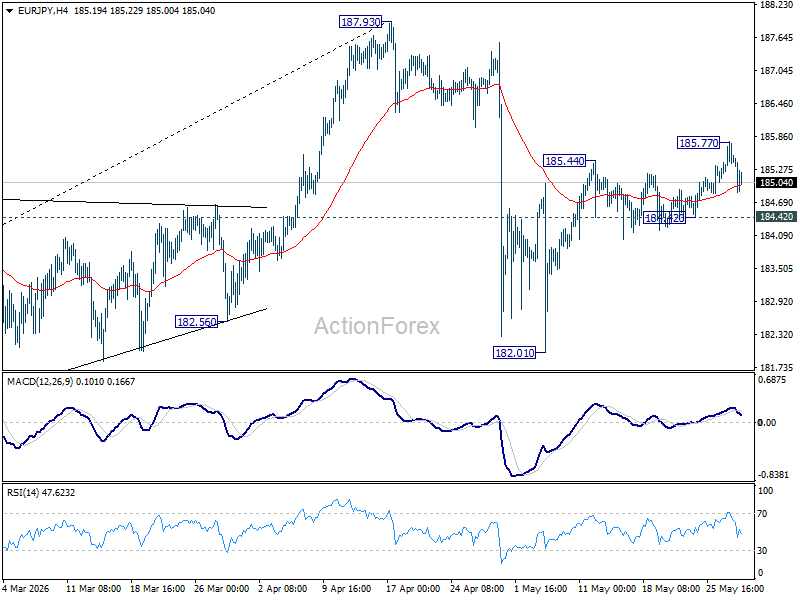
In the bigger picture, the pullback from 187.93 is steep, there is no sign of reversal yet. Uptrend from 114.42 (2020 low) is still expected to resume at a later stage to 78.6% projection of 124.37 (2022 low) to 175.41 (2025 high) from 154.77 at 194.88. However, sustained break of 55 W EMA (now at 178.51) will argue that it's already in a medium term down trend to 175.41 resistance turned support and below.
EUR/GBP Daily Outlook
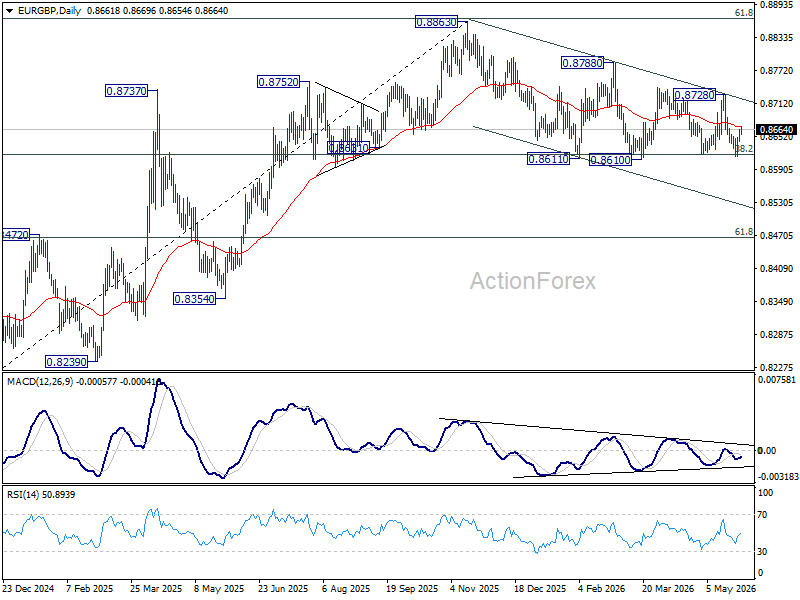
Intraday bias in EUR/GBP stays neutral as range trading continues. On the downside, decisive break of 0.8610 support will revive the case of bearish trend reversal. Deeper decline should be seen to 61.8% retracement of 0.8221 to 0.8863 at 0.8466. On the upside, break of 0.8728 resistance will bring stronger rally back towards 0.8740 resistance.
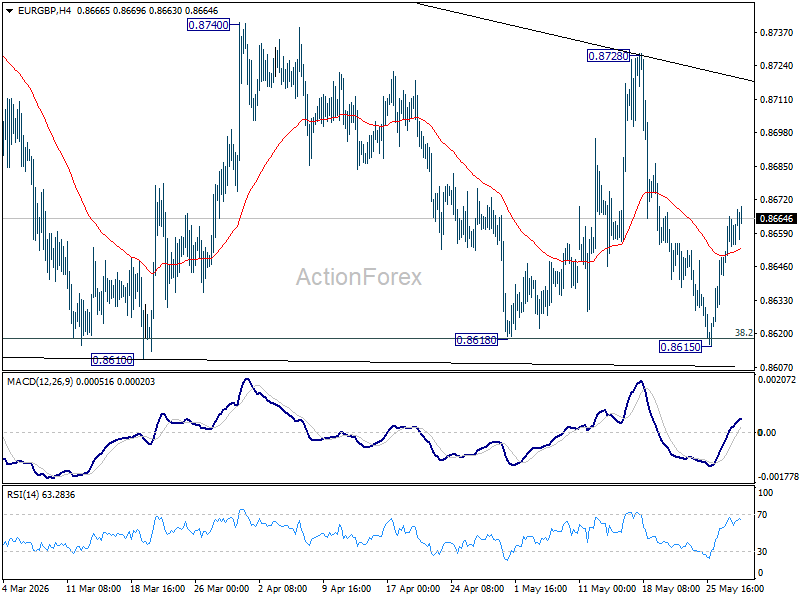
In the bigger picture, focus is staying on 38.2% retracement of 0.8821 to 0.8863 at 0.8618. Strong rebound from there will retain medium term bullishness. Rise from 0.8221 should resume through 0.8863 at a later stage. Nevertheless, sustained break of 0.8618 will confirm that whole rise from 0.8221 has completed at 0.8863. Deeper decline should then be seen to 61.8% retracement at 0.8466 at least.
EUR/AUD Daily Outlook
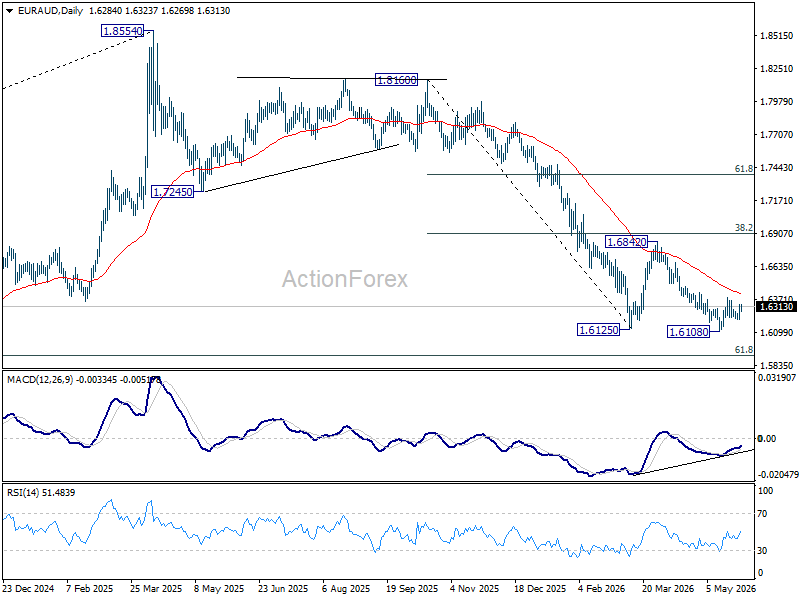
Intraday bias in EUR/AUD remains neutral for the moment. Rise from 1.6108 is tentatively seen as the third leg of the pattern from 1.6125. Above 1.6381 will target 55 D EMA (now at 1.6416) and above. Nevertheless, firm break of 1.6108 will resume the larger down trend from 1.8554.

In the bigger picture, fall from 1.8554 (2025 high) is in progress and deeper decline should be seen to 61.8% retracement of 1.4281 to 1.8554 at 1.5913, which is slightly below 1.5963 structural support. Decisive break there will pave the way back to 1.4281 (2022 low). For now, risk will stay on the downside as long as 55 W EMA (now at 1.6984) holds, even in case of strong rebound.
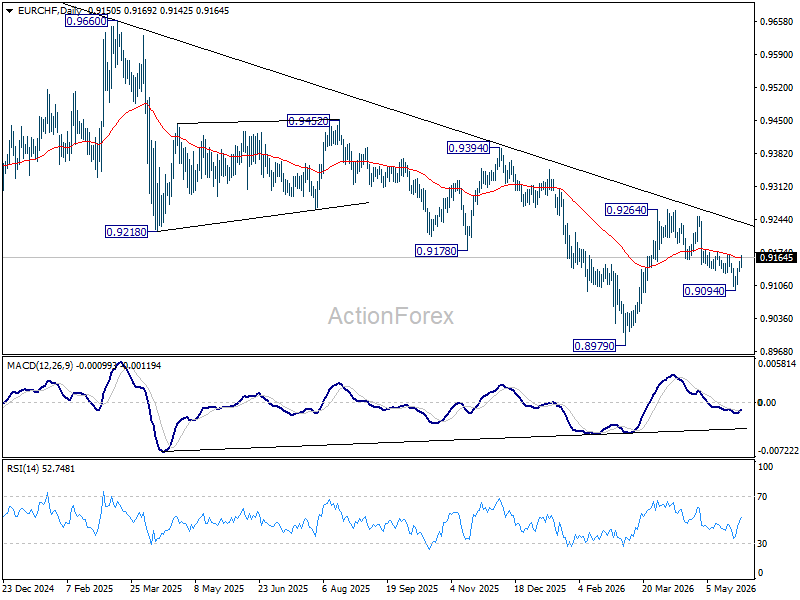
EUR/CHF Daily Outlook
Immediate focus is now on 0.9167 resistance as EUR/CHF's rebound from 0.9094 exrtends higher today. Firm break there will argue that fall from 0.9264 has completed as a corrective move. More important, that would argue that rise from 0.8979 is ready to resume. Intraday bias will be back on the upside for 0.9264 first. Nevertheless, rejection by 0.9167, followed by break of 0.9094, will retain the original bearish view and bring retest of 0.8979 low.
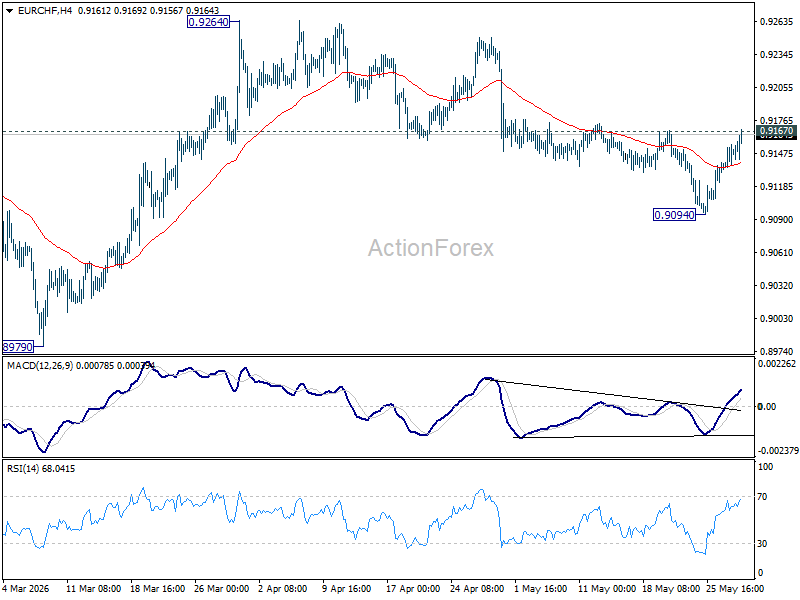
In the bigger picture, the rejection by 55 W EMA (now at 0.9252) suggests that the down trend from 0.9928 (2024 high) is still in progress. Firm break of 0.8979 will confirm down trend resumption. Outlook will stay bearish as long as 0.9394 resistance holds, in case of another rebound.
Crypto Market Has Broken Through a Key Support Level
Market Overview
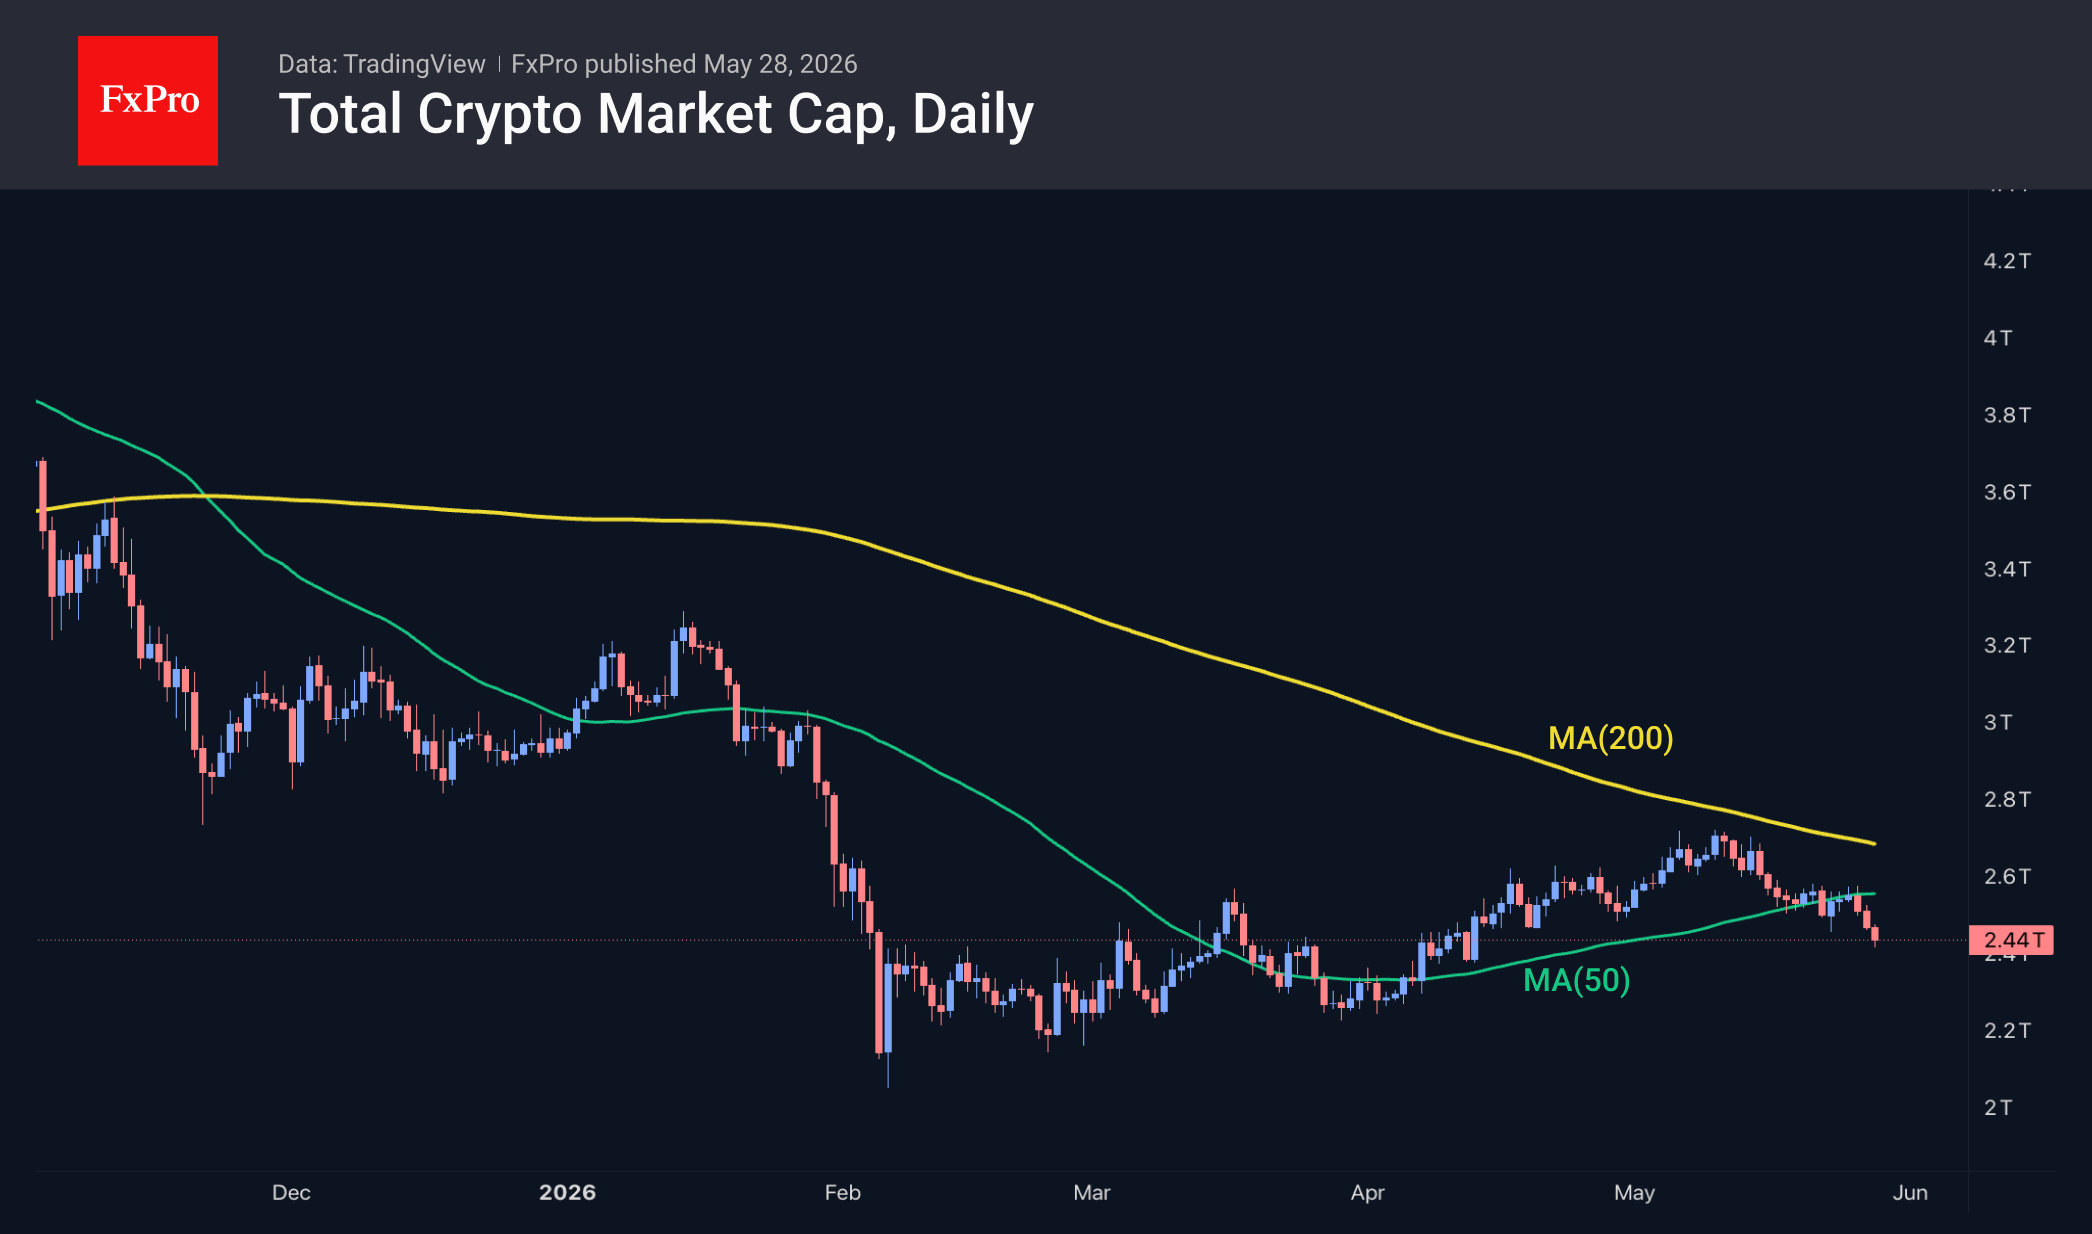
The crypto market has lost around 3.5%, falling to a market capitalisation of $2.44 trillion and sharply breaking through the local support level seen in recent weeks. Technically, this is a worrying sign, as the market has fallen below the 50-day moving average, which could herald further sell-offs. The nearest potential stop is not before $2.30T. In a falling market, Stellar (+14.6%) and Basic Attention Token (+1.5%) stand out, but the third-ranked altcoin, BNB, has lost 3% over the past 24 hours. The worst performers among the most popular were Internet Computer (-9.6%), Zcash (-8.7%) and Dash (-8.7%).
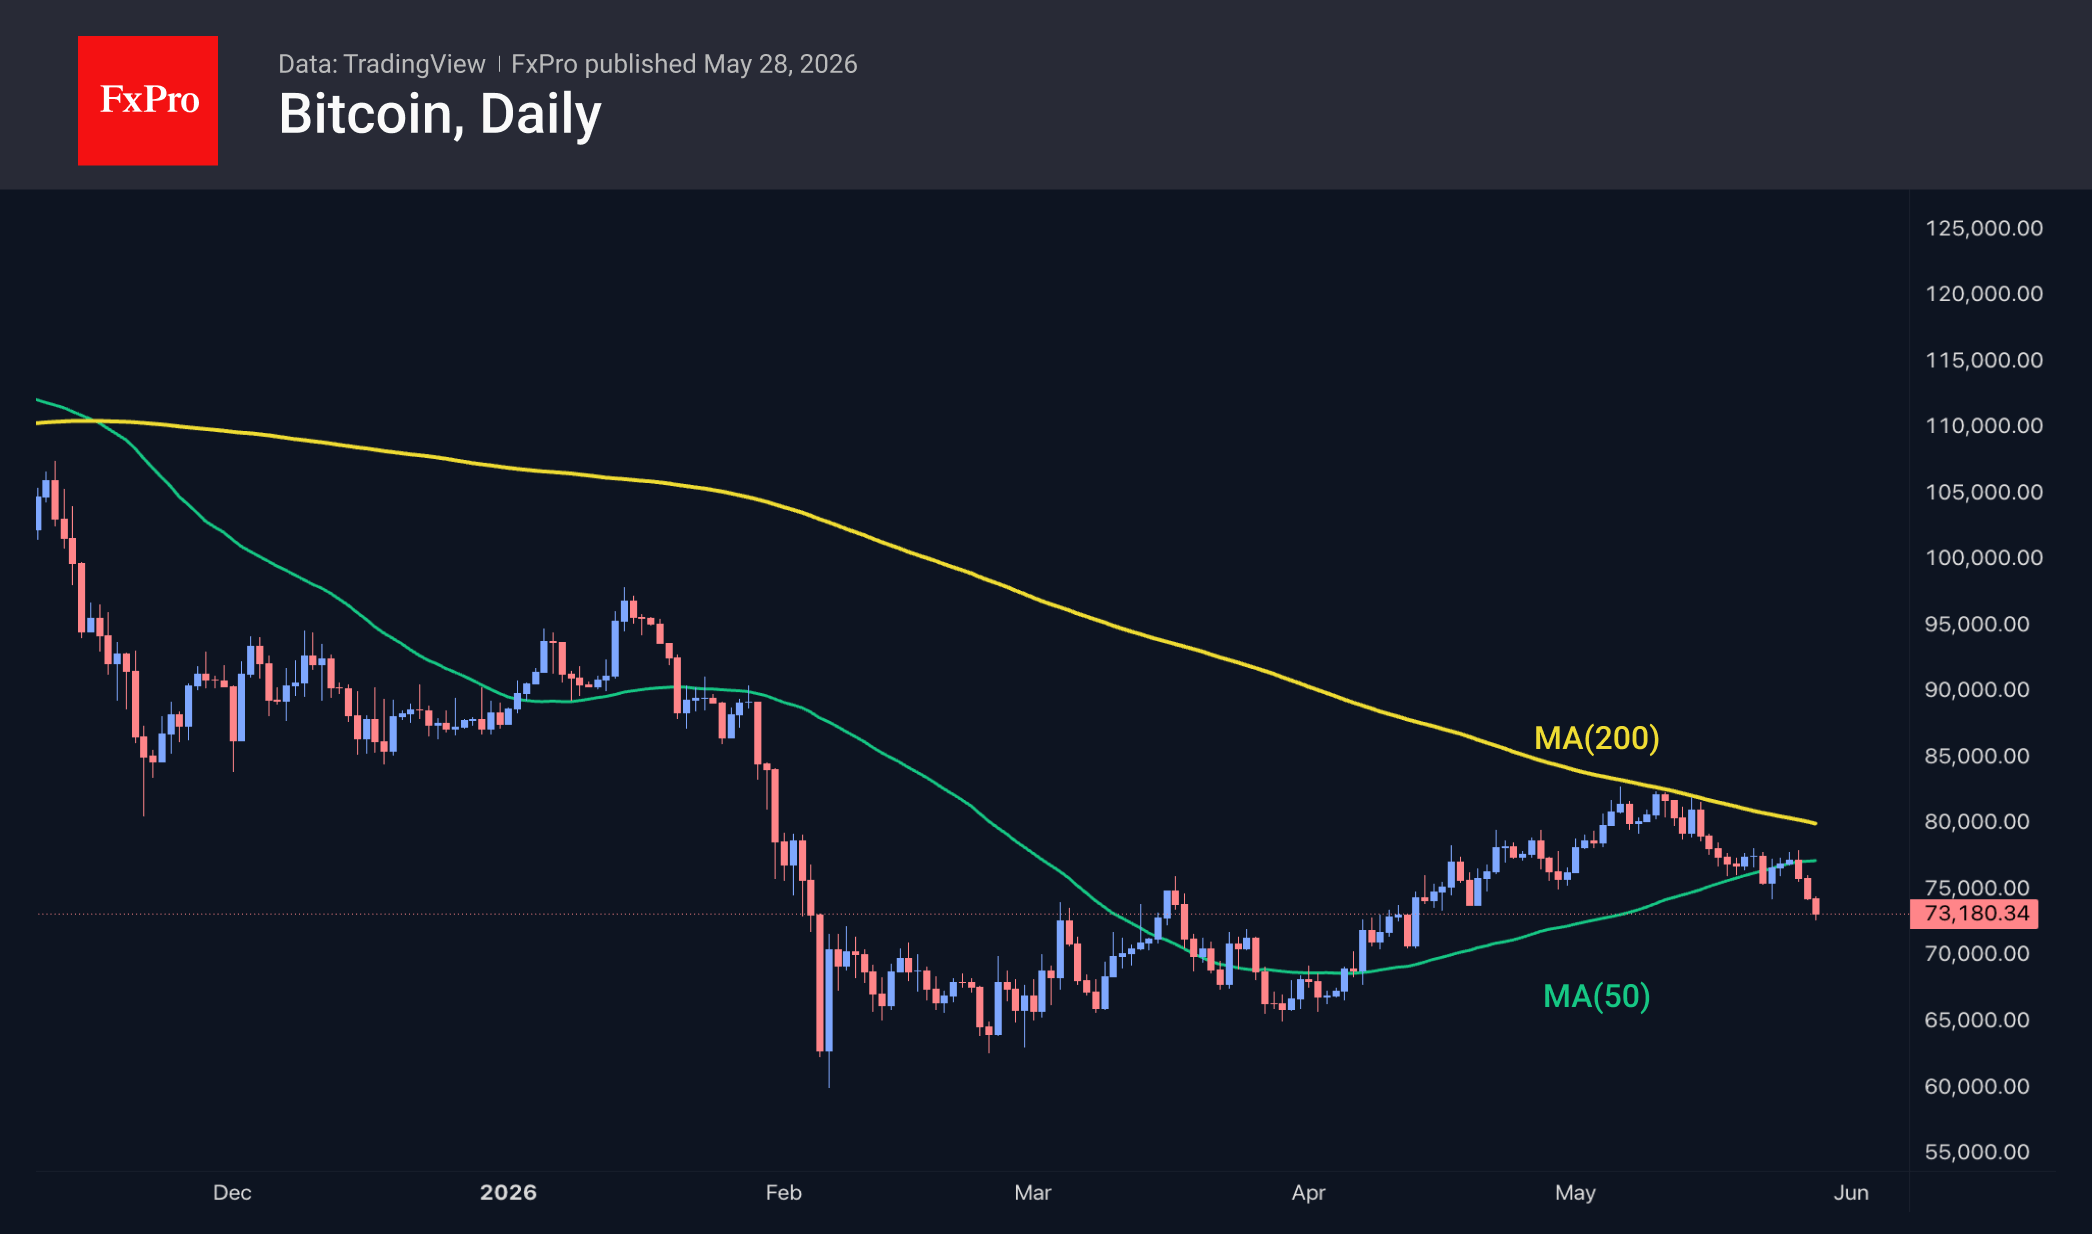
Bitcoin has plummeted to $73K, a level not seen since mid-April. The bearish signal from the previous day, with the price falling below the 50-day moving average, is confirmed by market dynamics, which show that selling pressure on the leading cryptocurrency is intensifying. We have witnessed a classic victory of the long-term bearish trend, represented by the falling 200-day MA, over the short-term upward trend, represented by the 50-day MA. The outcome was not a foregone conclusion, but it seems the time for a long-term bull market has not yet come.
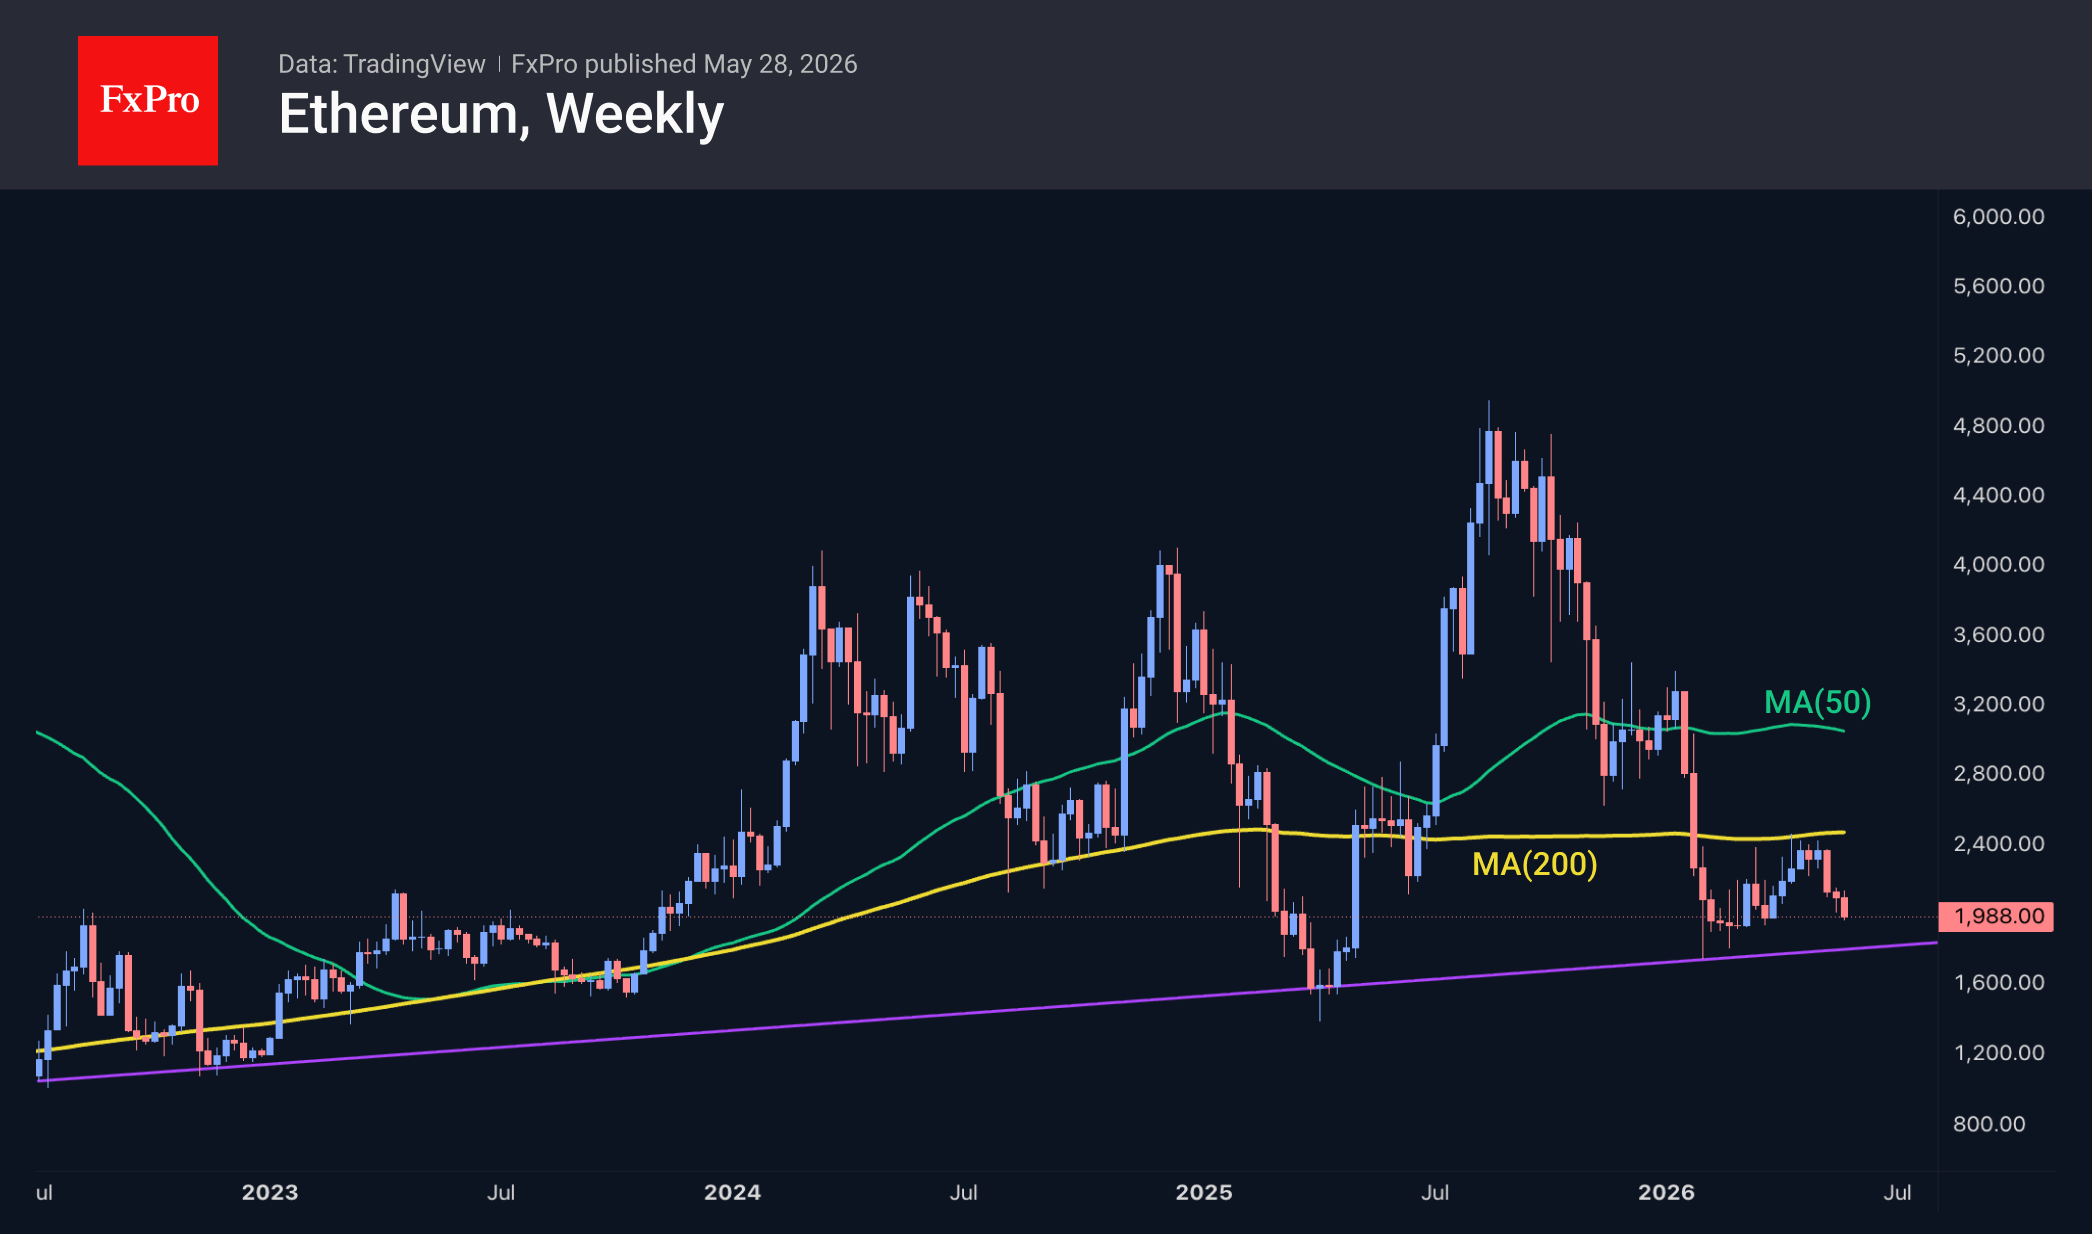
Ethereum has fallen below $2K, a psychologically significant round figure. Having begun its decline in early May, the second-largest coin has wiped out its April gains and once again finds itself near a multi-year support line, from which ETH rebounded at the start of the year and in April last year.
News Background
An unknown trader sold BlackRock’s Bitcoin ETF shares on Tuesday for a massive $1.3 billion, Galaxy Digital notes. This led to a sharp drop in Bitcoin below $76K. Outflows from US Bitcoin ETFs have continued for seven consecutive trading sessions and remain the main threat to the leading cryptocurrency, Wintermute notes.
Bitcoin has entered a high-risk zone amid mounting selling pressure and escalating international tensions, investment firm Swissblock notes. A further negative factor has been the decline in interest in spot Bitcoin ETFs.
“Ethereum evangelist” David Hoffman has sold all his holdings of the second-largest cryptocurrency and no longer expects it to grow significantly. In his view, ETH has failed to become the universal asset that many supporters of the project had hoped for. Meanwhile, the bulk of revenue has shifted to second-layer networks.
BitMine made the largest Ethereum purchase of the year last week. The company increased its holdings by 111,942 ETH, worth over $237 million. BitMine’s reserves exceeded 5.39 million ETH — that is 4.47% of the Ethereum supply. The company’s CEO, Tom Lee, described the fall of ETH below $2.2K as an ‘attractive opportunity’ to build up positions.
NEAR Protocol (NEAR), a layer-one blockchain positioning itself as the “blockchain for artificial intelligence”, has surged by 100% over the past month. The rally coincided with the announcement of a series of blockchain updates on privacy, cross-chain transfers, AI user data protection, and network scaling.