Sample Category Title
USD/JPY Mid-Day Outlook
Daily Pivots: (S1) 158.43; (P) 158.98; (R1) 159.36; More...
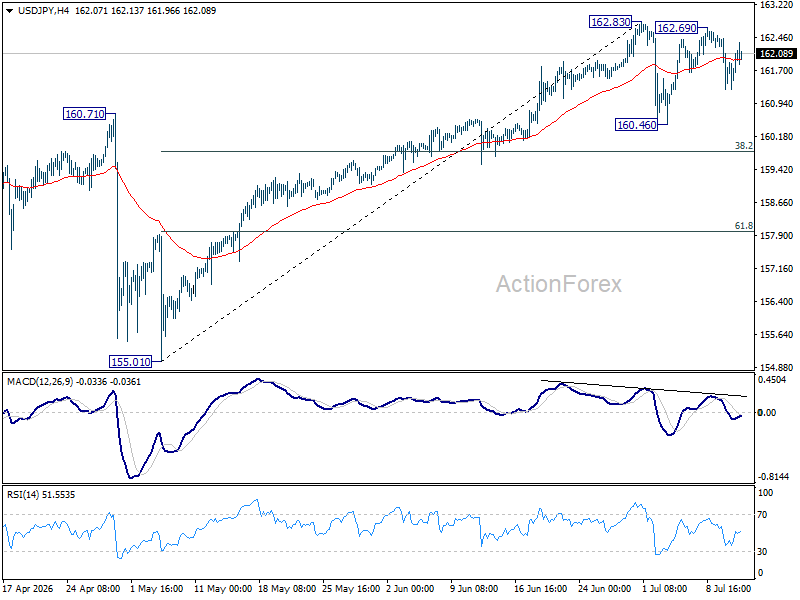
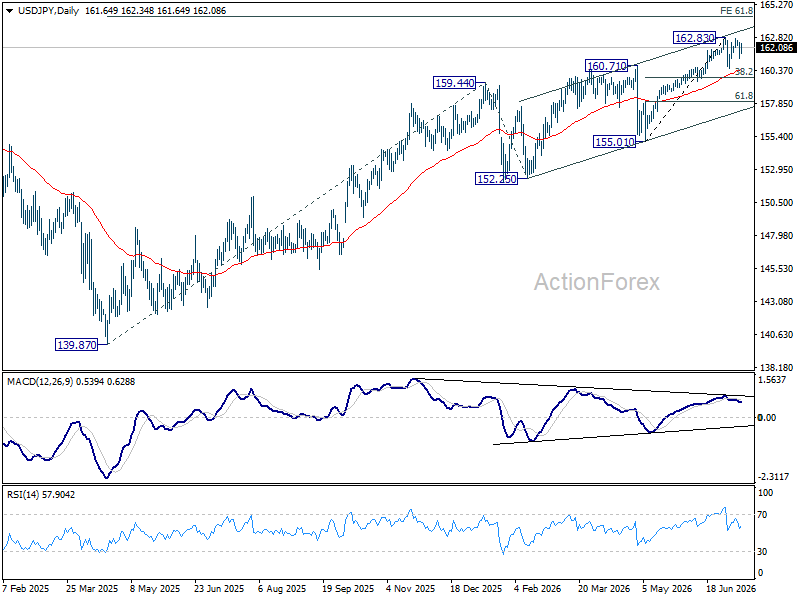
Intraday bias in USD/JPY stays neutral as consolidations continue below 160.45. Outlook will stay bullish as long as 157.49 cluster support (38.2% retracement of 152.25 to 160.45 at 157.31) holds. On the upside break of 160.45 will target a retest on 161.94 high. However, firm break of 157.31/49 will bring deeper fall back to 61.8% retracement at 155.38 next.
In the bigger picture, outlook is unchanged that corrective pattern from 161.94 (2024 high) should have completed with three waves at 139.87. Larger up trend from 102.58 (2021 low) could be ready to resume through 161.94. This will remain the favored case as long as 55 W EMA (now at 155.24) holds. Firm break of 161.94 will pave the way to 61.8% projection of 102.58 to 161.94 from 139.87 at 176.75.
USD/CHF Mid-Day Outlook
Daily Pivots: (S1) 0.7785; (P) 0.7814; (R1) 0.7838; More….
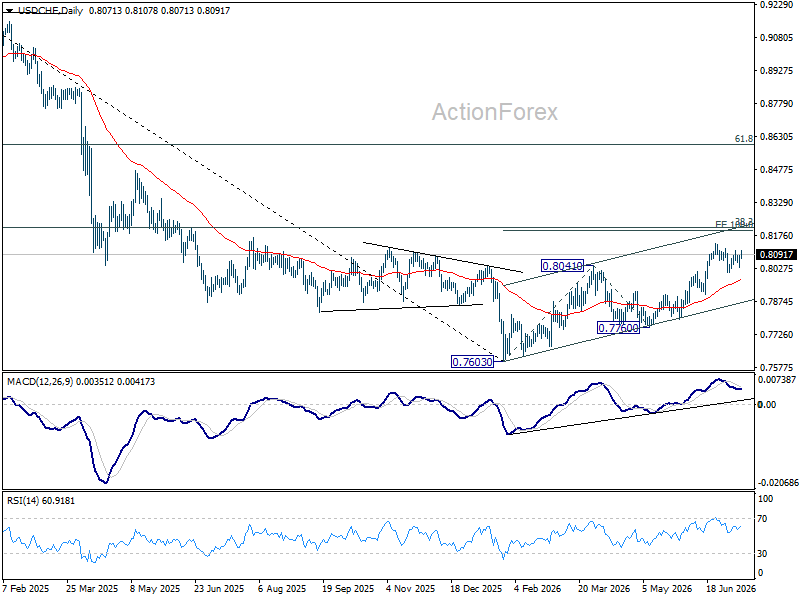
Intraday bias in USD/CHF stays mildly on the downside despite some loss of momentum. Fall from 0.8041 is in progress for 61.8% retracement of 0.7603 to 0.8041 at 0.7770. Decisive break there will target a retest on 0.7603 low. On the upside, above 0.7868 minor resistance will turn intraday bias neutral first.
In the bigger picture, rebound from 0.7603 medium term bottom is seen as correcting the fall from 0.9200 only. Rejection by 55 W EMA (now at 0.8071) will affirm this bearish case, and setup down trend resumption to 100% projection of 1.0146 (2022 high) to 0.8332 from 0.9200 at 0.7382 at a later stage. Though, sustained break of 55 W EMA will suggest that it's probably correcting the larger scale down trend from 1.0146 (2022 high).
GBP/USD Mid-Day Outlook
Daily Pivots: (S1) 1.3512; (P) 1.3551; (R1) 1.3605; More...
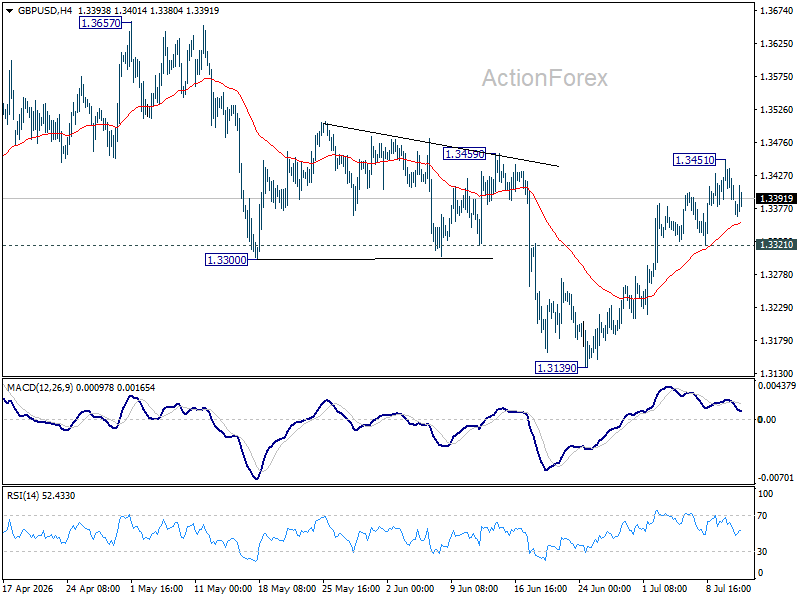
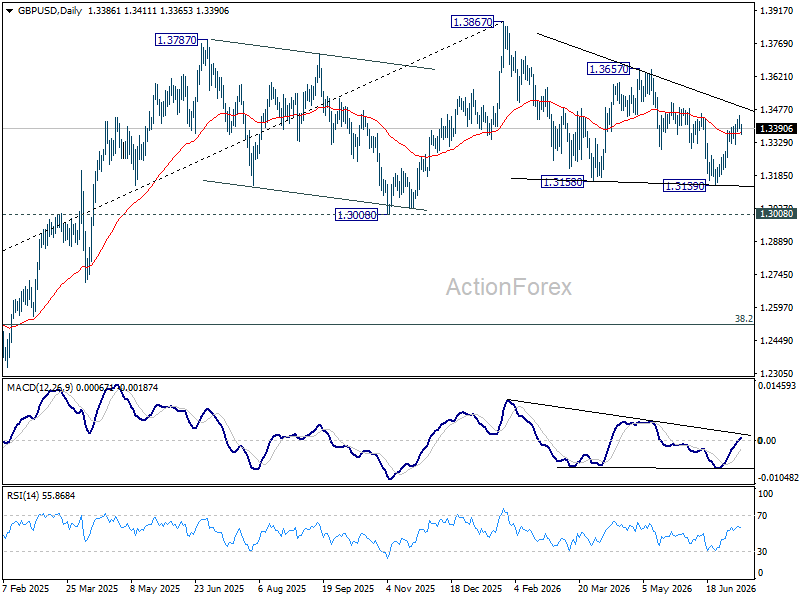
Intraday bias in GBP/USD remains mildly on the upside despite some loss of momentum. Firm break of 61.8% retracement of 1.3867 to 1.3158 at 1.3596 will extend the rise from 1.3158 to retest 1.3867 high. On the downside, below 1.3483 minor support will turn intraday bias neutral first.
In the bigger picture, current development suggests that price actions from 1.3867 are merely a corrective pattern within the broader up trend from 1.0351 (2022 low). With 1.3008 support intact, medium term bullishness is maintained and break of 1.3867 is back in favor for a later stage, towards 1.4248 key resistance (2021 high).
EUR/USD Mid-Day Outlook
Daily Pivots: (S1) 1.1763; (P) 1.1788; (R1) 1.1820; More….
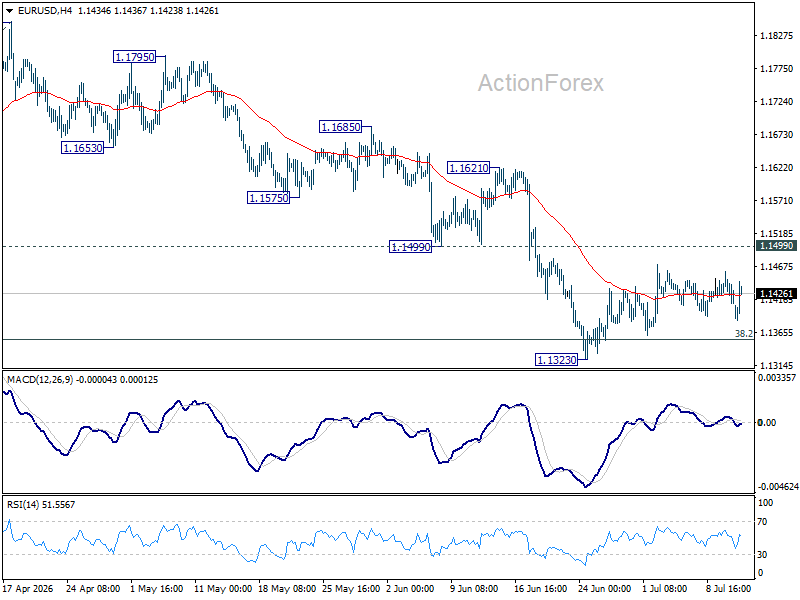
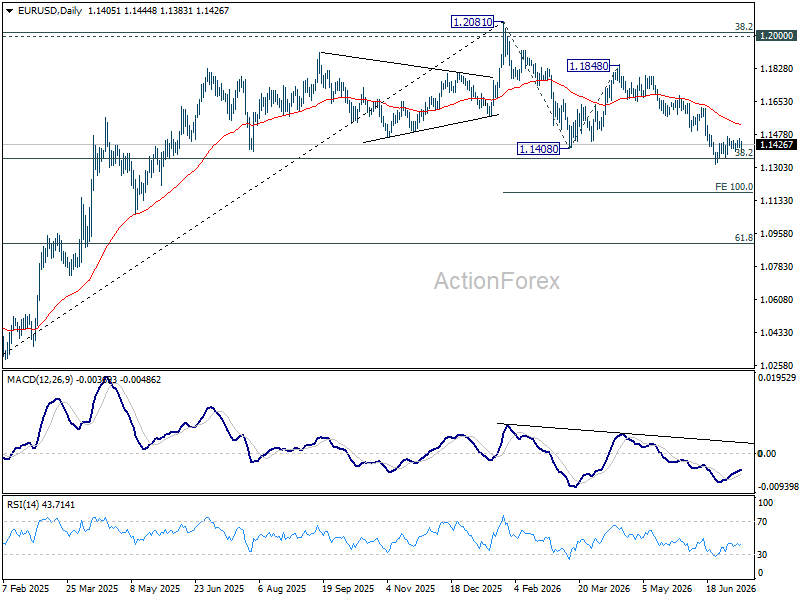
Intraday bias in EUR/USD stays mildly on the upside despite some loss of upward momentum. Decisive break of 61.8% retracement of 1.2081 to 1.1408 at 1.1824 will extend the rally from 1.1408 to retest 1.2081 high. On the downside, below 1.1739 minor support will turn intraday bias neutral first.
In the bigger picture, the strong support from 38.2% retracement of 1.0176 to 1.2081 at 1.1353 suggests that the pullback from 1.2081 is more likely a corrective move. Strong support was also found in 55 W EMA (now at 1.1513). Focus is back on 1.2 key cluster resistance level. Decisive break there will carry long term bullish implications. Nevertheless, break of 1.1408 support will revive the case of medium term bearish trend reversal.
Risk Rally Stalls as Front-Running Peaks, Markets Await Deliverables from Second US-Iran Talks
Risk rally is pausing as anticipation gives way to verification. Equity gains are stalling near record levels as markets move from pricing a US-Iran deal to waiting for actual delivery, with renewed talks likely in the coming days. Oil’s pullback on diplomatic optimism has taken pressure off inflation expectations, while Dollar consolidates losses, signaling a market that has run ahead of events and is now in wait-and-see mode.
A key driver behind the earlier rally was the steady unwind of the war premium. As prospects for renewed negotiations emerged, the “fear bid” in oil faded quickly, removing a major support for Dollar and easing pressure on global risk assets. However, with that repricing largely complete, markets now lack a fresh catalyst to extend gains further.
Comments from US President Donald Trump have reinforced the perception that the conflict is nearing its endgame. In a Fox Business interview, he said the war is “very close to over” and added that “they want to make a deal very badly.” Still, markets are no longer reacting to rhetoric alone. The next phase hinges on whether the anticipated second round of talks—expected within the next two days—can deliver tangible progress.
Focus is firmly on whether there will be a ceasefire extension or, even better, a “bridge deal” that provides a pathway toward a more durable settlement. Markets appears to be cautiously leaning toward the latter, but confirmation is still lacking yet.
On the monetary policy front, attention is also turning to the Federal Reserve outlook. Trump expressed optimism that his nominee, Kevin Warsh, could be confirmed as the next Fed Chair as soon as next week. He also indicated that interest rates would likely decline once Warsh takes office.
Warsh’s confirmation process will be closely watched, particularly given its implications for Fed independence and the future path of rates. Chair Tim Scott noted that the Senate Banking Committee will focus on inflation, economic conditions, and institutional independence during the hearings.
In the currency markets, Dollar remains the worst performer for the week so far despite today's recovery. Yen is the second worst, followed by Loonie. Aussie is now the strongest, followed by Kiwi, and the Swiss Franc. Euro and Sterling are positioning in the middle of the ladder.
In Europe, at the time of writing, FTSE is up 0.12%. DAX is up 0.09%. CAC is down -0.53%. UK 10-year yield is up 0.02 at 4.745. Germany 10-year yield is up 0.019 at 3.042. Earlier in Asia, Nikkei rose 0.44%. Hong Kong HSI rose 0.29%. China Shanghai SSE rose 0.01%. Singapore Strait Times rose 0.27%. Japan 10-year JGB yield fell -0.016 at 2.403.
Bitcoin Rallies Without Conviction, Clarity Act Uncertainty to Cap Break Above $80K
Bitcoin is rising—but without conviction. Despite improving risk sentiment, uncertainty around the Clarity Act and Senate delays cap upside momentum. With a narrow window for progress before the US election cycle takes over, regulatory clarity may remain out of reach—leaving $80K as both a technical and policy ceiling. Read more.
WTI Drops Below $90, $80 Next If US-Iran Talks Deliver ‘Bridge Deal’
WTI has slipped below $90 as markets bet a second round of US-Iran talks could deliver a ceasefire extension or even a “bridge deal,” paving the way toward $80. With the war premium unwinding, traders are front-running a path to de-escalation rather than waiting for confirmation. Read more.
Eurozone Industrial Production Rises 0.4%, Led by Capital and Consumer Goods
Eurozone industrial production rose more than expected in February, with strength in capital goods and non-durable output offsetting declines in energy. The data points to a modest but uneven recovery in the sector. Read more.
EUR/USD Mid-Day Outlook
Daily Pivots: (S1) 1.1763; (P) 1.1788; (R1) 1.1820; More….
Intraday bias in EUR/USD stays mildly on the upside despite some loss of upward momentum. Decisive break of 61.8% retracement of 1.2081 to 1.1408 at 1.1824 will extend the rally from 1.1408 to retest 1.2081 high. On the downside, below 1.1739 minor support will turn intraday bias neutral first.
In the bigger picture, the strong support from 38.2% retracement of 1.0176 to 1.2081 at 1.1353 suggests that the pullback from 1.2081 is more likely a corrective move. Strong support was also found in 55 W EMA (now at 1.1513). Focus is back on 1.2 key cluster resistance level. Decisive break there will carry long term bullish implications. Nevertheless, break of 1.1408 support will revive the case of medium term bearish trend reversal.
Eurozone Industrial Production Rises 0.4%, Led by Capital and Consumer Goods
Eurozone industrial production rose 0.4% mom in February, coming in above expectations of a 0.2% increase and signaling a modest recovery in manufacturing activity.
The breakdown shows a mixed but generally constructive picture in Eurozone. Output of capital goods rose 1.0% and intermediate goods increased 0.5%, pointing to continued investment activity and supply chain resilience. Non-durable consumer goods also saw a solid 2.6% rise. However, energy production declined by -2.1%, while durable consumer goods fell by -1.3%, highlighting pockets of weakness.
Across the broader EU, industrial production also rose 0.4% mom, with strong gains in Ireland (+5.7%), Finland (+3.3%), and Sweden (+3.2%). On the downside, Malta (-6.0%), Luxembourg (-4.6%), and Greece (-2.1%) recorded the sharpest declines.
Gold in Positive Territory: External Backdrop Remains Supportive
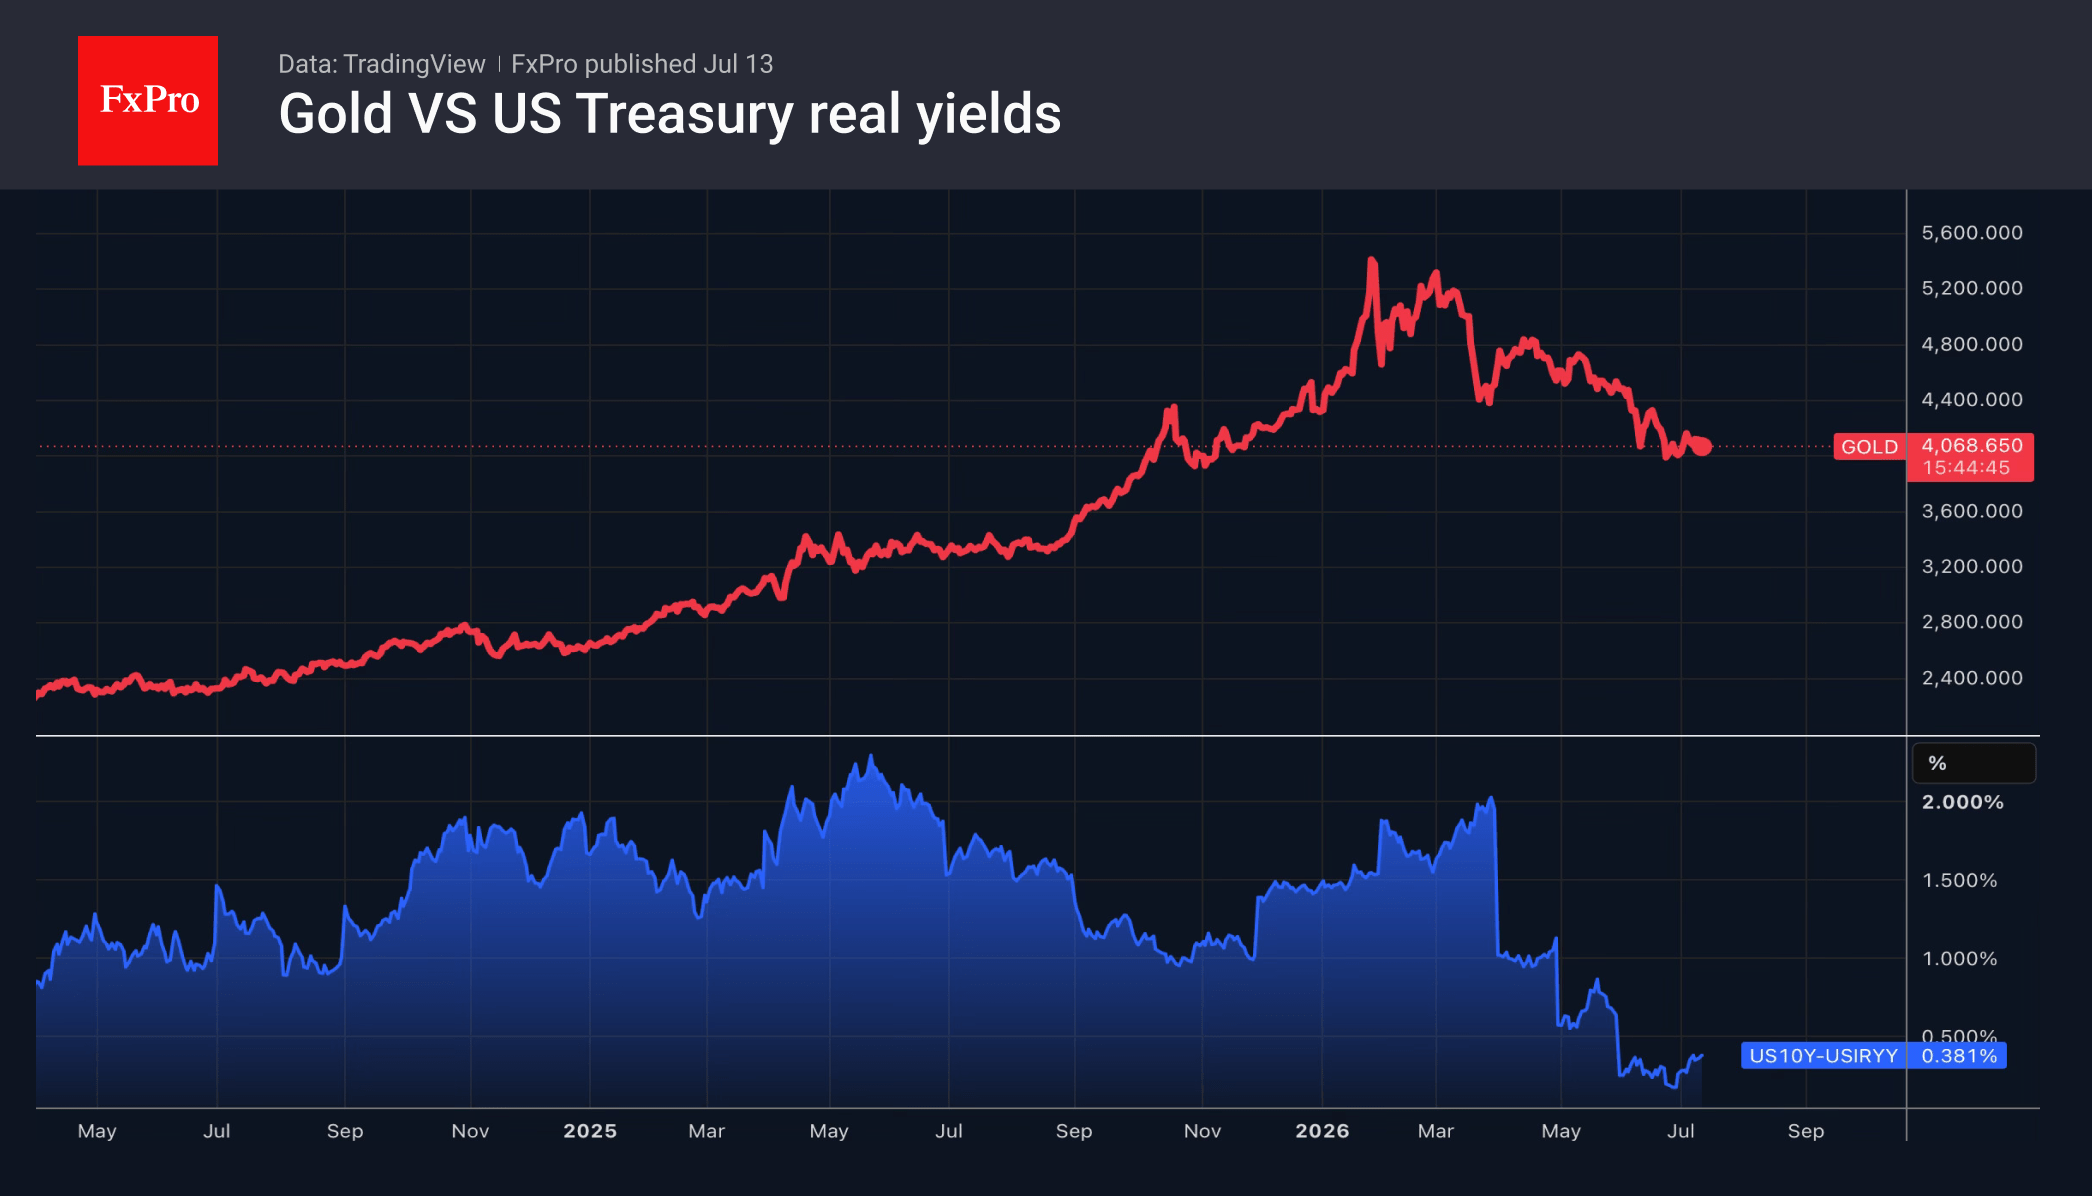
The price of gold rose to 4,800 USD per troy ounce on Wednesday, with the local trend gaining strength. The precious metal is supported by expectations of a possible agreement between the US and Iran, which would reduce the risks of an energy-driven inflationary shock.
Press reports indicate that Washington and Tehran are working to organise a new round of negotiations following the breakdown in dialogue over the weekend. At the same time, the US is maintaining a naval blockade of Iranian oil supplies through the Strait of Hormuz. Iran is reportedly considering temporarily suspending exports via this route to advance negotiations.
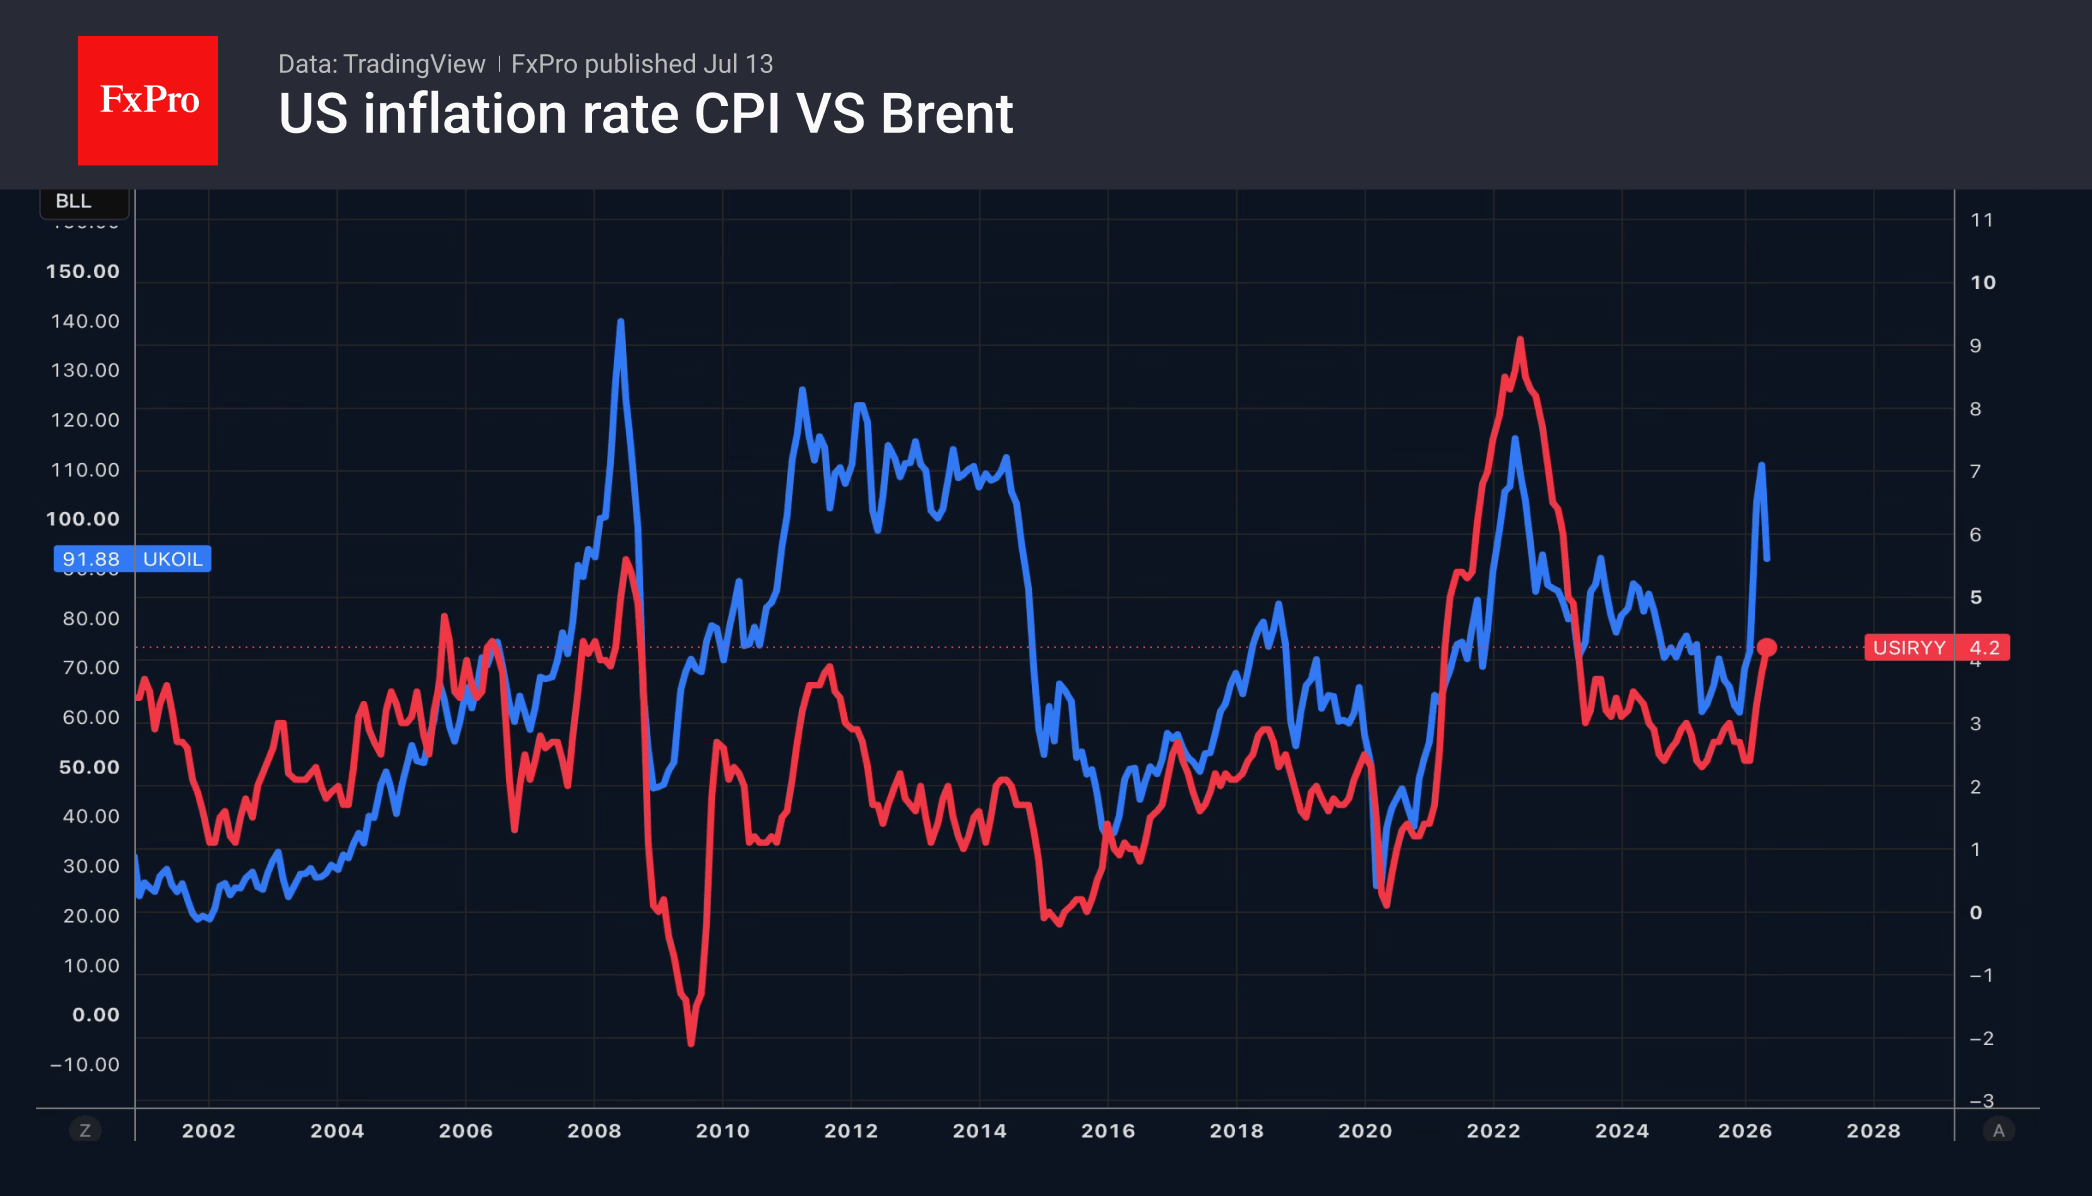
An additional supporting factor is the decline in oil prices below 90.00 USD per barrel and the weakening of the US dollar to six-week lows. Both developments traditionally boost demand for gold.
Markets are also revising their monetary policy expectations. The Federal Reserve is adopting a wait-and-see approach when assessing inflation risks, which is reducing pressure on precious metals.
Technical Analysis
On the H4 XAU/USD chart, the market is forming a consolidation range around the 4,772 USD level. An upside breakout would open potential for a correction to 4,903 USD. A downside breakout could see the beginning of a downward wave to 4,460 USD. The MACD indicator confirms the current upward momentum, with its signal line above the centre line and pointing firmly upwards.
On the H1 chart, the market has broken above the 4,775 USD level and completed a wave to 4,868 USD. A correction to the 4,775 USD level (testing from above) is likely, followed by a possible rise to 4,903 USD. The Stochastic oscillator supports this scenario, with its signal line remaining below the 20 level and showing upward pressure towards 80.
Conclusion
Gold is trading in positive territory as hopes for a renewed US-Iran negotiation effort ease concerns over an energy-driven inflationary shock. The combination of falling oil prices (below 90.00 USD per barrel), a weaker dollar (at six-week lows), and the Fed's patient stance on inflation risks has created a supportive environment for the precious metal. While the US maintains a naval blockade and Iran considers suspending exports to advance talks, the market is cautiously optimistic. Technical indicators suggest further upside potential towards 4,903 USD, although any setbacks in diplomatic efforts could quickly reverse the current momentum.
Euro Sees No Obstacles to Growth
- Global risk appetite and monetary policy divergence are driving gains in EURUSD.
- The Bank of Japan gave no signal of a rate hike in April.
The US dollar continues to retreat amid falling demand for safe-haven assets, as the de-escalation of the Middle East conflict has raised global risk appetite. Investors are confident that US-Iran peace talks will resume shortly. This is aided by the White House’s shift from a military strategy to economic leverage through a blockade of the Strait of Hormuz.
A prolonged blockade could lead to the IMF’s adverse scenario. Under this scenario, oil prices would remain above $100 per barrel for an extended period, global GDP would slow to 2.6%, and inflation would rise to 5.4%. In the baseline scenario, economic growth in 2026 will be 3.1%, 0.2 percentage points lower than the previous forecast. The International Monetary Fund believes that the eurozone will suffer more than the US. The shared currency bloc is dependent on energy imports.
However, the euro has a positive correlation with risk appetite, and its bulls have capitalised on the strong rally in US indices, pushing them towards record highs. At the same time, the rising correlation between the VIX volatility index and the US dollar is putting pressure on the greenback.
MUFG Research notes that the 40% rally in Brent since the start of the war in the Middle East should have led to a 3% fall in EURUSD. The firm attributes the euro’s return to pre-war levels to rising global risk appetite and divergence in monetary policy. The futures market is pricing in a 35% probability of a Fed rate cut in 2026. Investors are confident of two ECB rate hikes and a 30% chance of a third.
Other global currencies have benefited from the US dollar’s weakness. However, the yen is in no hurry to rise as Kazuo Ueda’s comments unsettled USDJPY bears. The BoJ Governor stated the Bank would continue to monitor developments in the Middle East and gave no signals of a tightening of monetary policy. This is a dovish tone, as he has given such signals before. As a result, the futures market has reduced the probability of monetary tightening in April from 55% to 32%.
Crypto Stalls as Risk Appetite Shows Cracks
Market Overview
The crypto market capitalisation fell by 0.74% over the past 24 hours to $2.5 trillion. Today’s top performers include Immutable (+3.2%), SushiSwap (+0.8%) and Tron (+0.7%). The underperformers were Dash (−5.4%), Toncoin (−4.5%) and NEAR Protocol (−4.4%). The crypto market took a step back, despite further gains in stock indices. From its local low at the end of March, the crypto market has risen by 8.6%, a more modest increase than the Nasdaq 100’s 13.6%.
Bitcoin briefly rose above $76K on Tuesday, almost matching March’s peak levels, but had retreated to $73.6K at the time of writing. Buyers are looking for a catalyst to push the price to a new level beyond the consolidation range. If Bitcoin is looking for external signals, it may remain indecisive until key US stock indices hit new highs. However, we are more inclined to believe that the first cryptocurrency’s stagnation is a sign of a fragile risk appetite that will soon manifest in the broader market.
News Background
The conflict in Iran has increased the appeal of non-sovereign money and brought Bitcoin closer to serving as a real medium of exchange, according to Bitwise. Since the start of the war in the Middle East, BTC has risen by 12%, whilst the S&P 500 and gold have fallen by 1% and 10% respectively.
Bitcoin could fall to $30K only if the US economy enters a deep recession, according to analyst Benjamin Cowen. A correction of 65–70% from the highs is in line with historical trends and is not exceptional.
According to CoinDesk, derivatives accounted for 76.5% of the total trading volume on centralised crypto exchanges (CEX) in March — the highest figure since September 2023. Derivatives trading volume on CEXs stood at $3.99 trillion — 3.2% lower than in February.
Trump’s nominee for Fed chair has disclosed his cryptocurrency investments. Kevin Warsh has invested in the Polymarket prediction market and several decentralised startups, according to his financial disclosure statement.
Bitcoin Rallies Without Conviction, Clarity Act Uncertainty to Cap Break Above $80K
Bitcoin is rising—but without conviction. Despite a broader improvement in risk sentiment this week on hopes of de-escalation in the Middle East, the rally in crypto remains notably subdued. While equities, particularly tech, are pushing back toward record highs, Bitcoin is still struggling well below the $80K psychological level, highlighting a clear lack of committed buying.
The divergence with equities is telling. With the NASDAQ on the verge of retesting its highs, Bitcoin’s inability to follow through suggests that the current move is not a full risk-on endorsement. Instead, it points to a market that is participating, but not leading—held back by a major unresolved factor: regulation.
At the center of that uncertainty is the Clarity Act, the key US crypto market structure bill. While it passed the House last July, progress has stalled in the Senate Banking Committee. The lack of a scheduled markup and the continued silence from leadership suggest that momentum behind the bill has faded.
The next two weeks represent a critical “do-or-die” window. With the Senate returning from recess, failure to advance the bill before May could push meaningful progress out to 2030. Once the US enters the campaign cycle ahead of the 2026 midterms, appetite for controversial legislation is expected to collapse.
Further dampening expectations is the shift in priorities within the Senate. Banking Committee Chair Tim Scott has indicated that his immediate focus is the confirmation of Kevin Warsh to replace Jerome Powell as Fed Chair in May. That effectively sidelines crypto legislation in the near term, reinforcing the perception that regulatory clarity is not imminent.
This policy bottleneck is now acting as a ceiling for Bitcoin. The rally is intact, but the breakout is missing. Without progress on the Clarity Act, institutional participation is likely to remain cautious, limiting upside momentum.
Technically, Bitcoin’s structure reinforces this view. The price action from the 59,866 low appears to be a consolidation phase within the broader downtrend from 126,289. As long as 70,460 support holds, further upside toward 50% retracement of 97,922 to 59,866 at 78,894 is possible.
However, strong resistance is expected near 80,492—support turned resistance—which is likely to cap gains. This level now represents more than just a technical barrier; it is effectively a policy ceiling.
Unless regulatory clarity improves, rejection around 80K would likely complete the consolidation and set the stage for a renewed downtrend, with a retest of the 59,866 low.