Sample Category Title
USD/CAD Daily Outlook
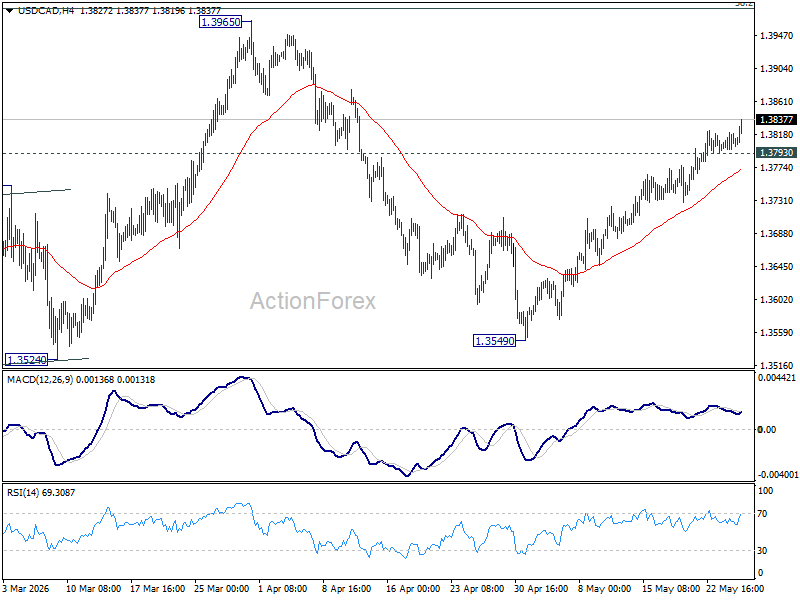
USD/CAD's rally from 1.3549 is in progress and intraday bias stays on the downside. It's seen as the third leg of the pattern from 1.3480 and should target 1.3965 resistance. On the downside, below 1.3793 minor support will turn intraday bias neutral again.
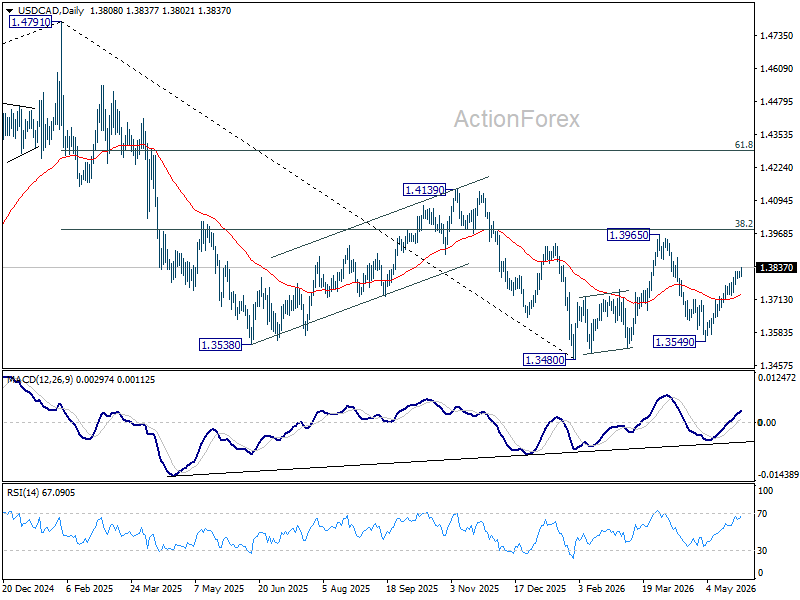
In the bigger picture, price actions from 1.4791 are seen as a corrective pattern to the whole up trend from 1.2005 (2021 low). Deeper fall could be seen, as the pattern extends, to 61.8% retracement of 1.2005 to 1.4791 at 1.3069. However, decisive break of 38.2% retracement of 1.4791 to 1.3480 at 1.3981 will argue that the correction has completed with three waves down to 1.3480 already.
GBP/JPY Daily Outlook
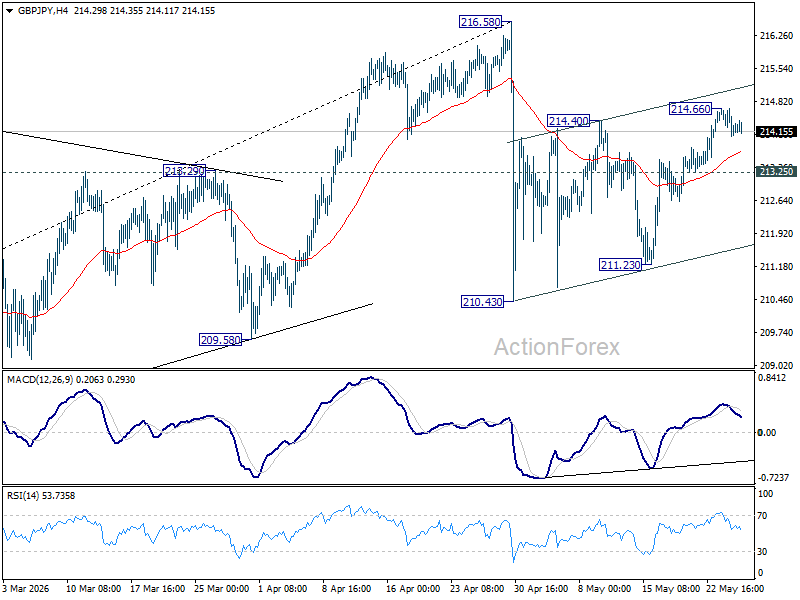
Intraday bias in GBP/JPY is turned neutral first with current retreat. On the upside, above 214.66 will extend the rebound from 210.43 to retest 216.58 high. Strong resistance should be seen there to cap upside, at least on first attempt. On the downside, below 213.25 minor support will turn bias back to the downside for 211.23 support instead.
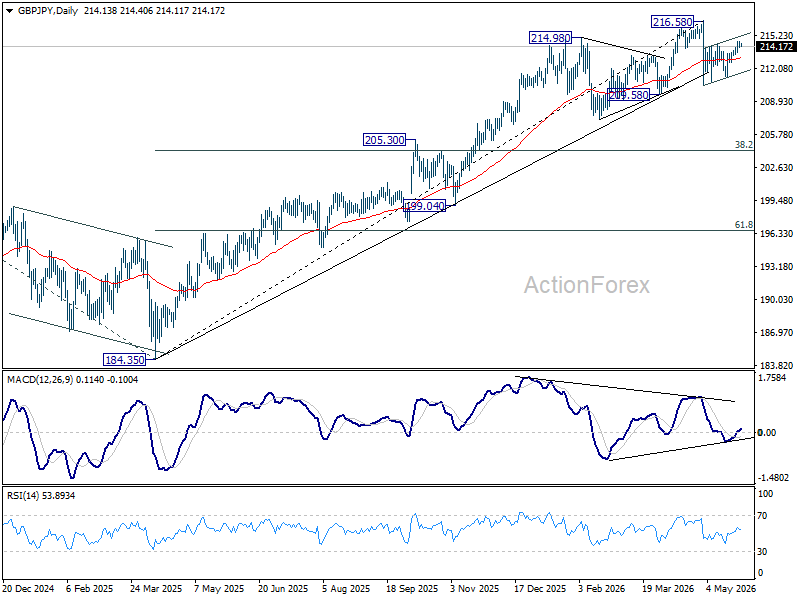
In the bigger picture, while the fall from 216.58 is steep, there is no clear sign of trend reversal yet. The long term up trend could still extend to 61.8% projection of 148.93 (2022 low) to 208.09 (2024 high) from 184.35 at 220.90 on resumption. However, sustained break of 55 W EMA (now at 206.27) will argue that it's already in medium term down trend for 184.35 support.
EUR/JPY Daily Outlook
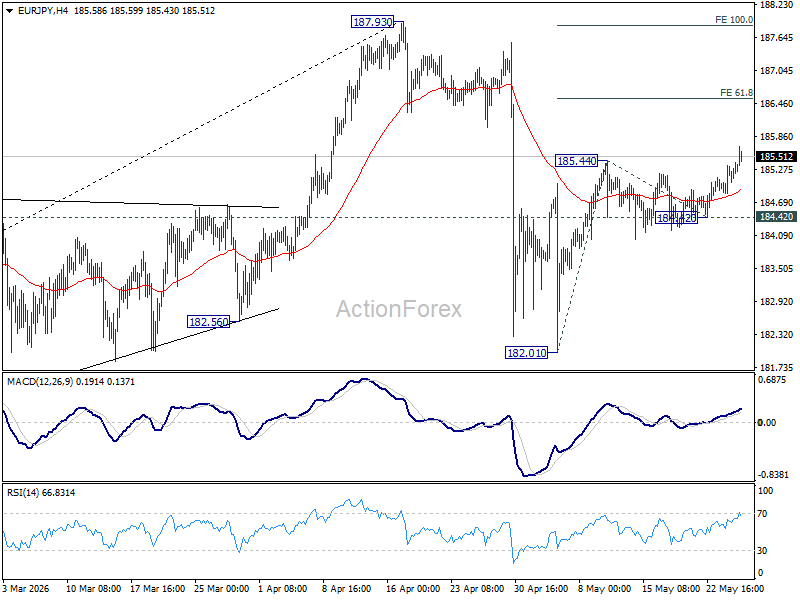
EUR/JPY's rebound from 182.01 resumed today and intraday bias is back on the upside. Next target is 61.8% projection of 182.01 to 185.44 from 184.42 at 186.53. Near term risk will stay on the upside as long as 184.42 support holds, in case of retreat.
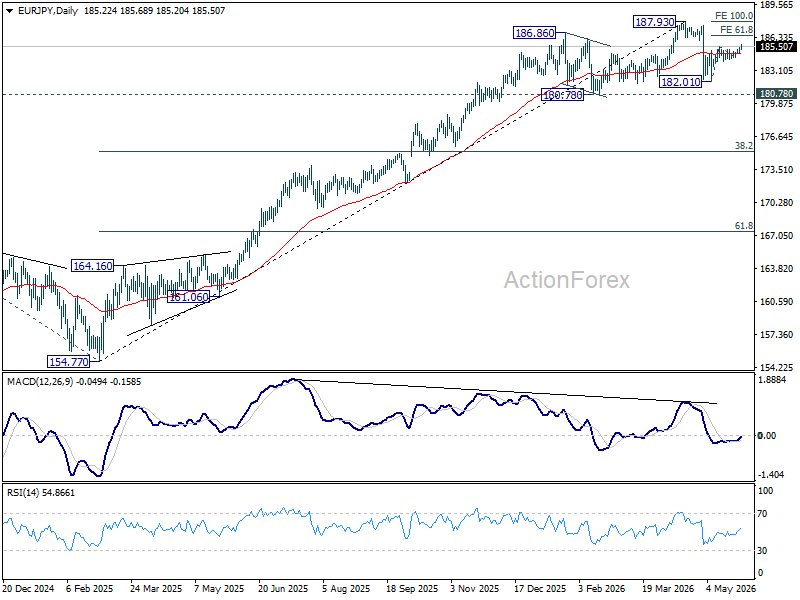
In the bigger picture, the pullback from 187.93 is steep, there is no sign of reversal yet. Uptrend from 114.42 (2020 low) is still expected to resume at a later stage to 78.6% projection of 124.37 (2022 low) to 175.41 (2025 high) from 154.77 at 194.88. However, sustained break of 55 W EMA (now at 178.51) will argue that it's already in a medium term down trend to 175.41 resistance turned support and below.
EUR/GBP Daily Outlook
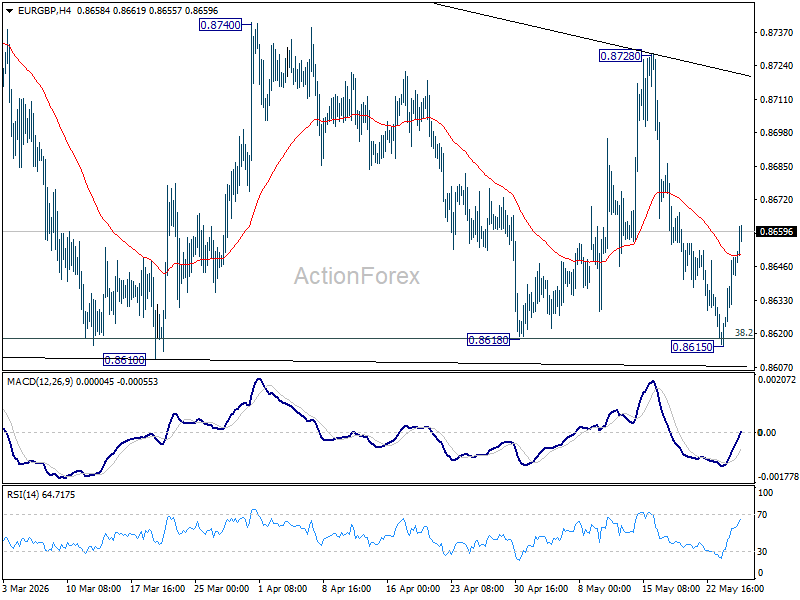
Range trading continues in EUR/GBP and intraday bias remains neutral. On the downside, decisive break of 0.8610 support will revive the case of bearish trend reversal. Deeper decline should be seen to 61.8% retracement of 0.8221 to 0.8863 at 0.8466. On the upside, break of 0.8728 resistance will bring stronger rally back towards 0.8740 resistance.
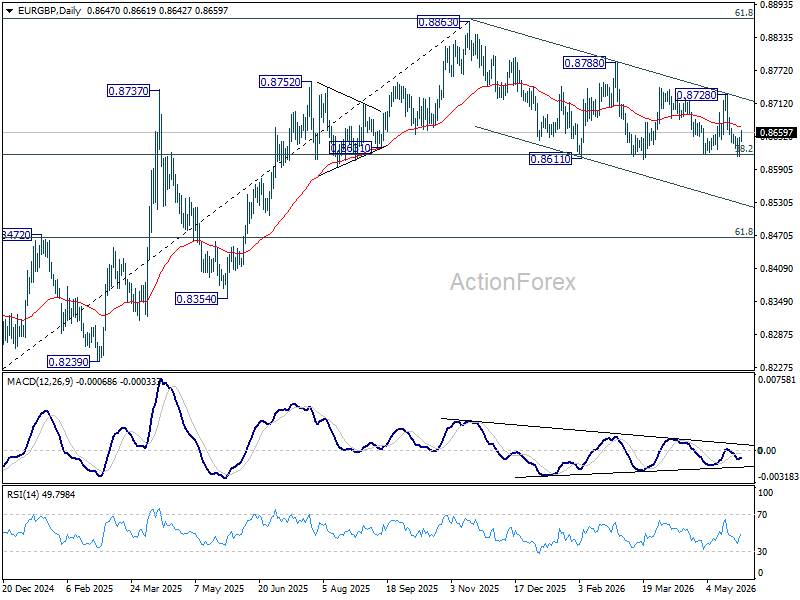
In the bigger picture, focus is staying on 38.2% retracement of 0.8821 to 0.8863 at 0.8618. Strong rebound from there will retain medium term bullishness. Rise from 0.8221 should resume through 0.8863 at a later stage. Nevertheless, sustained break of 0.8618 will confirm that whole rise from 0.8221 has completed at 0.8863. Deeper decline should then be seen to 61.8% retracement at 0.8466 at least.
EUR/AUD Daily Outlook
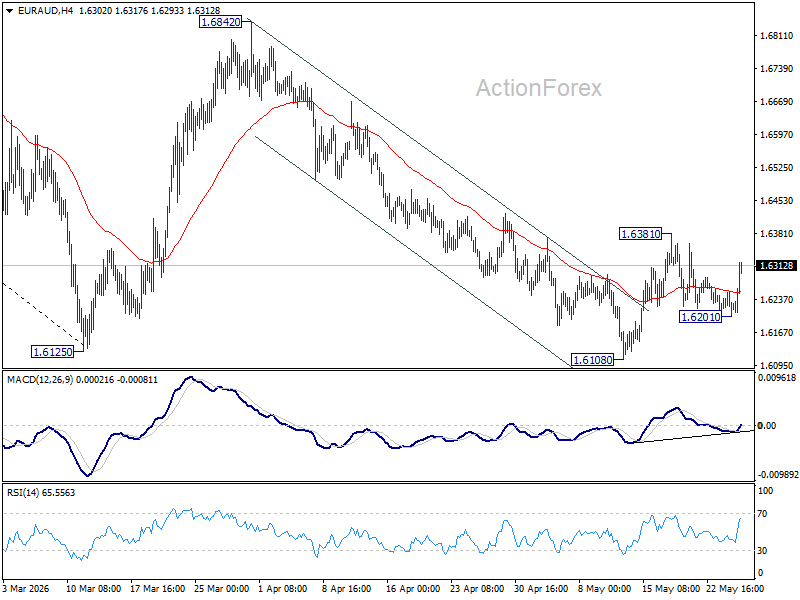
EUR/AUD recovered notably today ut stays below 1.6381 and intraday bias remains neutral first. Rise from 1.6108 is tentatively seen as the third leg of the pattern from 1.6125. Above 1.6381 will target 55 D EMA (now at 1.6422) and above. Nevertheless, firm break of 1.6108 will resume the larger down trend from 1.8554.
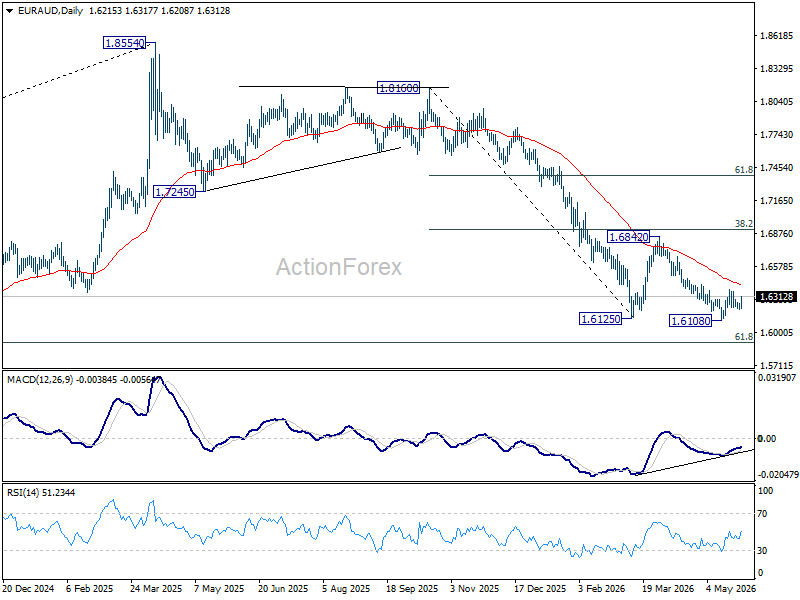
In the bigger picture, fall from 1.8554 (2025 high) is in progress and deeper decline should be seen to 61.8% retracement of 1.4281 to 1.8554 at 1.5913, which is slightly below 1.5963 structural support. Decisive break there will pave the way back to 1.4281 (2022 low). For now, risk will stay on the downside as long as 55 W EMA (now at 1.6984) holds, even in case of strong rebound.
EUR/CHF Daily Outlook
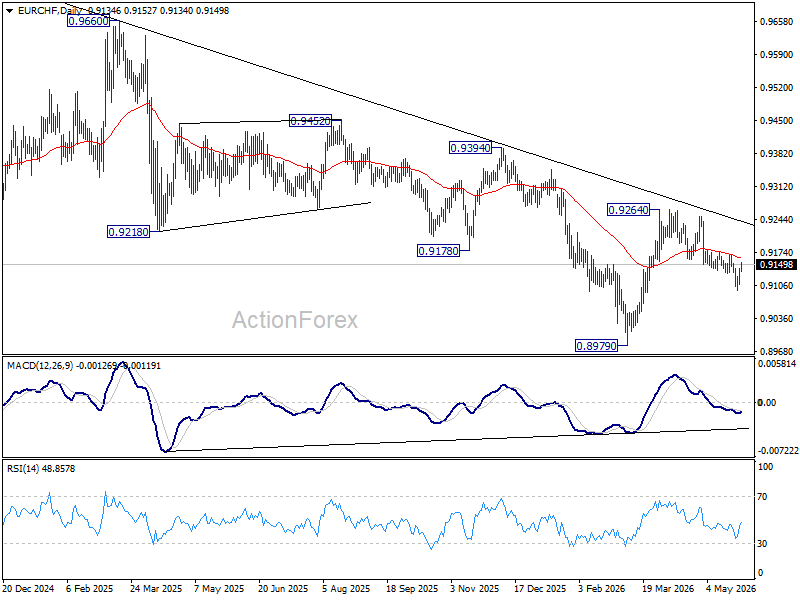
Intraday bias in EUR/CHF remains neutral and further decline is expected with 0.9167 resistance intact. Break of 0.9094 will resume the fall from 0.9264 to retest 0.8979 low. However, firm break of 0.9167 will dampen this bearish view, and bring stronger rise back to retest 0.9264 instead.
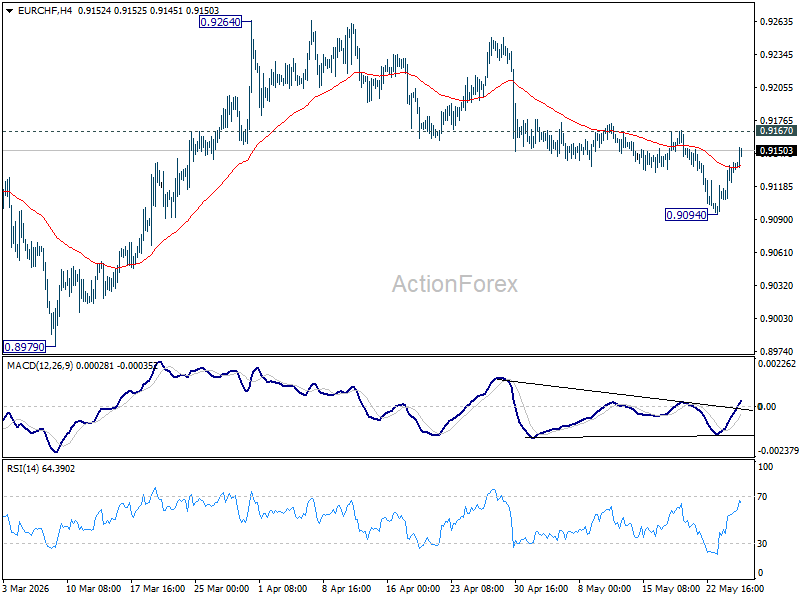
In the bigger picture, the rejection by 55 W EMA (now at 0.9252) suggests that the down trend from 0.9928 (2024 high) is still in progress. Firm break of 0.8979 will confirm down trend resumption. Outlook will stay bearish as long as 0.9394 resistance holds, in case of another rebound.
The Crypto Market is Nervous, Despite Record Highs in Equities
Market Overview
The crypto market capitalisation fell by 1.6% to $2.54 trillion, coming under pressure despite new record highs in US stock indices. This continues the range-bound trading that has persisted for over a month, but the market is now at its lower end. Over the past 24 hours, the top performers were the relatively small-cap Internet Computer (+14.6%), Filecoin (+5.9%) and Cosmos (+4.4%), which were catching up with the latest wave of growth. The biggest declines in our list of the most liquid coins were seen in Near Protocol (-7.8%), Zcash (-6.8%) and VeChain (-4.3%).
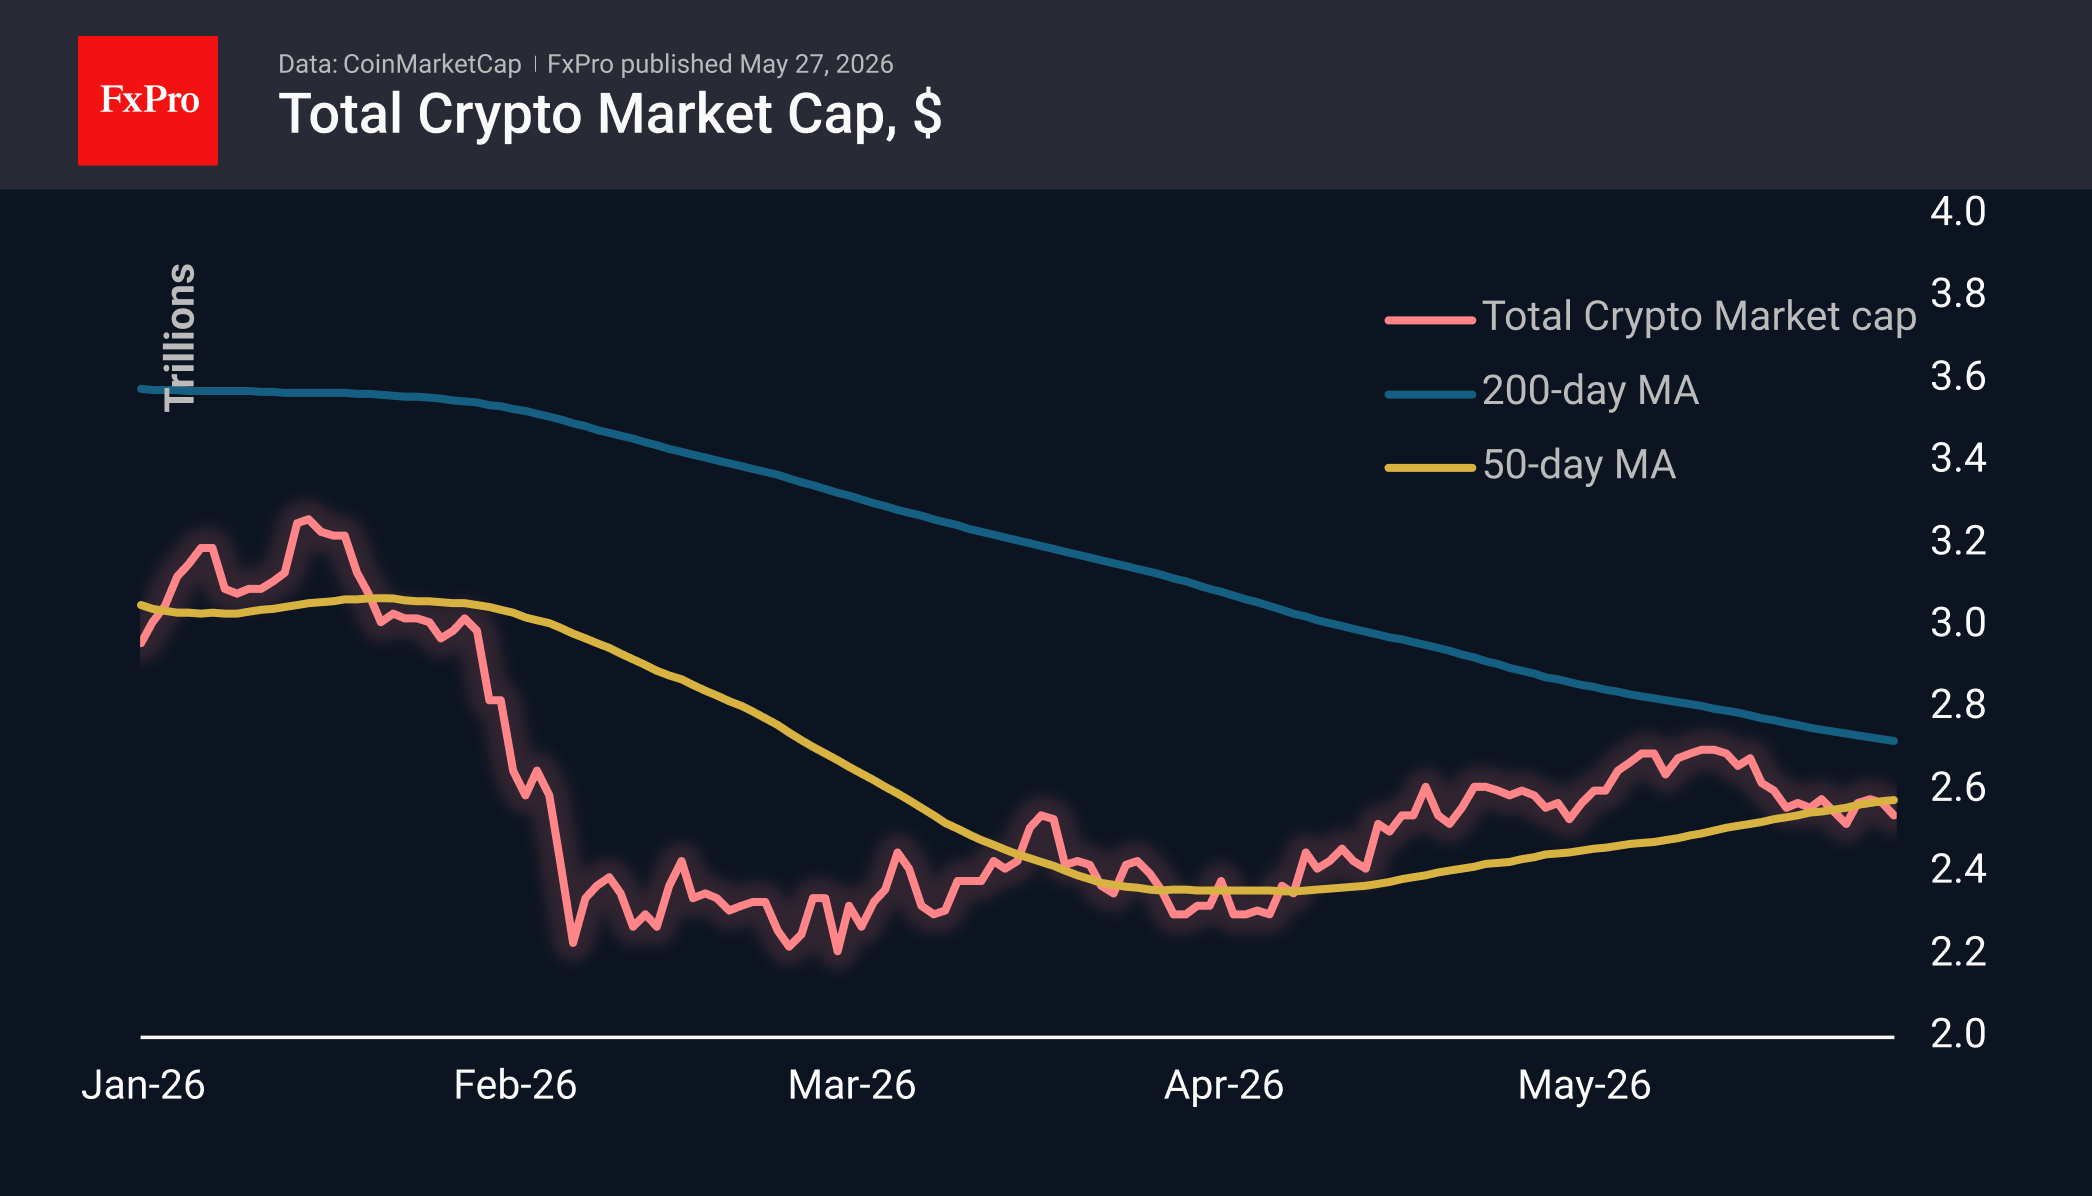
The sentiment index has returned to extreme fear territory, falling to 25. As with cryptocurrency market capitalisation, current levels are at the lower end of the range seen since mid-April. If cryptocurrencies are once again acting as a barometer of sentiment in global financial markets, this looks like an early signal of a reversal towards profit-taking. Perhaps investors prefer to take their money off the table ahead of the start of summer, beginning with the riskiest segment.
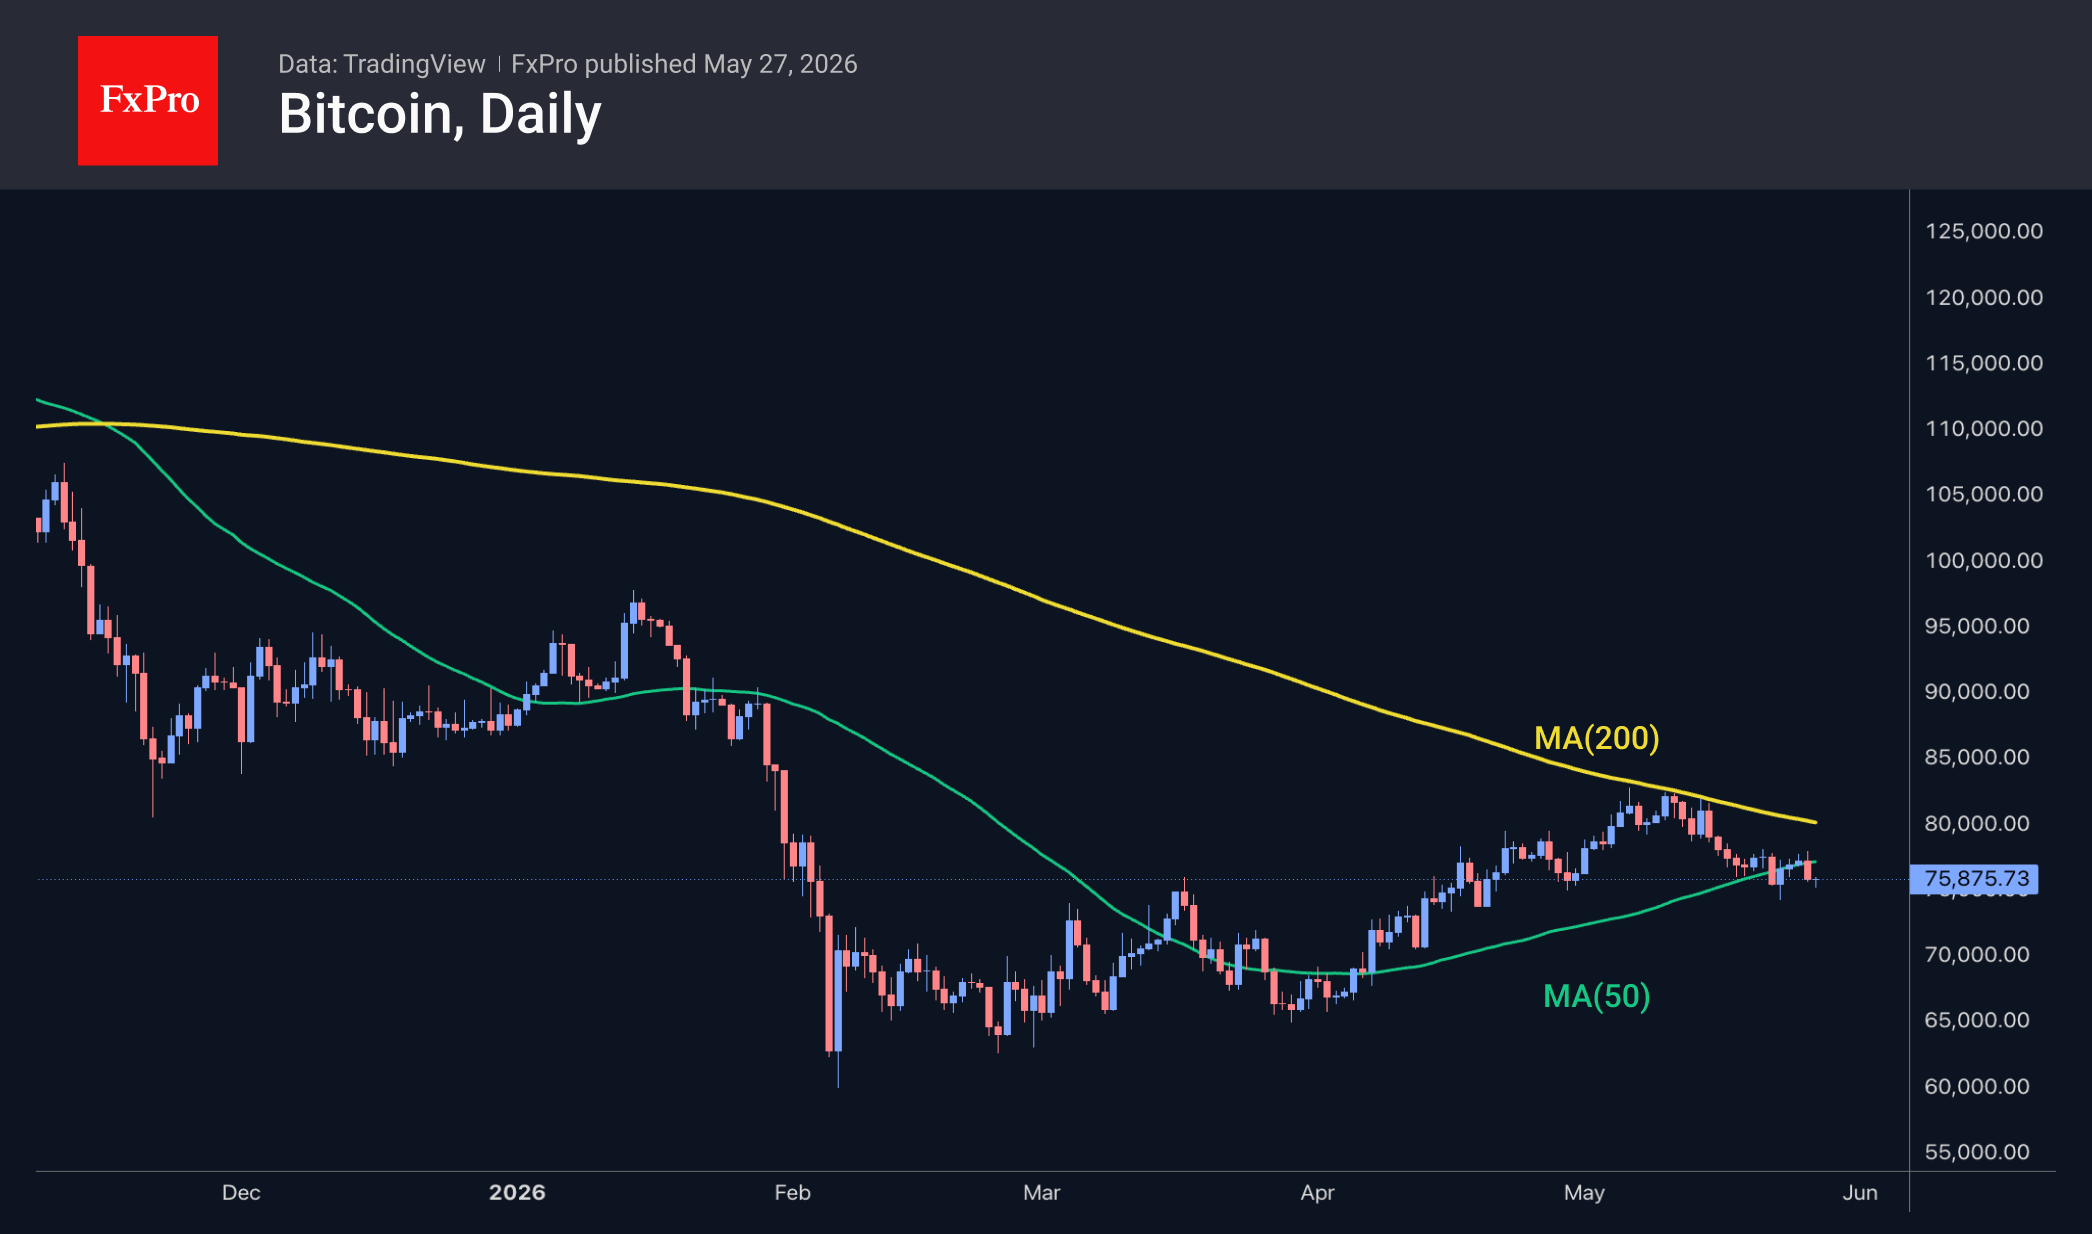
Bitcoin has fallen below $76K, losing over 2% from Tuesday’s peak, dropping below the 50-day moving average, and cautiously extending Wednesday’s early-session decline. Significant horizontal support that halted the sell-off in May lies near current levels and offers a glimmer of hope for bulls in the near term.
News Background
According to CoinShares, global investment in crypto funds fell by $1.467 billion last week, hitting its lowest level since January. Investments in Bitcoin fell by $1.315 billion (the largest decline this year), and in Ethereum by $223 million. Investments in altcoins rose by $32 million in XRP, $8 million in Solana, $9 million in Near, and $3 million in Sui.
The total outflow of $2.54 billion over two weeks indicates a deepening and broadening flight from risky assets, despite progress in implementing the CLARITY Act, CoinShares notes.
Following the $1.5 billion buyback of its own bonds, Strategy’s total debt has fallen to $6.7 billion. The return on Bitcoin assets per share has risen by 0.7 percentage points since the start of the year to 13.3%. Strategy did not purchase any cryptocurrency last week, but small public companies acquired 602.6 BTC worth approximately $46 million.
Spot Bitcoin trading volumes fell by 10% over the past week, whilst futures open interest dropped by 3.5%, according to Glassnode.
Ethereum continues to show weakness against the backdrop of statements by the project’s co-founder, Vitalik Buterin, regarding a change in the Ethereum Foundation’s (EF) strategy, notes analyst Ali Martinez. The EF plans to reduce its role in the ecosystem and focus on critical tasks.
The total market capitalisation of stablecoins has hit a new all-time high, reaching $323 billion. This figure exceeds the official foreign exchange reserves of 95 countries.
EUR/USD Targets More Upside As USD/CHF Turns Higher Again
EUR/USD started a downside correction from 1.1650. USD/CHF is rising and might aim for a move toward 0.7880 or 0.7900.
Important Takeaways for EUR/USD and USD/CHF Analysis Today
- The Euro struggled to clear 1.1650 and corrected gains against the US Dollar.
- There is a key bullish trend line forming with support at 1.1630 on the hourly chart of EUR/USD at FXOpen.
- USD/CHF is showing positive signs above the 0.7830 zone.
- There was a break above a connecting bearish trend line with resistance at 0.7830 on the hourly chart at FXOpen.
EUR/USD Technical Analysis
On the hourly chart of EUR/USD at FXOpen, the pair gained pace for a move above 1.1600. The Euro tested 1.1650 and recently corrected gains against the US Dollar.
The pair dipped below 1.1635 and the 38.2% Fib retracement level of the upward move from the 1.1588 swing low to the 1.1652 high. However, the bulls were active above 1.1620. There is also a key bullish trend line forming with support at 1.1630.
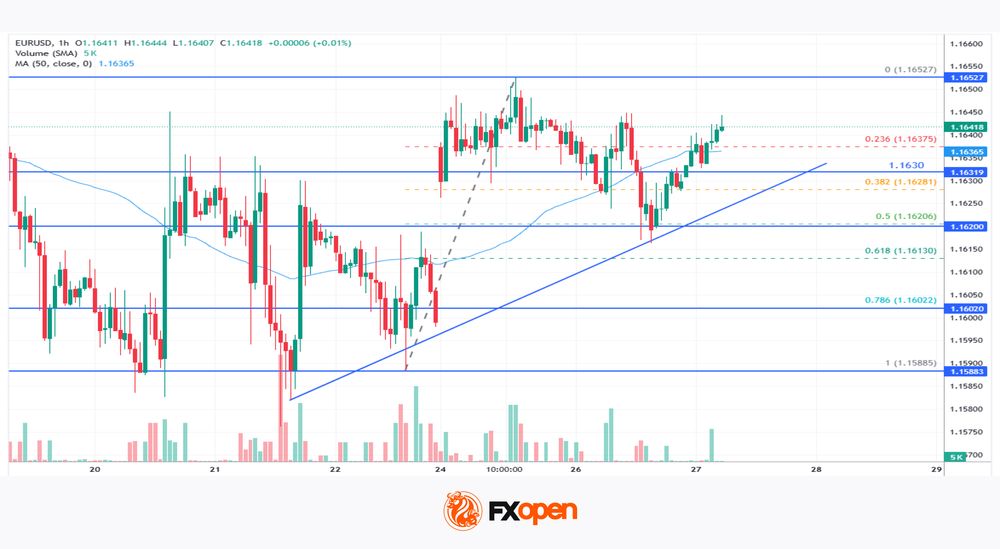
The pair is again above the 50-hour simple moving average. Immediate resistance on the upside could be 1.1650. The next key hurdle for the bulls might be 1.1675.
An upside break above 1.1675 might send the pair toward 1.1705. Any more gains might open the doors for a move toward 1.1740. If the bulls fail to push the pair above 1.1650, there could be another bearish reaction.
On the downside, immediate support on the EUR/USD chart might be near the trend line at 1.1630. The next major area of interest could be near the 50% Fib retracement level at 1.1620. A downside break below 1.1620 could send the pair toward 1.1550.
USD/CHF Technical Analysis
On the hourly chart of USD/CHF at FXOpen, the pair declined from the 0.7900 barrier and tested the 0.7810 zone. The US Dollar traded as low as 0.7808 and recently started a fresh increase against the Swiss Franc.
The pair climbed above 0.7820 and the 50-hour simple moving average. There was a break above the 50% Fib retracement level of the downward move from the 0.7903 swing high to the 0.7808 low. Besides, there was a break above a connecting bearish trend line with resistance at 0.7830.
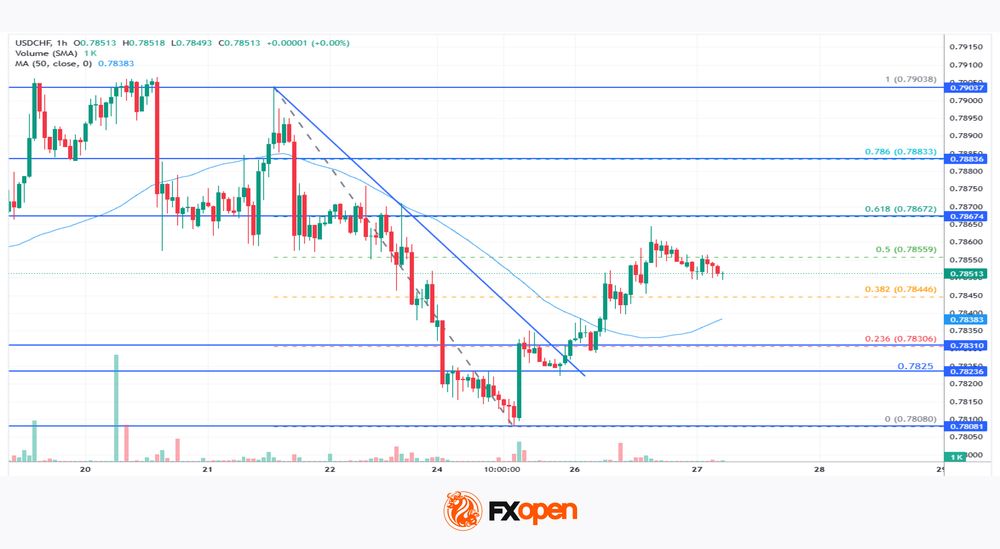
The bulls are now facing hurdles near the 61.8% Fib retracement at 0.7865. The next major area of interest could be 0.7880. The main sell region could be near 0.7900.
If there is a clear break above 0.7900, the pair could start another increase. In the stated case, it could test 0.8000. If there is another decline, the pair might test the 50-hour simple moving average at 0.7835.
The first major support on the USD/CHF chart could be 0.7830. A downside break below 0.7830 might spark bearish moves. The next major support might be 0.7800. Any more losses may possibly open the doors for a move toward 0.7765 in the near term.
Trade over 50 forex markets 24 hours a day with FXOpen. Take advantage of low commissions, deep liquidity, and spreads from 0.0 pips (additional fees may apply). Open your FXOpen account now or learn more about trading forex with FXOpen.
This article represents the opinion of the Companies operating under the FXOpen brand only. It is not to be construed as an offer, solicitation, or recommendation with respect to products and services provided by the Companies operating under the FXOpen brand, nor is it to be considered financial advice.
USD/JPY Rises Again: Dollar Strong, Inflation Risks High
USD/JPY rose to 159.19, with the yen remaining near its one-month lows following comments from Bank of Japan Governor Kazuo Ueda. The regulator warned of rising inflation risks but did not provide any clear signals regarding a potential rate increase at the next BoJ meeting.
Ueda noted the need to closely monitor the impact of high oil prices on inflation in Japan but did not specify how much these factors could influence the regulator's decision in June.
At the same time, BoJ Deputy Governor Ryozo Himino confirmed that the central bank remains ready for further rate hikes. However, the timing and pace of policy tightening will depend on how the Middle East conflict affects the Japanese economy and inflation.
Investors also continue to closely monitor the situation surrounding US-Iran talks. Despite isolated signs of progress in negotiations, ongoing military actions and tensions keep currency markets on edge.
Technical Analysis
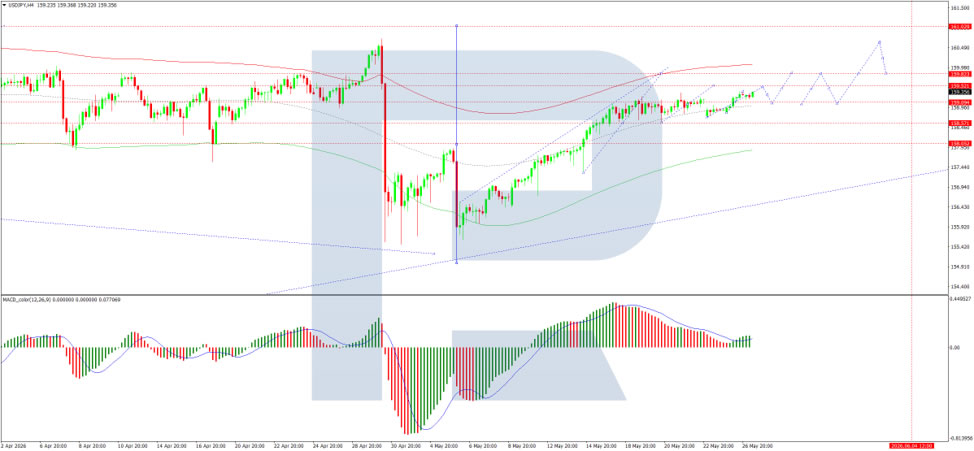
On the H4 chart, USD/JPY is trading within a consolidation range around 159.00 and is moving higher towards 159.60. A test of this level is likely, followed by a possible pullback to 159.00. The MACD indicator supports this scenario, with its signal line above zero and pointing firmly upwards, indicating continued bullish momentum.
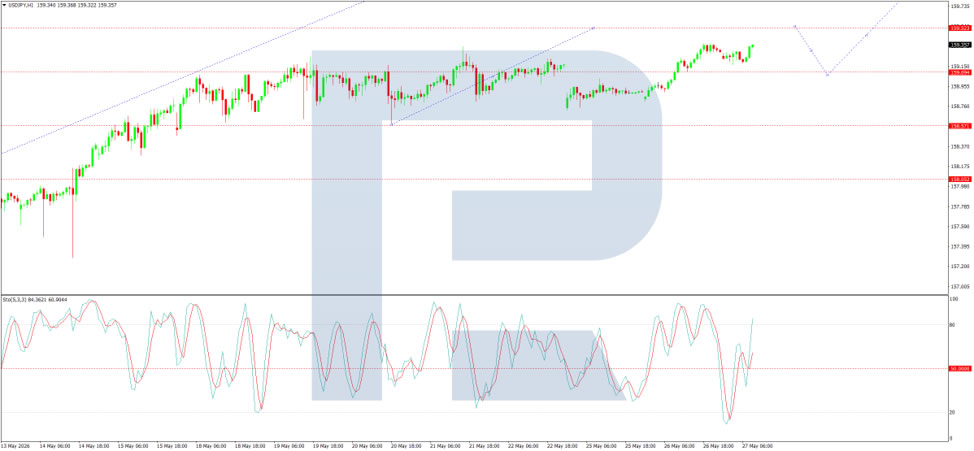
On the H1 chart, USD/JPY is moving higher towards 159.50. A correction to 159.00 may follow, before a further rise towards 159.60 and potentially 159.90. The Stochastic oscillator confirms this scenario, with its signal line above 50 and pointing firmly upwards towards 80, indicating that short-term upside momentum remains.
Conclusion
USD/JPY continues its upward move as the dollar remains strong amid elevated inflation risks. The yen is hovering near one-month lows after BoJ Governor Ueda warned of rising inflation pressures but stopped short of signalling a near-term rate hike. While Deputy Governor Himino reaffirmed the BoJ's readiness to tighten policy further, the timing remains dependent on how the Middle East conflict impacts Japan's economy and inflation. Meanwhile, uncertainty persists around US-Iran negotiations, with isolated progress offset by continued military tensions. Technically, further upside towards 159.60–159.90 appears likely, with intervention risks remaining a key factor as the pair approaches psychologically significant levels.
EUR/CAD Rally Continues as ECB Officials Prepare Markets for June Hike
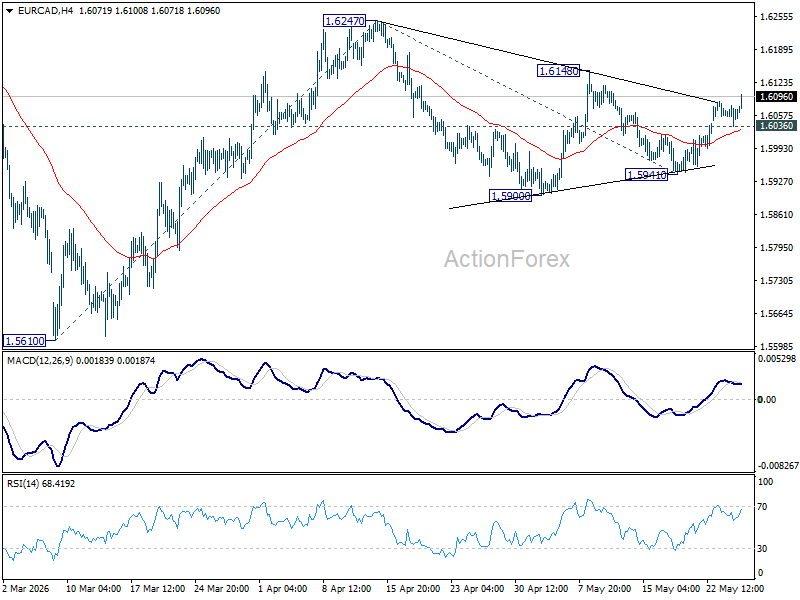
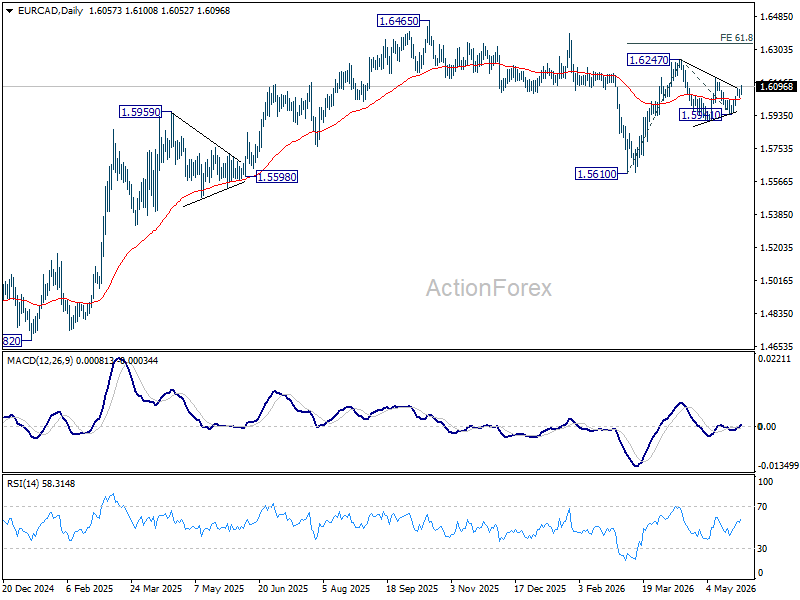
EUR/CAD extended its near term rally today as increasingly hawkish rhetoric from senior European Central Bank officials continued pushing markets toward pricing a June rate hike, while falling oil prices added renewed pressure on Canadian Dollar. The pair resumed its rebound from 1.5941 and is now approaching the key 1.6148 resistance zone, with broader momentum increasingly favoring further upside.
The Euro side of the equation has been driven by a coordinated shift in ECB communication this week. French ECB Governing Council member Francois Villeroy de Galhau said today that policymakers would “do what is necessary to bring inflation back to 2% in the medium term,” while emphasizing the need to prevent energy-driven inflation from feeding into broader pricing behavior. “We should be extremely vigilant about possible second-round effects,” Villeroy said, adding, “have no doubt we will act as much as necessary.”
Those comments reinforced already hawkish signals from ECB Chief Economist Philip Lane and Executive Board member Isabel Schnabel earlier this week. Lane signaled that the ECB is preparing another upward revision to inflation forecasts and indicated policymakers are comfortable with current market pricing for tighter policy. Schnabel took an even firmer stance, arguing that “looking through is no longer an option” and stating directly that “a rate hike in June will be needed.”
Meanwhile, Canadian Dollar continues losing support from oil markets as hopes for a US-Iran agreement and reopening of the Strait of Hormuz weigh heavily on crude prices. With Brent crude falling sharply from last week’s highs to the mid-$90 area. Markets are also firmly expecting the Bank of Canada to remain on hold for the rest of the year.
Technically, EUR/CAD's rise from 1.5914 extends today and it's on track to 1.6148 resistance. Firm break of 1.6148 will solidify the case that near term consolidation from 1.6247 has completed, and rise from 1.5610 is ready to resume. Break of 1.6247 will target 61.8% projection of 1.5610 to 1.6247 from 1.5941 at 1.6335 next. Nevertheless, below 1.6036 minor support will delay the bullish case and bring more sideway trading first.