
Sample Category Title
Fed’s Kashkari Warns of Rising Inflation Risks, But Says It’s Too Soon to Predict Rate Hike
Minneapolis Fed President Neel Kashkari warned that inflation risks are becoming increasingly concerning as the Middle East conflict continues pushing energy and supply-chain costs higher across the global economy. Speaking in Tokyo, Kashkari said “most of the data has said the inflationary risks are higher, not lower.".
Kashkari argued that the persistence of elevated inflation over recent years is making the Fed less willing to simply dismiss the current energy shock as temporary. “We've had high inflation all around the world for five years now,” he said, adding that the Iran conflict is “affecting virtually every economy around the world.” He also stressed that rising energy costs are likely to spread gradually into other sectors of the economy, warning that “the inflationary shockwave” from the conflict could persist longer than markets currently expect.
Importantly, Kashkari suggested inflation concerns currently outweigh labor-market risks for policymakers. While he described the US labor market as being “in a decent place,” he said “the risk to inflation appeared to be higher than the risk of a worsening labour market.” He also warned that failing to respond appropriately to persistent inflation pressures could damage the Fed’s credibility, saying policymakers risk fueling public perceptions that the central bank is not serious about restoring price stability.
Still, Kashkari stopped short of endorsing imminent rate hikes despite growing market pricing for a possible October move. “I think it's far too soon for me to make such a prediction,” he said when asked about hike expectations. Instead, he reiterated that the Fed should maintain “neutral guidance” signaling rates could still move either higher or lower depending on incoming data, particularly developments surrounding Iran negotiations, energy markets, and global supply-chain normalization.
Geopolitical Risks Support the Dollar Ahead of Fresh US Data
At the start of the week, the US currency continues to trade near significant levels amid ongoing uncertainty surrounding negotiations between the United States and Iran. Markets are closely monitoring reports suggesting a possible prolongation of the negotiation process and an increased US military presence in the Middle East, both of which are supporting demand for safe-haven assets, including the dollar.
Additional support for the US currency comes from rising US Treasury yields and expectations surrounding upcoming macroeconomic data releases, which could influence further market expectations regarding Federal Reserve policy.
At the same time, the dollar’s movement remains mixed. Despite the recent strengthening of USD/JPY and USD/CAD, both pairs have approached important technical resistance levels, where buying activity is beginning to slow. The market is now assessing whether the current momentum can develop into a broader continuation of dollar strength, or whether the advance in the US currency will remain merely a short-term reaction to geopolitical risks.
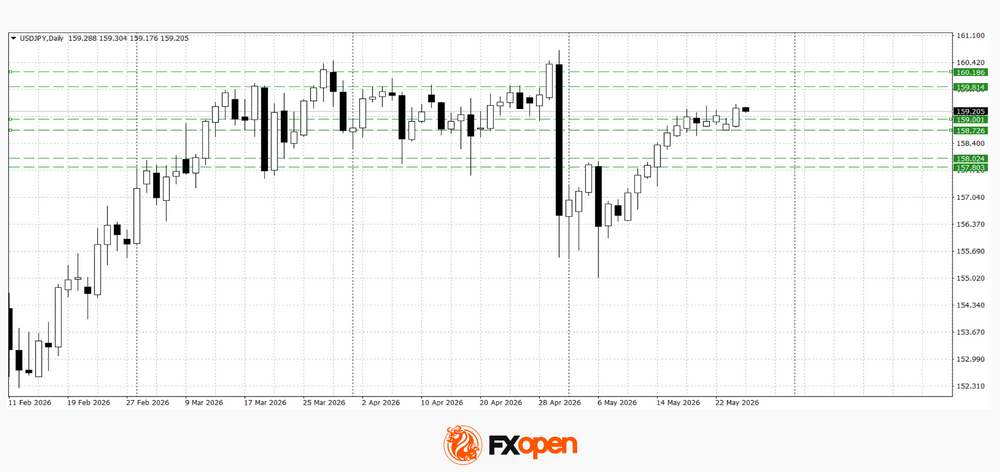
USD/JPY
Buyers in USD/JPY have managed to establish the pair above the key 159.00 level. If the 158.70–159.00 range retains its status as support, further growth towards 159.80–160.20 remains possible. A loss of this zone could trigger a downward correction towards 158.00–157.80.
Key events for USD/JPY:
- today at 11:00 (GMT+3): speech by Dallas Fed representative Lorie K. Logan;
- today at 15:15 (GMT+3): US ADP non-farm employment change;
- tomorrow at 02:50 (GMT+3): foreign investment in Japanese equities.
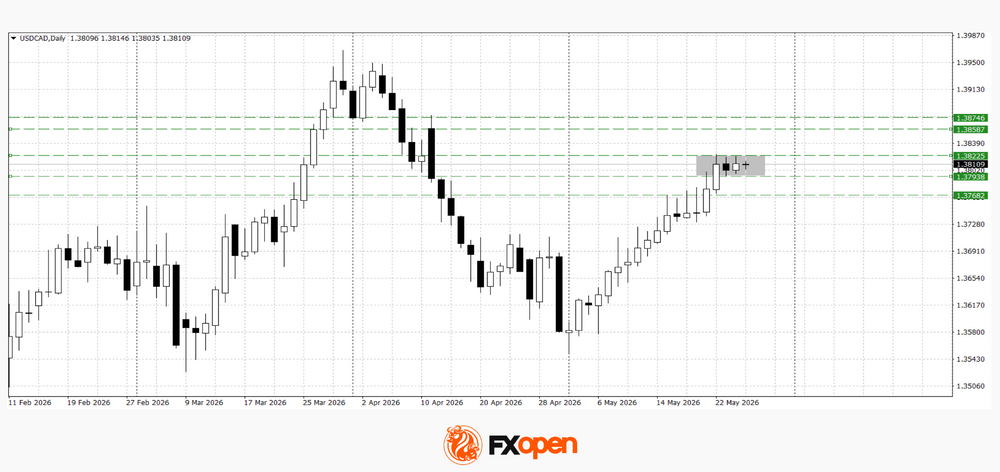
USD/CAD
USD/CAD is also trading within a range after reaching major resistance near 1.3800. Should strong US data be released or demand for the dollar remain firm, the pair may consolidate above 1.3820 and continue rising towards 1.3870. Conversely, weaker interest in the US currency could push the pair below 1.3800 and towards the 1.3750–1.3770 area.
Key events for USD/CAD:
- today at 15:30 (GMT+3): Canadian wholesale sales data;
- today at 23:30 (GMT+3): weekly US crude oil inventories from the American Petroleum Institute (API);
- tomorrow at 15:30 (GMT+3): Canada’s current account balance.
Overall, the dollar continues to retain an advantage amid geopolitical uncertainty and expectations of fresh macroeconomic signals from the United States. Nevertheless, the approach of USD/JPY and USD/CAD towards key technical resistance levels increases the likelihood of the current momentum slowing, while the next directional move will largely depend on incoming US economic data and developments surrounding negotiations between the US and Iran.
Trade over 50 forex markets 24 hours a day with FXOpen. Take advantage of low commissions, deep liquidity, and spreads from 0.0 pips (additional fees may apply). Open your FXOpen account now or learn more about trading forex with FXOpen.
This article represents the opinion of the Companies operating under the FXOpen brand only. It is not to be construed as an offer, solicitation, or recommendation with respect to products and services provided by the Companies operating under the FXOpen brand, nor is it to be considered financial advice.
Sunrise Market Commentary
Markets
US and UK markets reopened yesterday after long weekend, allowing room for some repositioning to Monday’s bond and stock rally on enthusiasm on a US-Iran deal. European bond markets underperformed with curves bear steepening on the back of ECB comments. ECB board member Schnabel backs a June rate hike even with a peace deal in place by then. She especially stresses the persistence of the shock which lasts longer than the ECB’s adverse scenario from March. Schabel’s interview – “a large an persistent shock”- is the first thing you when opening the ECB’s website. An interview by chief economist Lane, also published yesterday, was less outspoken. Like ECB President Lagarde over the weekend, he hinted at upward revision to inflation forecasts. He also added that the central bank expects indirect effects beyond energy prices in what could also be considered as a hint toward more imminent policy action. The market implied probability of June action ticked up yesterday in lockstep with front-end yields, hitting 90%. A speech by ECB President Lagarde and minutes of the April ECB meeting (on which a rate hike was discussed) could offer more clues tomorrow. Eco data were yesterday limited to May US Conference Board consumer confidence which edged downward (93.1 from 93.8) as the inflationary impacts of the war in the Middle East intensified. Consumer appraisals of current business conditions and the current labor market were moderately less positive and outweighed modest improvements in consumers’ expectations six months from now. Consumers’ average and median 12-month inflation expectations ticked downward but remained elevated at respectively more than 6% and more than 5%. Markets didn’t respond to the release. Overall, trading developed in an orderly way as Brent crude for most of the day managed to hold (just) below the $100/b mark. On US stock markets, a huge outperformance of Micron helped the Nasdaq to a 1.2% gain and a minor intraday all-time high. The dollar is going nowhere, holding between EUR/USD 1.16 and 1.1650. Today’s eco calendar is thin, suggesting any Iran-related headlines will drive intraday price action.
News & Views
The Reserve Bank of New Zealand (RBNZ) left its policy rate unchanged at 2.25% as widely expected. However, the decision was a very close call. Three members preferred to raise the policy rate by 25 bps. Three other members voted to still keep policy unchanged. Governor Breman was in the unchanged camp and casted the decisive vote. The MPC assesses that inflation will probably rise to 4.3% in the September quarter from 3.1% in Q1. This rise in in inflation occurs even as economic activity and spending is weakening. For some firms, rising costs are squeezing profit margins and curbing investment and hiring intentions. Consumer confidence has fallen sharply, and the housing market remains weak. Even as weak activity is seen dampening inflationary pressures in the medium term, the MPC concludes that the OCR will most likely need to increase sooner and by more than envisaged in February. Data in the new monetary policy statement suggest that the policy rate might average 2.5% in Q3, 3.1% next year to reach 3.3% at the end of the policy horizon. The RBNZ predicts growth stabilizing in Q2 followed by a modest 0.2% in Q3. They forecast average growth for this and next year at 0.7% and 1.7% respectively. The New Zealand 2-y government yield adds 4.5 bps to 3.54%. Money markets discount an 80% probability of a July rate hike. The kiwi dollar rises from the NZD/USD 0.584 area to currently trade near 0.5875.
Australian April CPI inflation data this morning showed a mixed picture. Headline inflation printed at 0.4% M/M and 4.2% Y/Y, down from 4.6% in March. However, trimmed mean annual inflation rose further to 3.4% from 3.3% in March. Of the 11 groups in the CPI, 7 have experienced a slowdown in annual growth from last month with transport prices moderating the most. Automotive fuel prices declined 7% M/M, as this fall includes a halving of the fuel exercise duty on April. The statistics agency assesses that the impact of higher oil prices filtered through to products and services with high freight and logistics costs. Annual housing inflation was 6.3% in the 12 months to April. This reflects rising costs for electricity, new dwellings and rents. The 2-y government bond yield eases slightly this morning (-5 bps to 4.54%). Markets attach an 80% to the scenario where the RBA still raises the policy rate by an additional 25 bps by year-end. The Aussie dollar eases marginally this morning (AUD/USD 0.715).
Upward Pressure on Swedish PPI Continues
In focus today
Today is quiet in terms of data releases. Focus remains on developments between the US and Iran and implications on markets.
Economic and market news
What happened overnight
In New Zealand, the Reserve Bank decided to maintain its cash rate at 2.25%, in line with market expectations. Despite holding rates steady, policymakers signalled that they will most likely need to increase rates sooner than envisaged in the February Monetary Policy Statement, with revised forecasts implying at least two more hikes by the end of the year.
What happened yesterday
In the US-Iran war, Iran condemned the US attacks on Iranian vessels and missile launch sites on Monday evening, arguing that they were a violation of the ceasefire. Iran's Revolutionary Guard reserved the right to retaliate. Despite the escalating tensions, back-channel talks between the two sides appear to continue, with both parties believed to be seeking a diplomatic resolution. Signs of normalisation are also emerging domestically, as Iran began restoring public internet access after one of the world's longest nationwide blackout periods.
In Sweden, April PPI increased 1.1% m/m and 4.7% y/y, up from 2.0% y/y in March, largely reflecting higher energy prices as expected. Export prices increased 2.5% m/m and import prices 3.3% m/m, with the main driver in the latter being higher crude oil prices. Domestically, prices fell but were offset by higher prices for refined petroleum products, as well as plastics, metals and motor vehicles. Looking ahead, further PPI increases are anticipated, driven by continued price pressures and ongoing supply disruptions.
In Hungary, the National Bank of Hungary held its base rate unchanged at 6.25%, as expected, with signals of easing ahead. A strengthening forint, buoyed by Péter Magyar's election as Prime Minister, has supported a favourable inflation outlook, contrasting sharply with inflation pressures in other EU countries.
Equities: Equities were generally higher yesterday, with US in catch-up from holidays. S&P500 up 0.6% but small cap Russell 2000 the standout, up 1.8%. It is rare to see small caps performing so strong in what many perceive as a narrow tech rally (16% vs S&P500 10% ytd). Especially, as consensus has turned from rate cuts to rate hikes over the last months. However, we continue to like small caps. Although tech took the attention in the last earnings season, the rest, "S&P 493" delivered the strongest earnings growth since 2021. Earnings are turning, macro support even higher earnings growth ahead and valuation is attractive.
This was another hot day for momentum stocks, up 3.4% in one go. Tech did the bulk of this, with Micron rallying 19% (!) after UBS tripled its price target. The chip frenzy is continuing in Asia this morning with Kospi up 4%. Samsung the standout, having reached a deal with workers this morning and averting the 18-day strike. This is actually good news for everyone, as a strike would have amplified the chip shortages even further. US and European futures are slightly higher this morning.
FI and FX: Brent oil is declining somewhat overnight from yesterday's peak of USD 100.5/bbl down to USD 98/bbl. Given the more limited move, US yields are also trading somewhat lower overnight with the 2Y UST at 4.015% and the 10Y at 4.47%. EUR/USD continues trading in a narrow range just above 1.16. In Norwegian markets we are beginning to see a reverse price action in FX relative to USD moves; when the USD strengthens the NOK does poorly and vice versa. RBNZ kept rates on hold at 2.25% as expected, but in a split decision where Governor Breman had the casting vote to keep rates on hold as three members voted for a hike. The NZD strengthened on the decision and front-end yields rose, as the bank signalled that the policy rate most likely will need to rise more and sooner than previously thought. Today's macro data calendar is thin.
Review of RBNZ: Waiting for Evidence
- As widely expected, the RBNZ held the OCR at 2.25%.
- The three internal members voted for no change – including the Governor, with her casting vote – and the three external members voted for a 25bp hike.
- The RBNZ’s revised OCR forecast signals three 25bp OCR increases in 2026 and a further modest lift in 2027.
- The RBNZ has significantly revised down its outlook for growth, but risks are viewed as still skewed to the downside.
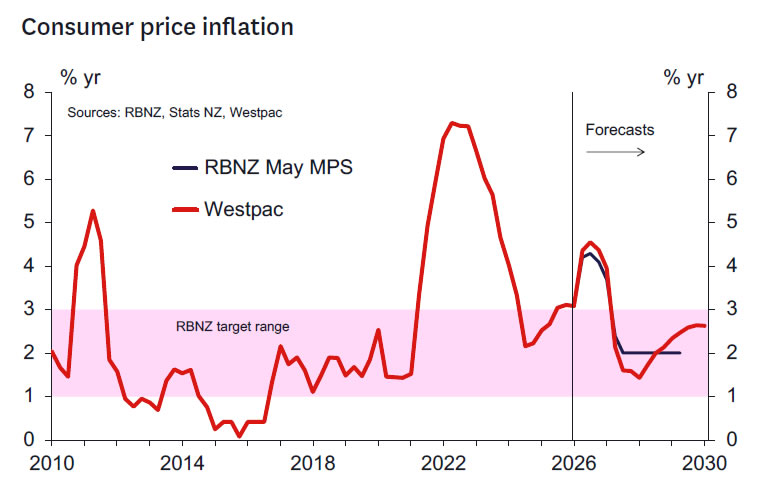
- The RBNZ has revised up its forecast of inflation to a peak of 4.3% in Q3 2026. While inflation is forecast to return to 2% in mid-2027, risks are viewed as skewed to the downside.
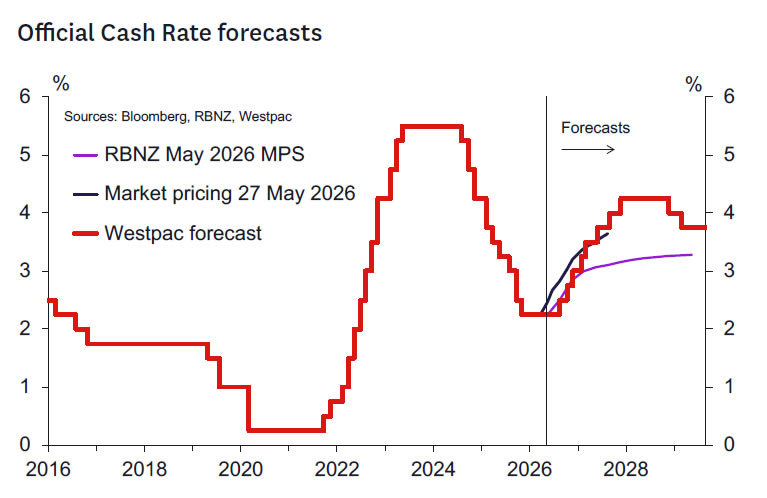
- Westpac continues to expect that the OCR will remain unchanged in July, and that it will be increased in September, October and December. Our medium-term OCR forecast remains unchanged.
- The delay in beginning the tightening cycle increases our confidence that the OCR will need to rise to 4.25% ultimately before inflation is sustainably returned to 2%. The Governor appears keen to wait until the RBNZ sees the “whites in the eyes” of core inflation before responding. That inevitably means the RBNZ will be late to the party.
Key take out: OCR rising in 2026, but a July start remains in the balance.
As widely expected, the RBNZ held the OCR at 2.25% and a vote was required to determine the outcome. Also as expected, the RBNZ’s revised projections include a pulling forward of the timing of projected policy tightening. The end 2026 OCR forecast was lifted to 2.84% - close to our 2.8% expectation.
The MPC seems finely balanced in terms of the start of the tightening cycle, but united in the view that the OCR rises towards 3% by the end of this year. Also, there is a strong sense that the OCR will ultimately need to increase to the low 3’s.
With a 3:3 split in the MPC the onus possibly falls to the internals and effectively the Governor to get over the line for a hike. These members are looking for evidence of increased core inflation, along with signs of pressure on wages and inflation expectations. We don't think the RBNZ will get meaningful information on that until just before the September meeting.
The other key factor is the progress of the war, which perhaps suggests this dovish group thinks that things might be resolved soon, allowing more room to wait. We think they will be disappointed there.
Another issue is the path of the data, with dovish members noting some data was weaker than expected. Looking ahead, our Q2 GDP forecast is -0.3% vs their 0%, so there is some scope for disappointment there. The Record of Meeting explicitly notes that the Committee sees the risks are to the downside for domestic growth. Neutral rate estimates were revised up perhaps more than we thought, but clearly laying the basis for increased rates soon enough.
The main fly in the ointment of this argument is the potential for a new MPC member be appointed – expected in June – and hence their view might be influential. Having said that, one wonders if a brand-new member will be keen on deviating from their internal colleagues’ opinion in that first meeting.
The bottom line is that the OCR is rising in 2026 and looks set to end 2026 at the 3% level we currently forecast. We are not convinced that the OCR will increase in July, given the lack of evidence we think will be available on core inflation, wages and long-term inflation expectations pressures. The Governor emphasized the role of long term 5–10-year inflation expectations in her assessment that expectations remain well anchored. Information on these indicators will not be available before the July meeting. Hence the thesis the RBNZ will wait to see the “whites of the eyes” of persistent inflation pressures remains the base case.
The RBNZ makes a strong case for a higher OCR this year but is delaying action. That’s unfortunate and does confer risks of a turnaround in the future and increases confidence that we will need to see 4% plus interest rates before CPI inflation is brought to heel. However, the Governor’s vote today was in line with her previous messaging which strongly suggested a high bar to consider lifting the OCR today. It seems sensible to assume she will continue to pursue that strategy. The big surprise was that it was the external members that have swung decidedly hawkish. That’s telling but the internal consensus needs to flip to get the tightening cycle going.
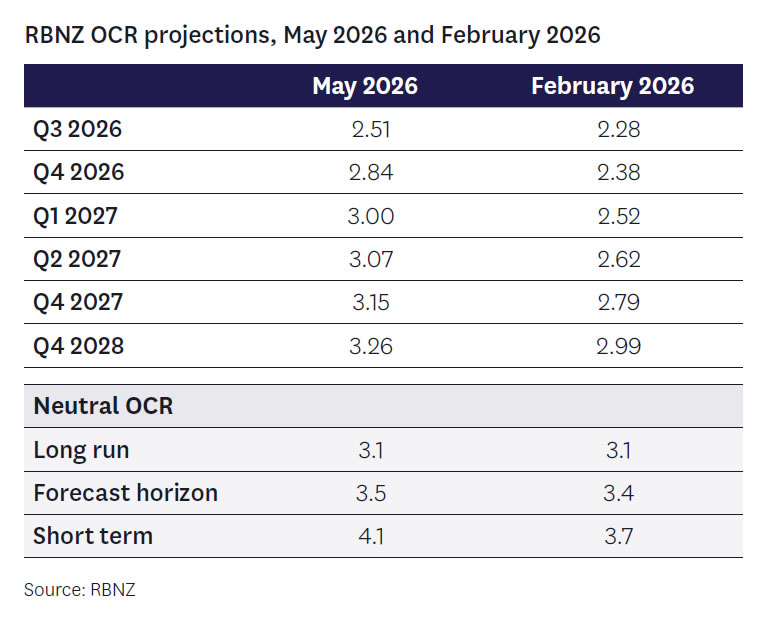
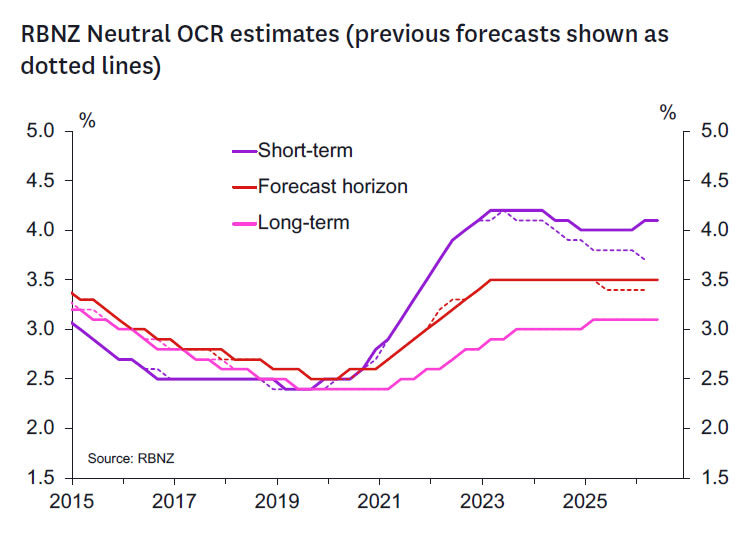
The RBNZ’s OCR projection has been revised higher and now peaks at 3.28% in June 2029 (their previous forecasts from February rose more gradually, peaking at 3% in 2029). There were also upward revisions to the RBNZ’s forecasts for the “short-term” and “forecast horizon” measures of the neutral level of the OCR (the “long-run” measure was unrevised).
The upward revision to the RBNZ’s OCR profile reflects the sharp rise in inflation pressures stemming from the Middle East conflict. While the recent rise in fuel prices is expected to be temporary, there are expected to be longer lasting pricing impacts that will add to the pressure on inflation at medium term horizons. The evolution of wage and price setting behaviour was noted as expected to be a key influence on how quickly the OCR will rise.
The RBNZ’s forecasts for the OCR in 2026 are similar to our own. However, after early 2027 the RBNZ’s forecasts rise more gradually compared to our own (as we expected).
Westpac’s OCR call.
We continue to expect no change in the OCR in July and 25bp hikes in September, October and December. Our longer-term OCR forecasts remain unchanged.
A July hike can’t be ruled out and probably hinges on the strength of the economy and the assessment of the level of excess capacity that comes to light between now and July. We suspect their concerns on further downside risks will be borne out.
We may get some additional colour from the Governor on the likelihood of a July hike in her post Statement media appearances.
RBNZ forecast detail.
Overall, the RBNZ’s forecasts for economic conditions are similar to our own.
On inflation, the RBNZ expects inflation will peak at 4.3% this year. That’s just slightly lower than our forecast for a peak of 4.5%. However, given the volatility in oil prices and broader ructions in the global economy, it’s not a major difference.
The RBNZ expects that inflation will drop back next year when oil prices eventually ease, and their forecast show annual inflation settling comfortably at 2% from mid- 2027. In contrast, we think that inflation could fall back more sharply next year. But that’s due to swings in oil prices, rather than a difference in views on underlying economic conditions.
However, while we see more downside risk for imported inflation next year, we continue to think the RBNZ is underestimating the upside risk for non-tradables prices (and hence overall inflation) at longer horizons. Despite a modest upwards revision to the RBNZ’s nontradables inflation forecasts, they still settle at relatively benign levels. In contrast, we expect the continued large increases in council rates and other administered prices will keep domestic inflation at firmer levels for an extended period. That risk has been compounded by the recent increases in global oil prices and other input costs.
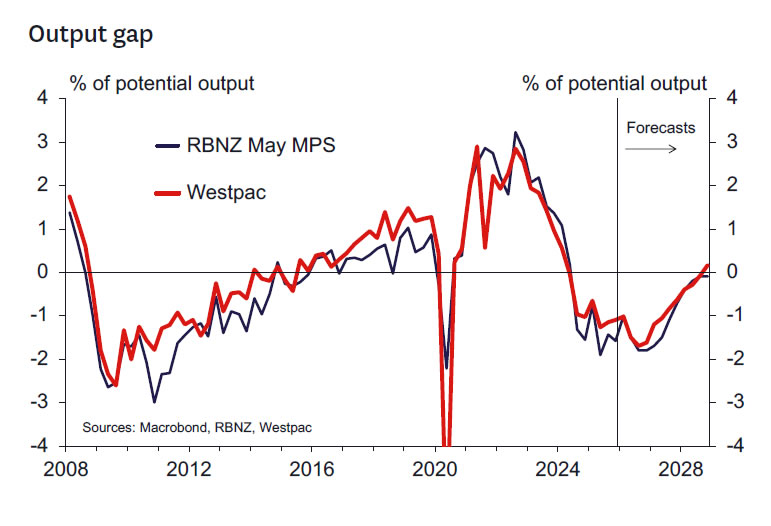
On activity, the RBNZ’s forecast for GDP growth, the labour market and the output gap are all broadly similar to our own. Forecasts for GDP growth have been revised down. Higher living costs are expected to be a drag on household spending. Similarly, the downturn in economic conditions is expected to dampen hiring and investment spending by businesses. That softness in demand is expected to offset some of the upward pressure on consumer prices, but not enough to prevent a sharp lift in inflation in the near term.
Alternative scenarios.
We’re not surprised to see that the RBNZ considered multiple scenarios around the outlook for the economy, given the current uncertainty stemming from the Middle East conflict. The focus of these scenarios, though, was the uncertainty around how economic activity and inflation might respond, rather than the path of oil prices per se.
- In the first scenario, the conflict lasts longer than assumed in the central projection, with Dubai crude oil prices reaching $120/bbl, holding there over the rest of this year, and only falling back as far as $100/bbl in later years. Firms respond by pre-emptively raising their prices in a coordinated manner, along the lines of the model that external MPC member Gai set out in his recent speech. Annual inflation peaks at 5.8%, and the OCR needs to rise faster and further to bring inflation back to target.
- The second scenario assumes the same oil price track as above, but with more restrained pricing behaviour by firms. Inflation does spike to around 5% in the near term, but does not become as persistent, and the OCR does not need to rise much more than in the baseline projections.
- The third scenario assumes the same oil price track as in the baseline forecasts, but with a larger negative demand shock for the global and domestic economies. Inflation initially spikes to around 4% but falls back within the target range more quickly as firms struggle to pass on higher costs, and the OCR remains on hold at 2.25% for some time to combat a further deterioration in demand.
The value of these scenarios is not in trying to predict exactly how things will pan out, but to convey the RBNZ’s response function under a range of different conditions. With that in mind, what can we take from these? One key takeout is that the policy responses are asymmetric in terms of time horizons. Under the first two scenarios, the OCR track doesn’t diverge much from the baseline projection until late 2026 or early 2027, as it takes time to determine whether second-round price effects are occurring beyond the initial oil price shock. In contrast, the weak demand scenario has an immediate impact – the OCR track allows no possibility of a hike in July, September, or any time soon. If we’re in the scenario 3 world, this will likely become apparent from the activity data over the next couple of months.
Notably, the RBNZ has only explored scenarios where oil prices are either in line with or higher than their central forecast. That leaves open the question of how the RBNZ would respond to a favourable oil price ‘shock’ – indeed, oil prices are currently below the RBNZ’s central projection, which would have been finalised a week ago. Presumably a sustained pullback in oil prices would bring the RBNZ somewhere closer to its pre-conflict view of the world – with the economy gradually recovering and the OCR eventually being raised to a more ‘neutral’ level.
Key things to watch ahead of the RBNZ’s 8 July OCR Review.
The next RBNZ policy review will take place on 8 July. A key focus between now and then will be on developments in the Middle East, and their impact on trading partner growth and key export and import commodity prices. The RBNZ’s scenarios seem to focus on the idea of higher for longer oil prices. While we think that’s appropriate, if oil prices shift by enough to bring down inflation forecasts significantly then this might assuage concerns of inflation persistence a bit.
The domestic data flow between now and then is relatively light. The most important domestic economic releases are:
- The Q1 GDP report (18 June): While this data largely predates the Middle East conflict, the outcome will be compared to the RBNZ’s estimate, with any deviation having implications for the RBNZ’s estimate of the output gap. The RBNZ’s forecast of 1.0% growth is slightly firmer than our own view (0.8%q/q).
- The May Selected Price Indexes (16 June): With the Q2 CPI report not released until 21 July, the RBNZ will have limited pricing data with which to assess whether inflation is beginning to broaden beyond the firstround direct impact of higher energy prices.
- The April and May filled jobs reports (28 May and 29 June): With the next Household Labour Force Survey not due until 5 August, the Monthly Employment Indicator will provide insight as to whether renewed business sector caution is spilling over into greater labour market slack.
In addition to the above, key monthly indicators such as the BusinessNZ manufacturing and services indexes (mid- June) and the ANZ Business Outlook survey (end of May and June) will also be of interest. The next QSBO survey is not released until 14 July, although it is possible that the RBNZ will receive a heads-up on how this is shaping up prior to the 8 July policy decision. Developments in retail spending and housing-related indicators will also be monitored to judge the how the energy price shock is impacting activity. The RBNZ will also monitor movements in key export commodity prices and financial conditions.
Notable quotes.
Some notable quotes from the today’s RBNZ commentary were as follows:
Current state of the economy
“ Domestically, business contacts and surveys indicate weaker confidence and spending. For some firms, rising costs are squeezing profit margins and curbing investment and hiring intentions”
“ Indicators of economic activity have deteriorated, in some cases more quickly than anticipated.”
The Middle East
“ The Committee noted that the outlook for energy prices depends on how the conflict evolves, the extent of damage to energy infrastructure in the Middle East, and the speed with which global supply chains adjust.”
“ Members noted that these events will encourage firms to permanently reconfigure their supply chains to reduce exposure to the region. Along with stronger global demand for renewable energy, this may place further upward pressure on global energy prices in the near term.
Growth outlook
“ Near-term economic activity is likely to be weaker than assumed…”
“ Annual GDP growth in 2026 is now expected to be 0.9 percentage points lower…”
“ The balance of risks is… to the downside for growth.”
Output gap/excess capacity
“ Unemployment remains elevated, indicative of spare capacity in the labour market.”
“ Spare capacity in the economy is likely to dampen second-round inflationary pressure.”
Inflation outlook
“ Inflation is expected to peak at 4.3 percent in the September quarter…and to return to the 2 percent target mid-point in mid-2027.”
Inflation expectations
“ Medium- to long-term inflation expectations remain consistent with inflation returning to the 2 percent target mid-point…”
“ While shorter-term inflation expectations have increased, medium- to longer-term expectations remain close to 2 percent.”
Current policy stance
“ Financial conditions have tightened materially this year…”
Risks to the inflation outlook
“ The balance of risks is to the upside for inflation…” Global growth
“ New Zealand’s trading partners are expected to see weaker growth and higher inflation.”
“ The Middle East conflict poses downside risks to global economic activity.”
Outlook for monetary policy
“ The OCR will most likely need to increase sooner and by more than envisaged…”
“ All Committee members agreed that increasing the OCR at upcoming meetings would likely be necessary…”
“ The pace of OCR increases will depend on… wage- and price-setting behaviour versus weaker economic activity…”
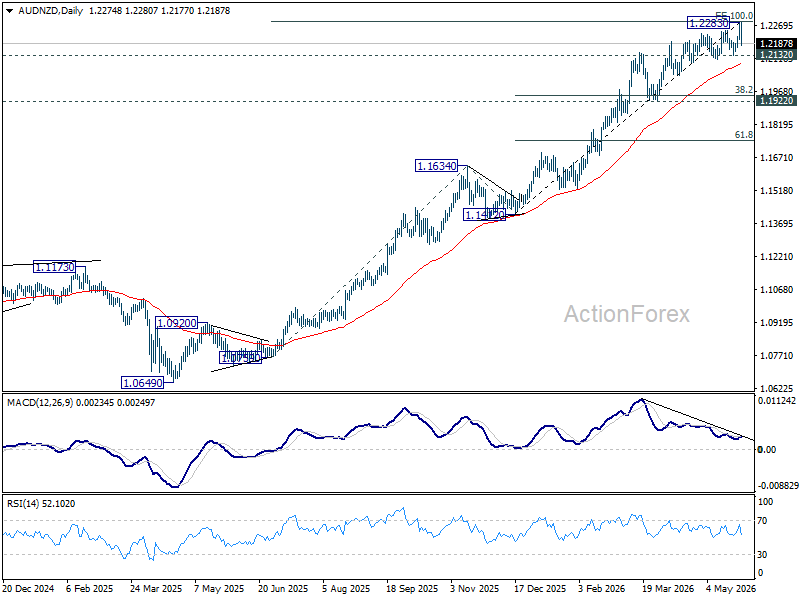
AUD/NZD Correction Risk Growing After RBNZ and Australia CPI, But Confirmation Still Missing
AUD/NZD may finally be running into a wall. After months of powerful upside momentum, today’s combination of a hawkish RBNZ shock and softer Australian inflation data delivered the strongest challenge yet to the pair’s medium-term uptrend. The correction risks are clearly growing — but markets still are not fully convinced the reversal has truly started.
That missing confirmation matters. If AUD/NZD cannot break lower in the next few days through support at 1.2132, traders may need to wait longer for the correction trade to fully develop. In that scenario, markets would likely need additional weak Australian data — softer employment numbers, slower core inflation, or broader evidence that economic slack is opening up more rapidly — before aggressively repricing expectations for the RBA
The bigger surprise came from New Zealand. The Reserve Bank of New Zealand may have kept rates unchanged at 2.25%, but the details underneath were aggressively hawkish. The Committee split 3-3 between holding and hiking immediately, forcing Governor Anna Breman to use her casting vote to leave policy unchanged. More importantly, the RBNZ openly signaled that hikes are likely coming soon. Breman said “OCR increases are likely at coming meetings” and warned that “even if Gulf conflict stops now, we still see inflation effects ahead.” In practical terms, the July meeting is now fully live for a rate hike.
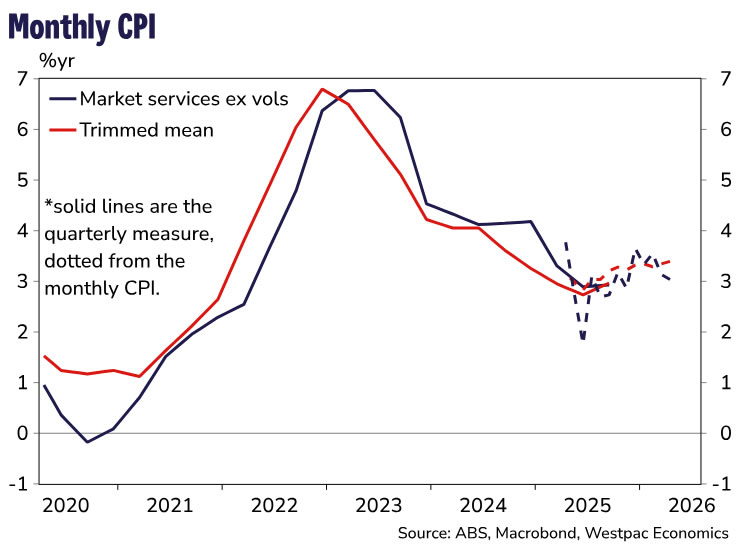
Australia delivered the opposite side of the divergence trade. Headline CPI slowed more than expected from 4.6% yoy to 4.2% yoy, easing some immediate pressure on the Reserve Bank of Australia. While core inflation remains sticky at 3.4%, the recent deterioration in labor market data has increasingly strengthened the case for patience. Markets now see June as effectively locked for a hold, while the RBA may also prefer waiting until August before deciding whether another “insurance hike” is really necessary.
Technically, the charts are also aligning with the macro divergence story. AUD/NZD pushed higher to 1.2283 this week but struggled to sustain gains through the major 100% projection of 1.0759 to 1.1634 from 1.1412 at 1.2287. At the same time, bearish divergence on D MACD continues warning that upside momentum is fading.
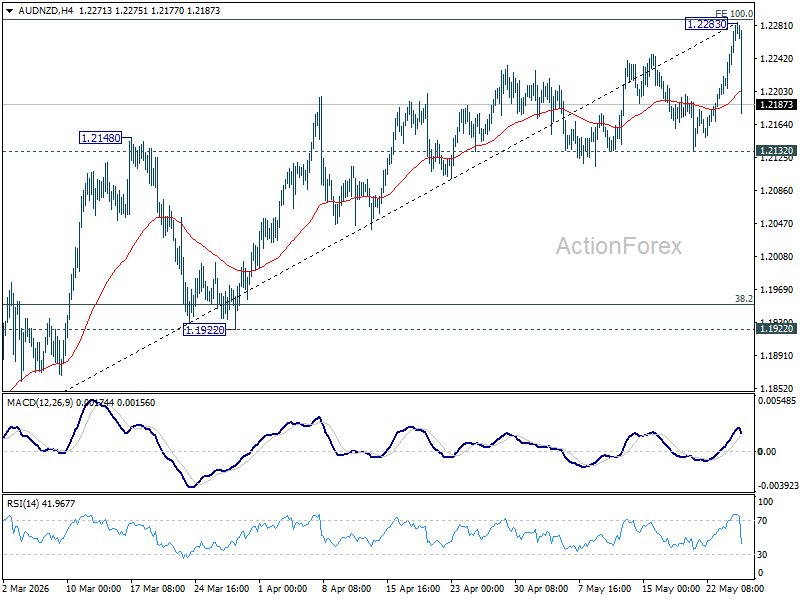
Still, the market has not yet delivered the decisive breakdown bears are waiting for. A firm break below 1.2132 would confirm medium-term topping and expose the 1.1922/50 support zone next. Until that happens, traders may still need more evidence that Australia’s economy is weakening quickly enough to fully justify a larger AUD/NZD correction.
(RBNZ) OCR on hold at 2.25%
The Monetary Policy Committee today voted to hold the OCR at 2.25 percent.
Annual consumers price inflation was 3.1 percent in the March quarter. The Middle East conflict is increasing near-term inflation and weakening economic activity. Inflation is expected to peak at 4.3 percent in the September quarter and to return to the 2 percent target mid-point in mid-2027. Currently, core inflation, wage growth, and medium- to long-term inflation expectations remain consistent with inflation returning to the 2-percent target mid-point over the medium term.
The global economic backdrop remains uncertain. Supply chain disruptions, higher prices for petrochemicals, and a more fragmented global trading environment are impacting the outlook. Growth will vary across countries, reflecting differences in energy intensity, fiscal support, and exposure to AI investment. On balance, New Zealand’s trading partners are expected to see weaker growth and higher inflation.
Domestically, business contacts and surveys indicate weaker confidence and spending. For some firms, rising costs are squeezing profit margins and curbing investment and hiring intentions. Consumer confidence has fallen sharply, and the housing market remains weak. Economic conditions continue to differ across regions and sectors, with high commodity prices supporting incomes in regional New Zealand.
The outlook for medium-term inflation pressures is also uncertain. These could remain elevated if households and businesses expect higher costs in future and build those expectations into price- and wage-setting decisions today. However, weak demand and elevated unemployment will dampen medium-term inflation pressures.
The Committee remains focused on ensuring that increased costs do not lead to elevated inflation over the medium term, while avoiding unnecessary economic volatility. On balance, the OCR will most likely need to increase sooner and by more than envisaged in the February Monetary Policy Statement. The pace of OCR increases will depend on the relative influence of persistent wage- and price-setting behaviour versus weaker economic activity on medium-term inflation pressures.
Summary record of meeting – May 2026
The ongoing conflict in the Middle East is weakening economic activity and increasing near-term inflation. The Committee remains focused on ensuring that higher costs do not lead to elevated inflation over the medium term, while avoiding unnecessary economic volatility. A prolonged period of weak economic growth and elevated unemployment is expected to dampen medium-term inflationary effects. The Committee judges that the balance of risks is to the upside for inflation and to the downside for growth.
Conflict in the Middle East is disrupting global supply chains
The Middle East conflict has severely disrupted the supply of oil, gas and other petroleum products transiting through the Strait of Hormuz. The decline in oil supply has so far been mitigated through inventory drawdowns, rerouting, increased production elsewhere, and demand adjustment in some countries. This helped contain oil price increases over April and May, despite no resolution to the conflict. Nevertheless, prices for petroleum products have increased substantially since the conflict began, increasing prices for fuel and other petrochemical-intensive inputs such as plastics and fertilisers.
The Committee noted that the outlook for energy prices depends on how the conflict evolves, the extent of damage to energy infrastructure in the Middle East, and the speed with which global supply chains adjust. Members noted that these events will encourage firms to permanently reconfigure their supply chains to reduce exposure to the region. Along with stronger global demand for renewable energy, this may place further upward pressure on global energy prices in the near term.
Pricing in oil futures markets is consistent with a resolution to the conflict over coming months and shipping resuming through the Strait of Hormuz. However, given damage to energy infrastructure and the need to rebuild inventories, oil prices are expected to remain elevated over the medium term.
Trading partner inflation is increasing
The Committee noted that higher energy prices have increased headline inflation in many of New Zealand’s trading partners in recent months. Trading partner inflation is expected to increase further as the direct and indirect effects of higher costs emerge. Members noted that the pass-through of higher costs to near-term inflation will vary across economies, depending on factors such as energy intensity, price controls, subsidies, or tax changes. Differences in current economic conditions, including the degree of capacity pressure, will influence the extent of medium-term inflation pressures across trading partners.
The Middle East conflict poses downside risks to global economic activity. High-frequency indicators suggest that higher petrochemical prices are weighing on sentiment and real incomes in many economies. The impact is expected to be largest for economies with greater reliance on imported energy and energy-intensive manufacturing, including many of New Zealand’s Asian trading partners. In some cases, these headwinds may be partly offset by continued strong demand for artificial intelligence exports and fiscal support.
The New Zealand economy was recovering prior to the conflict
The Committee noted New Zealand was in the early stages of an economic recovery. GDP growth of 0.2 percent in the December 2025 quarter was lower than expected, but timely indicators suggest the economy continued to expand in the March 2026 quarter. For example, strength in retail spending broadened across industries and businesses reported increasing capacity constraints, consistent with the economic recovery gaining momentum.
There has been significant spare capacity in the New Zealand economy for some time. This is reflected in a range of indicators, with the output gap estimated to be -1.3 percent of potential output in the March 2026 quarter, broadly in line with the estimate in February.
The labour market was stabilising, with employment growing modestly and annual wage inflation remaining at 2 percent in the March 2026 quarter. Net migration has increased materially since late 2025. Unemployment remains elevated, indicative of spare capacity in the labour market.
Annual headline inflation remained at 3.1 percent in the March 2026 quarter, which was higher than expected in the February Statement largely due to fuel price increases over March. Underlying inflation has continued to gradually ease, with measures of core inflation declining on average to 2.3 percent.
Near-term inflation is expected to increase and economic growth to weaken
First round direct and indirect effects from higher petrochemical prices will increase inflation this year. Direct effects, through higher fuel prices for businesses, are expected to occur slightly faster than the indirect effects of higher prices of petrochemical-intensive inputs. Intelligence from business engagements indicates that some firms have implemented temporary fuel surcharges, although the extent of this varies across sectors. Some businesses are absorbing cost increases into margins given weak demand, while others are embedding higher costs into price changes.
The Committee noted elevated uncertainty around its near-term inflation forecast. The forecast incorporates current oil futures pricing, which assumes Dubai oil prices fall to USD96 by the end of the year. Annual headline inflation is expected to increase to a peak of 4.3 percent by the September 2026 quarter and to return to the target mid-point in mid-2027. While shorter-term inflation expectations have increased, medium- to longer-term expectations remain close to 2 percent.
Near-term economic activity is likely to be weaker than assumed in the February Statement because of the Middle East conflict. Higher fuel prices are increasing costs, lowering profit margins for many businesses, and reducing real incomes and household purchasing power. High frequency data, including electronic card transactions and measures of business and consumer confidence, are pointing to weak demand in the near term. With weaker consumption and investment, annual GDP growth in 2026 is now expected to be 0.9 percentage points lower than assumed in the February Statement. These forecasts indicate a slower economic recovery in the near term, with the pace of economic growth increasing by the end of the year.
Financial conditions have tightened
Market expectations for central bank policy rates have increased, both domestically and abroad. The Committee discussed how differences in economic starting points, fiscal and structural policy responses to higher fuel prices, and reliance on imported energy will influence the monetary policy response required to contain medium-term inflation across countries.
The Committee noted that financial conditions in New Zealand have tightened through higher wholesale interest rates passing through to higher fixed-term mortgage rates and, to a lesser extent, term deposit rates. The average interest rate on outstanding mortgages declined to 4.9 percent in March but is expected to increase to 5.3 percent over the next 12 months.
Global financial market volatility increased materially in March because of the Middle East conflict but declined following the ceasefire in early April. Global risk appetite has subsequently improved, in part due to strong upward revisions to earnings growth among US technology firms pushing up global equity prices. There has been some volatility in the trade-weighted New Zealand dollar exchange rate, but it is currently little changed since the start of the year.
The Committee was also briefed on financial system stability and agreed this poses no material trade-off to meeting its inflation objective.
The Committee discussed risks to the inflation outlook
Members noted uncertainty around the scale and duration of the global economic consequences of the Middle East conflict and how the shock will propagate through the New Zealand economy and influence medium-term inflation pressures.
The Committee discussed the risk of higher near-term inflation feeding through to medium-term inflation. Members noted that firms’ price-setting behaviour could be more persistent because of generally elevated inflation since the pandemic and the cost-push nature of the current shock. This would lead to stronger second-round inflation effects than currently assumed. This risk is accentuated by low profit margins for some businesses given weak activity and higher costs, limiting the degree to which they can absorb further cost increases. Wage pressures could also arise from labour shortages in some sectors and regions. However, if the recent increase in net migration continues, this would help to offset this risk.
Members noted that spare capacity in the domestic economy and weaker global demand could constrain firms’ ability to pass on higher costs by more than assumed in the central projection. Lower spending by households in response to lower real income growth, persistently elevated unemployment, a weak housing market, and reduced resilience due to repeated shocks collectively pose downside risks to domestic economic activity. However, economic activity could recover faster than assumed if a resolution to the Middle East conflict leads to lower domestic fuel prices.
The Committee discussed risks to the global growth outlook. To the downside, members noted that high and increasing global government debt ratios, alongside greater geopolitical fragmentation, could push up long-term bond yields, tightening financial conditions and weighing on global growth. The Committee also noted that earnings expectations and valuations in US equity markets remain elevated and that if revenues from AI products fail to meet expectations, this could lead to a shock that would pose downside risks to global growth.
To the upside, members agreed that demand for New Zealand’s exports could remain stronger than expected if our Asian trading partners continue to benefit from strong manufacturing investment. Greater investment from large technology firms, alongside stronger investment in economic and military security, may also continue to provide a tailwind to the global economy through stronger economic activity in Asia, Europe and the US.
The Committee noted the three alternative scenarios in the May Statement. These informed the trade-offs influencing the Committee’s discussions and decisions. The scenarios represent just three of many plausible paths for the domestic economy and inflation. In practice, monetary policy decisions depend on a broad range of factors, including prevailing economic conditions, the outlook for medium-term inflation pressure, and the Committee’s secondary objectives of avoiding unnecessary instability in the economy while having regard to financial system stability.
The Committee voted to leave the OCR unchanged at 2.25 percent
The Committee emphasised that it remains focused on ensuring core inflation, wage growth and medium- and long-term inflation expectations remain consistent with inflation at 2 percent over the medium term. It discussed the monetary conditions required to achieve the medium-term inflation mandate. Members noted that financial conditions have tightened materially this year, helping to guard against the risk of second-round price effects.
All Committee members agreed that the central projection for the OCR was appropriate and a good reflection of the trade-offs currently faced. However, members differed in their preferred timing for the initial increase in the OCR.
Three members (Anna Breman, Karen Silk, Paul Conway) judged that holding the OCR at 2.25 percent was appropriate at this meeting. These members emphasised that core inflation and wage growth remain contained and medium- and long-term inflation expectations remain around 2 percent. Indicators of economic activity have deteriorated, in some cases more quickly than anticipated. Tighter financial conditions and economic uncertainty are already weighing on household and business sentiment, which is reducing consumption and investment. Spare capacity in the economy is likely to dampen second-round inflationary pressure.
With inflation pressures increasing in coming months, these members agreed that OCR increases would be required to ensure inflation returns to target over the medium term. These members noted the wide range of estimates for the neutral interest rate, making it difficult to assess the extent to which current monetary conditions are accommodative. They emphasised that the timing of OCR increases should depend on the evolving data, the outlook, and the balance of risks. Close attention needs to be paid to global developments, supply chain normalisation, core inflation, wage dynamics, and inflation expectations. These data, as well high-frequency indicators, will clarify whether stronger second-round inflation effects are emerging.
Three members (Carl Hansen, Hayley Gourley, Prasanna Gai) preferred to increase the OCR by 25 basis points, to 2.5 percent at this meeting. These members emphasised that, given the breadth of critical inputs that have been impacted by the conflict, first round indirect price increases could become more broad-based, feeding through to a greater risk of second round price increases. These members noted that 2-year inflation expectations have risen across a range of surveys. Firms may reset prices based on a shared belief about the persistence of the shock and prices would remain elevated even if the shock were to fade. In addition, should domestic fuel prices decline faster than expected it may lead to stronger demand as confidence responds more quickly. These members noted that monetary conditions remained accommodative. Further, inflation in New Zealand’s trading partners could increase faster than expected due to both the Middle East conflict constraining supply and AI-related spending boosting demand.
These members judged that removing stimulus now, while observing domestic economic developments, would help reduce medium-term inflation risks. Moving earlier was viewed as preferable, given upward pressure on neutral rates and that it may also limit the overall magnitude of the increase in the OCR and the negative impact on output. One member (Carl Hansen) emphasised that raising the OCR at this meeting would also create optionality for further monetary policy tightening in July.
All Committee members agreed that increasing the OCR at upcoming meetings would likely be necessary to ensure higher near-term inflation does not feed through to higher medium-term inflation. The Committee judges that this is a proportionate response to bring inflation to target in a reasonable timeframe without creating unnecessary volatility in output. The pace of OCR increases will depend on the relative influence of persistent wage- and price-setting behaviour versus weaker economic activity on medium-term inflation pressures.
On Wednesday 27 May, three Committee members (Anna Breman, Karen Silk, Paul Conway) voted to leave the OCR on hold and three members (Carl Hansen, Hayley Gourley, Prasanna Gai) voted for a 25-basis point increase. In this instance, the chairperson has a casting vote, meaning the OCR remains on hold at 2.25 percent. The Committee remains focussed on bringing medium-term inflation back to target and expect that OCR increases will be required this year.
Attendees:
MPC members: Anna Breman (chairperson), Carl Hansen, Hayley Gourley, Karen Silk, Paul Conway, Prasanna Gai
Treasury Observer: James Beard
MPC Secretary: Elliot Jones
First Impressions – Australia April CPI
The April CPI rose 0.4%mth to be up 4.2%yr.
The April CPI rose 0.4%mth to be up 4.2%yr. This represents a moderation from the 4.6%yr pace recorded in March and came in below Westpac's near-cast of 0.9%mth/4.8%yr and market expectations of 4.4%yr. April is normally a seasonally strong month; the seasonally adjusted figure recorded a fall (–0.1%mth), compared with our nowcast of 0.3%mth. Much of the miss was concentrated in volatile or policy-affected items that do not speak to the pass-through of energy prices and other supply effects stemming from the conflict in the Middle East.
The miss to the downside was from:
- a sharper-than-expected decline in transport (–2.7%mth vs our –1.1% near-cast, subtracting 0.3ppts)
- a softer international travel result (+3.4%mth vs +9.7%mth).
- a fall in fruit prices also contributed to the weakness (-2.2%mth vs +4.6%mth)
- a softer rise in clothing & footwear prices (3.9%mth vs 4.7%mth).
On the upside:
- health was firmer than expected (+2.6%mth vs +1.9%mth), contributing 0.2ppts.
- new dwelling purchase prices picked-up further in April, rising 0.7%mth above our expectations for a 0.4%mth lift. This was the largest increase since November 2023.
- rents were broadly on par with last month’s increase and our expectations (0.2%mth).
The monthly Trimmed Mean rose 0.3%mth, slighter softer than our expectations for a 0.4%mth lift. Nevertheless, the annual pace lifted slightly to 3.4%yr from 3.3%yr in prior month. The six-month annualised paced continued to ease, down to 3.2% from 3.8% in December.
While the headline April CPI was softer than expected, underlying inflation pressures are still building. The April data show clearer evidence of emerging pass-through of upstream costs. Home-building is the most obvious example, but ongoing above-target inflation in categories such as takeaway food and restaurant meals are also consistent with pass-through building.
The lift in upstream costs flowing into selling prices is also evident in the NAB business survey and ABS business indicators. Further construction trade price increases and the new fuel recovery rule for transport operators will add to near-term cost pressures. Consequently, we still expect Trimmed Mean inflation to rise to around 4% over the coming quarters.
While the headline figure was a (welcome) downside surprise, it was not a view-changing one.
As the RBA has also highlighted in recent research, pass-through of higher energy and regulatory costs to other prices is likely to be larger and faster than normal given the size of the shock. Today’s data showed some signs of this pattern, just not as much as we feared. We also think the RBA will mostly look through the apparent weakness in April labour force data, alert to the same unusual seasonality that we noted last week.
WTI Crude Oil Finds Stability Above Support, Upside Risks Reemerge
Key Highlights
- WTI Crude Oil corrected gains and traded below $100 before the bulls appeared.
- A few key hurdles are forming near $100.60 and $102.60 on the 4-hour chart of XTI/USD.
- Gold could extend losses if there is a close below $4,450.
- Bitcoin declined below $75,000 before it recovered some losses.
WTI Crude Oil Price Technical Analysis
WTI Crude Oil prices declined heavily below $105 and $102 against the US Dollar. The price even dipped below $100 before the bulls stepped in.
Looking at the 4-hour chart of XTI/USD, the price traded as low as $92.30. It settled below $100, the 100 simple moving average (red, 4-hour), and the 200 simple moving average (green, 4-hour).
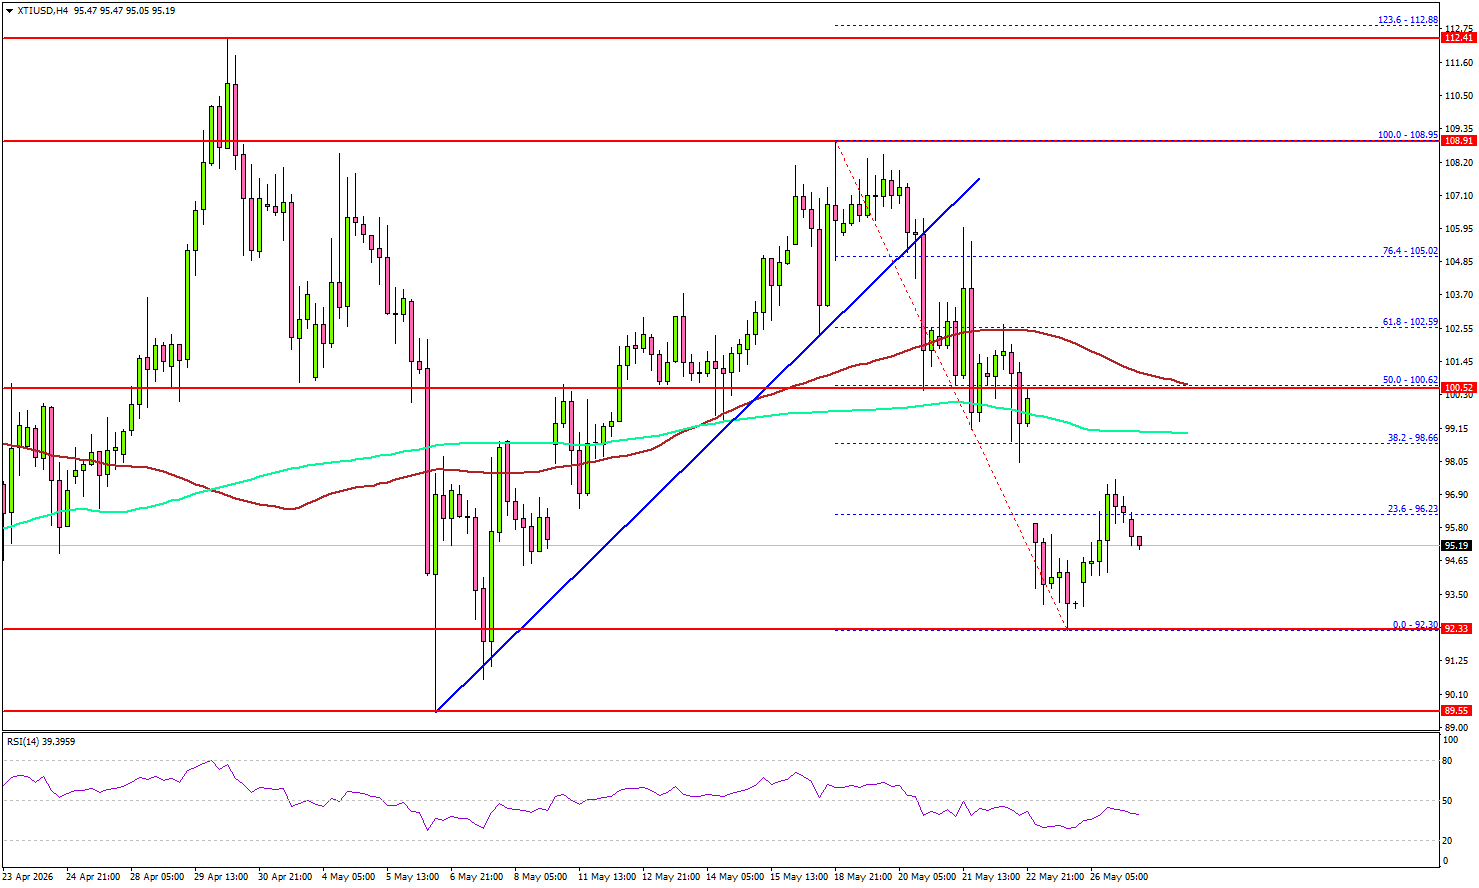
Recently, there was a recovery wave above the 23.6% Fib retracement level of the downward move from the $108.95 swing high to the $92.30 low. On the upside, immediate resistance is near the $95.65 level.
The first key hurdle for the bulls could be $100.60, the 100 simple moving average (red, 4-hour), and the 50% Fib retracement level. A close above $100.60 might send Oil prices toward $102.60. Any more gains might call for a test of $105.00 in the near term.
On the downside, the first major support sits near the $94.20 zone. The next support could be $92.30, below which the price could dive and test $90.00. A daily close below $90.00 could open the doors for a larger decline. In the stated case, the bears might aim for a drop toward $85.00.
Looking at Gold, the bears are still active below the key resistance at $4,620. The main support sits at $4,450.
Economic Releases to Watch Today
- Fed's Logan speech.
- Richmond Fed Manufacturing Index for May 2026 – Forecast 4, versus 3 previous.
Cryptos Fail to Generate Momentum Amid Continuous Confusion – BTC and Ethereum Technical Outlook
- Bitcoin and Ethereum continue to move sideways amid ongoing uncertainty over the Iran peace process.
- Cryptos are not following Nasdaq as strongly as before, pointing to underlying digital asset weakness.
- Exploring technical analysis and trading levels for Bitcoin and Ethereum.
Bitcoin and other cryptos are stuck in a narrow, frustrating range as uncertainty around the Iran peace process continues.
Unlike traditional risk assets, cryptocurrencies are not following the recent surge in US stocks. While stock benchmarks hit new all-time highs after news from the Strait of Hormuz, digital assets have barely reacted.
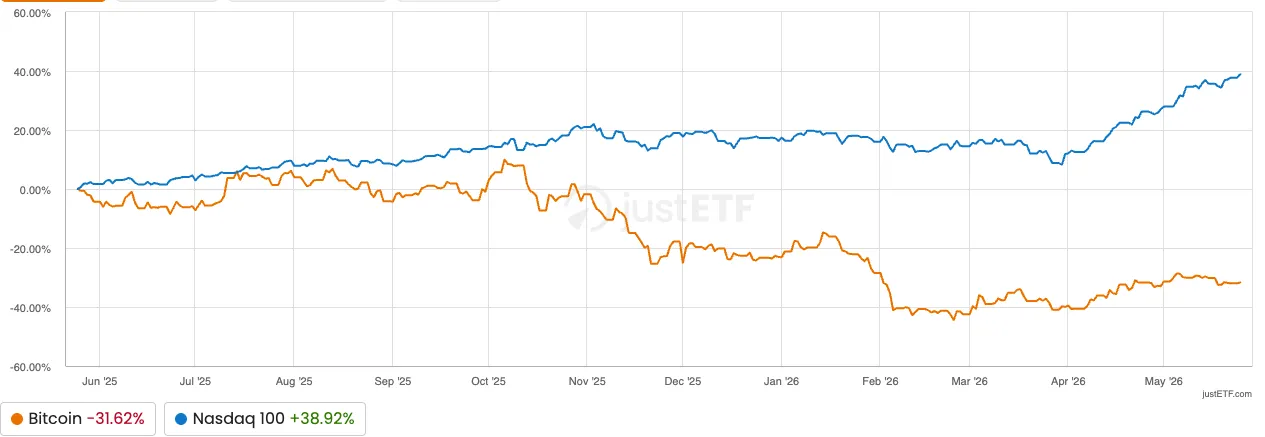
Bitcoin and Nasdaq correlation slowly fades – Source: JustETF.com. May 26, 2026.
Bitcoin is holding near $76,000 and showing signs of resistance on daily charts, rather than breaking out. This slow movement shows that cryptocurrencies are not tracking the tech-heavy Nasdaq as closely as they have in the past.
The recent split suggests weakness in digital assets, as crypto investors are hesitant to take a clear direction while the outcome of the peace process remains uncertain.
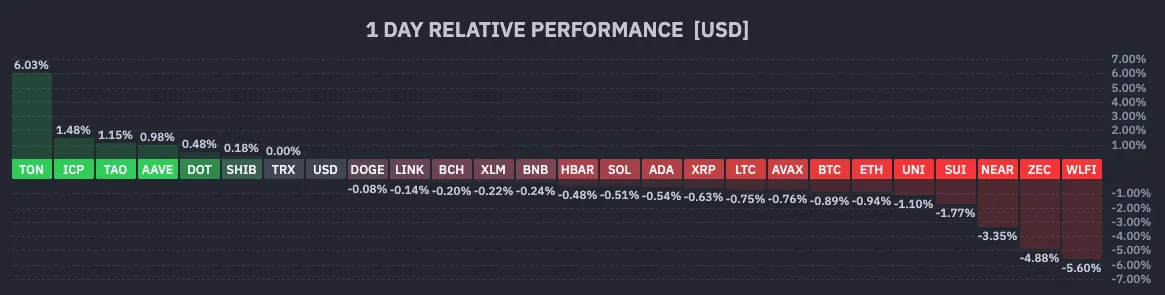
Daily Crypto Performance (16:37), May 26, 2026 – Courtesy of Finviz.
It is still unclear if this underperformance will last.
The lack of strong buying suggests that retail investors are holding back for now. However, Bitcoin is still holding its support levels even as the US Dollar rises, which shows that its base is solid, though some technical cracks may be starting to materialize.
The question remains: if the geopolitical situation stabilizes, is there still a chance for a strong catch-up rally?
Let’s dive into the technical analysis and key trading levels for both Bitcoin and Ethereum to assess whether a clear breakout is in play from here.
Bitcoin (BTC) Daily Chart and Technical Levels
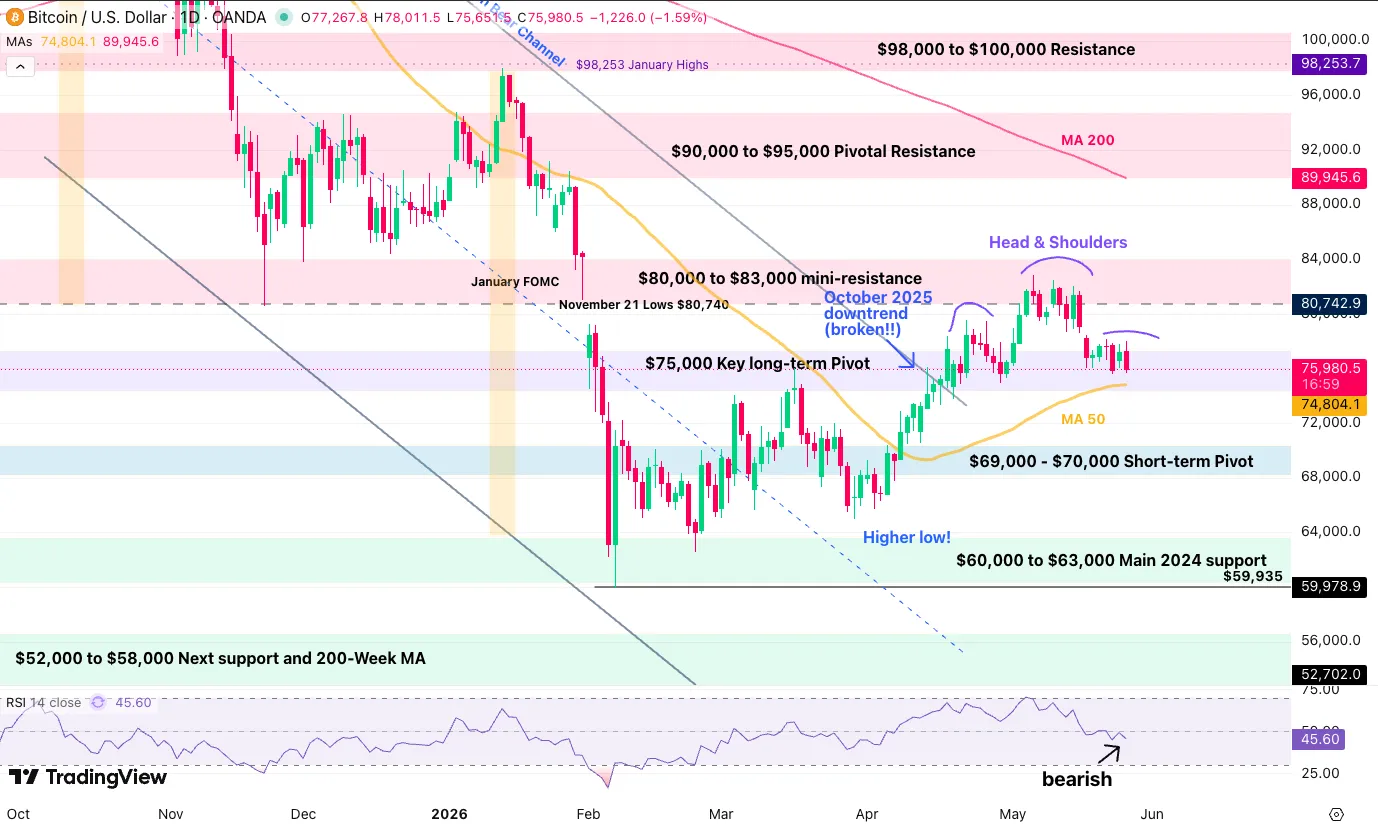
Bitcoin (BTC) Daily Chart, May 26, 2026 – Source: TradingView.
Bitcoin attempted a breakout above its long-term pivot but could not hold it amid low conviction over a clean development in the US-Iran peace process.
BTC could be forming a head-and-shoulders pattern, a bearish structure that could take the main crypto back toward $70,000 based on a measured-move approach.
Still, as long as it holds above its 50-day MA at $74,800, the outlook is more bullish-neutral than bearish.
Levels of Interest for BTC Trading:
Support Levels:
- 4H 200-period MA — $77,000
- $75,000 — Key long-term pivot, acting as resistance
- $70,000 — Short-term momentum pivot
- $60,000 to $63,000 — Main 2024 support and recent double bottom
- $59,935 — February lows
Resistance Levels:
- $74,800 — 50-day MA
- $80,000 to $83,000 — Mini-resistance, bullish above
- $82,500 — Cycle highs
- $90,000 to $95,000 — Minor resistance
- $98,000 to $100,000 — Pivotal resistance
- $124,000 to $126,000 — Current all-time high resistance
Ethereum (ETH) Daily Chart and Technical Levels
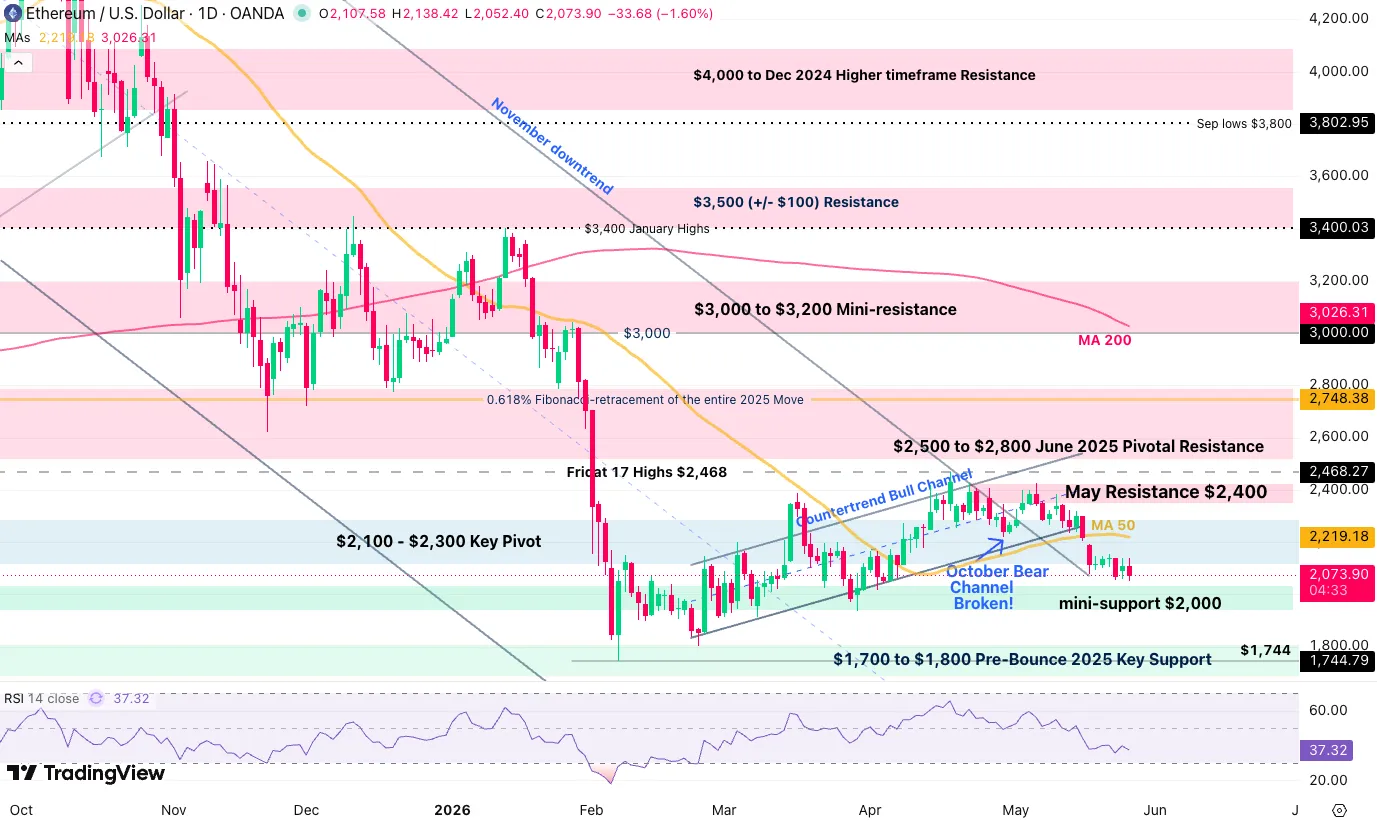
Ethereum (ETH) Daily Chart, May 26, 2026 – Source: TradingView.
Ethereum is still showing weaker action compared to Bitcoin, having broken below its 50-day moving average at $2,220 and only just holding above its October downtrend, leaving the crypto in a more balanced rather than bearish outlook.
Any move below $2,000 could accelerate the selloff across the broader altcoin market, but as long as price action remains above this key level, bulls can still remain optimistic.
Levels of Interest for ETH Trading:
Support Levels:
- $2,000 — Mini-support
- $1,700 to $1,800 — Pre-bounce 2025 key support, testing
- $1,744 — February 6 lows
- $1,380 to $1,500 — 2025 support
- $1,384 — 2025 lows
Resistance Levels:
- $2,220 — Daily 50 MA
- $2,400 — Mini-resistance
- $2,500 to $2,800 — June 2025 pivotal resistance
- $3,000 to $3,200 — Major momentum pivot and test of $3,000
- $4,950 — Current all-time high
The narrative is easing, but keep track of WTI crude and the latest headlines to stay ahead of the game.
Safe trades!