Sample Category Title
USD/CHF Weekly Outlook
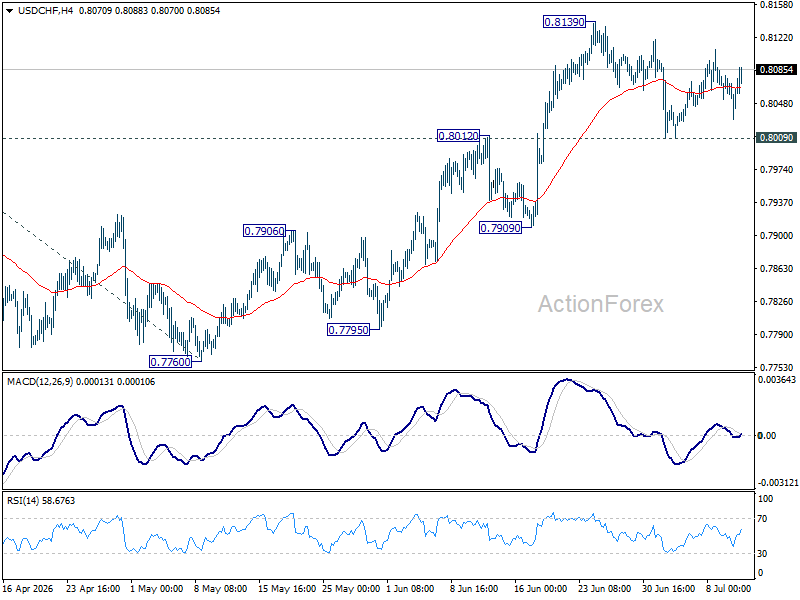
USD/CHF stayed in consolidations below 0.8139 last week and outlook is unchanged. Initial bias stays neutral this week first. With 0.8009 support intact, further rise is expected. On the upside, above 0.8139 will extend the rally from 0.7760 to 100% projection 0.7603 to 0.8041 from 0.7600 at 0.8198 next. However, sustained break of 0.8012 will bring deeper fall to 0.7909 support instead.
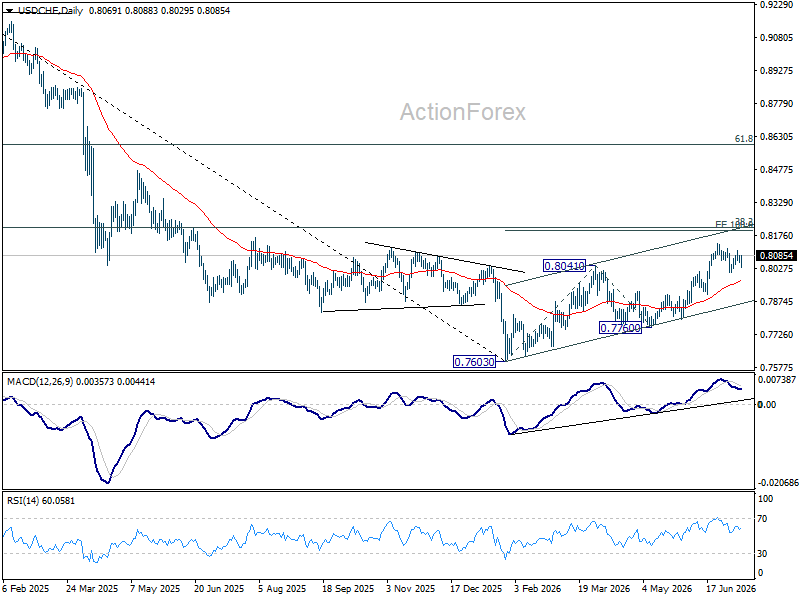
In the bigger picture, while a medium term bottom was formed at 0.7603, it's still early to call for bullish trend reversal. As long as 38.2% retracement of 0.9200 (2025 high) to 0.7603 at 0.8213 holds, the larger down trend could still continue through 0.7603 at a later stage. However, firm break of 0.7603 will argue that the trend has reversed and turn focus to 0.8332 support turned resistance (2023 low) for confirmation.
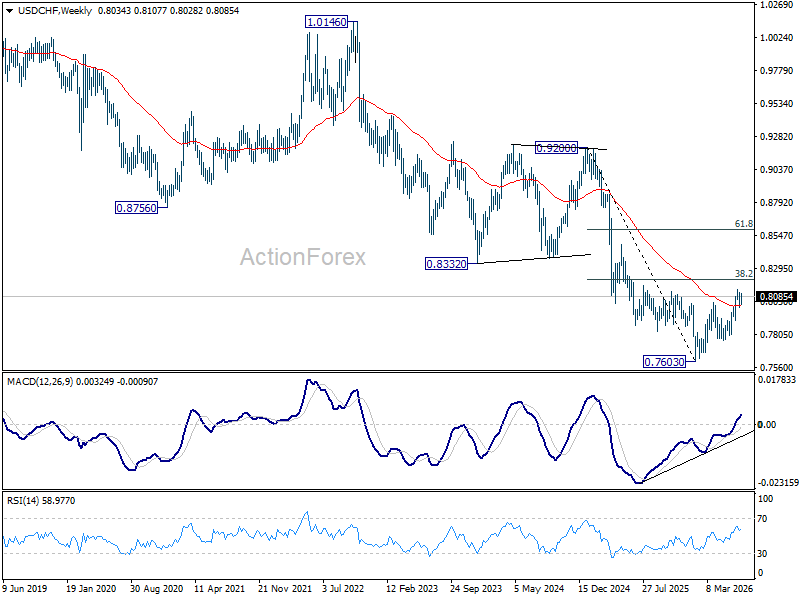
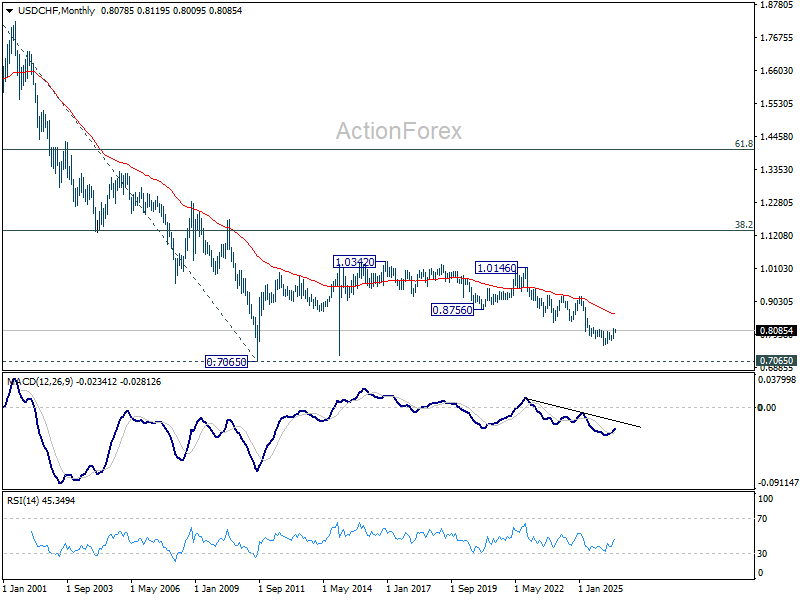
In the long term picture, price action from 0.7065 (2011 low) are seen as a corrective pattern to the multi-decade down trend from 1.8305 (2000 high). It's uncertain if the fall from 1.0342 is the second leg of the pattern, or resumption of the downtrend. But in either case, outlook will stay bearish as long as 0.8756 support turned resistance holds (2021 low). Retest of 0.7065 should be seen next.
AUD/USD Weekly Report
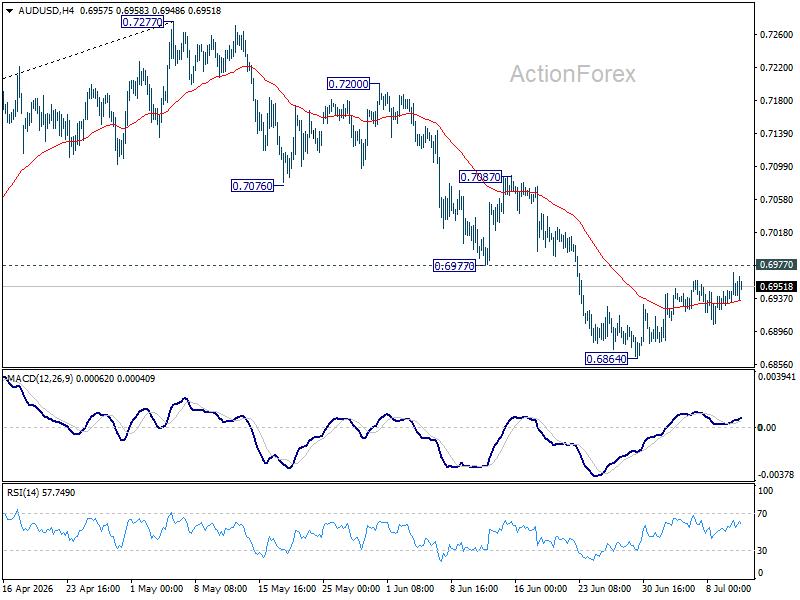
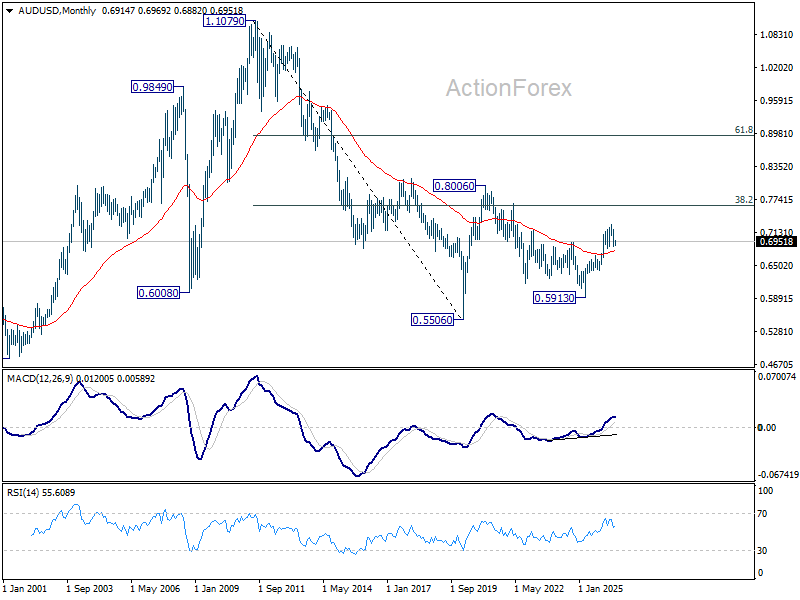
AUD/USD stayed in consolidations above 0.6864 last week and outlook is unchanged. Initial bias remains neutral this week first. Further fall is expected as long as 0.6977 support turned resistance holds. Below 0.6864 will target 0.6832 support. Firm break there will target 0.6756 fibonacci level. However, sustained break of 0.6977 will bring stronger rebound to 0.7087 resistance instead.
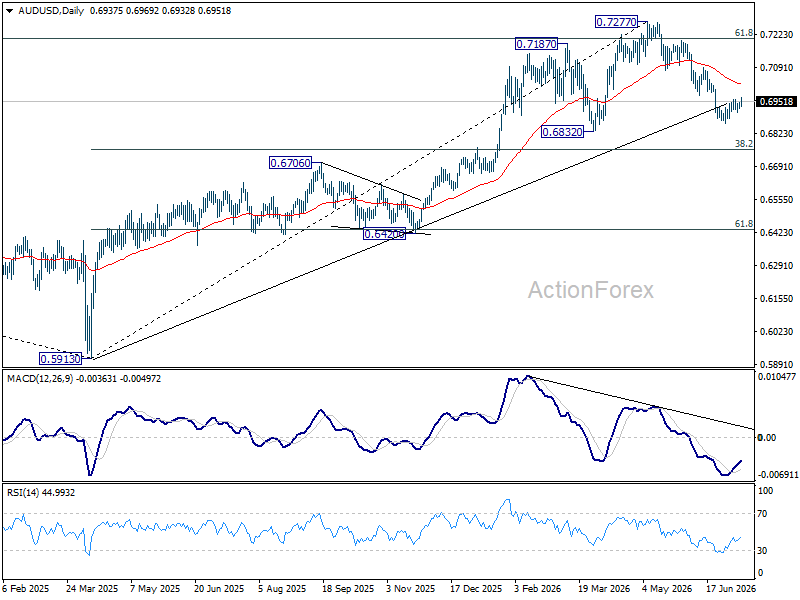
In the bigger picture, considering bearish divergence condition in D MACD, a medium term top could be formed at 0.7277 after failing to sustain above 61.8% retracement of 0.8006 (2021 high) to 0.5913 (2024 low) at 0.7206. Deeper fall could be seen to 38.2% retracement of 0.5913 to 0.7277 at 0.6756 as a correction. But strong support should be seen there to bring rebound. Consolidations would continue below 0.7277 for a while.
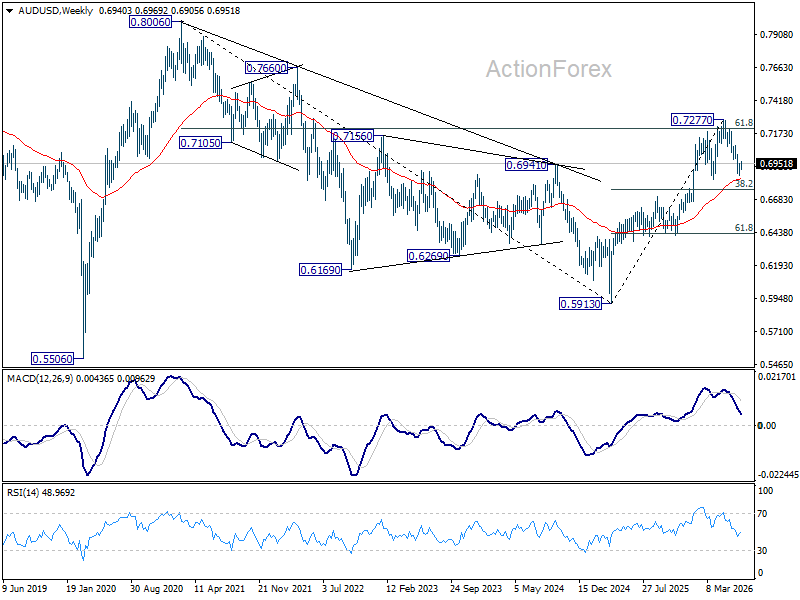
In the long term picture, rise from 0.5913 is seen as the third leg of the whole pattern from 0.5506 (2020 low). It's still early to judge if this is an impulsive or corrective pattern. But in either case, further rise should be seen back to 0.8006 and possibly above. This will remain the favored case as long as 55 W EMA (now at 0.6838) holds.
USD/CAD Weekly Outlook
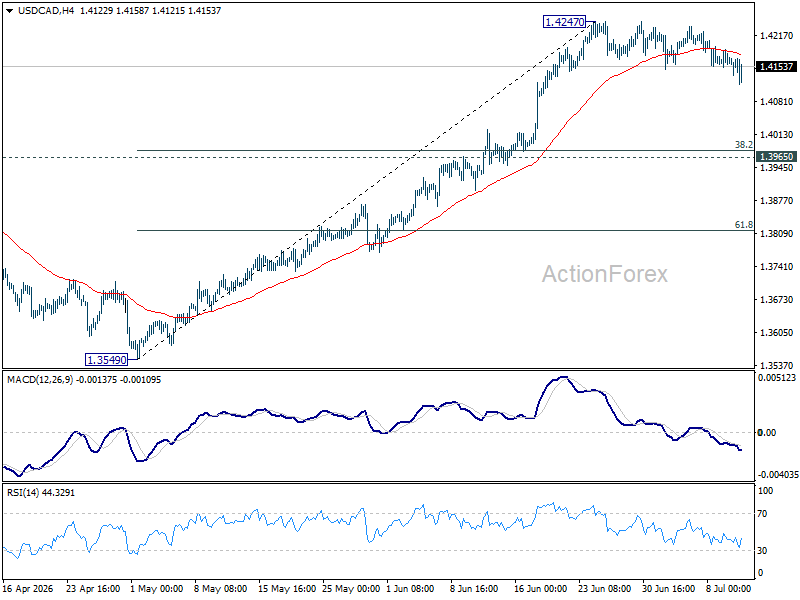
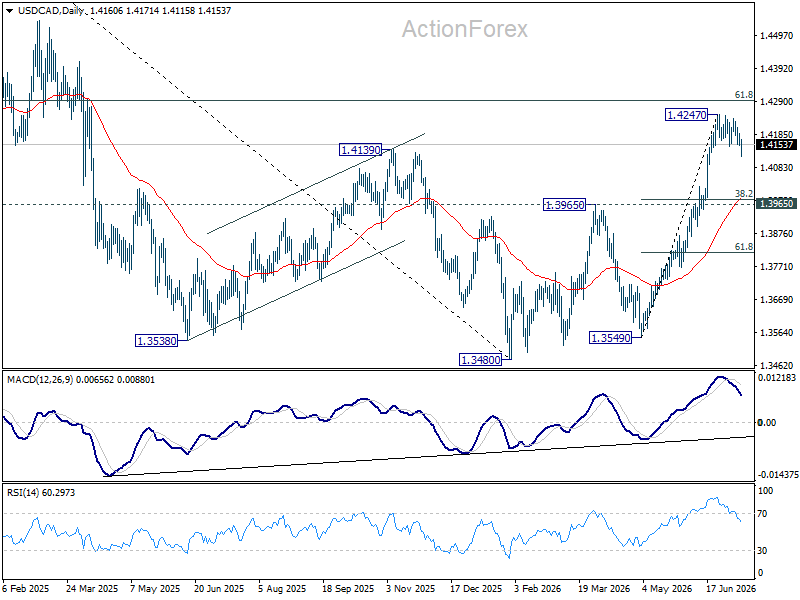
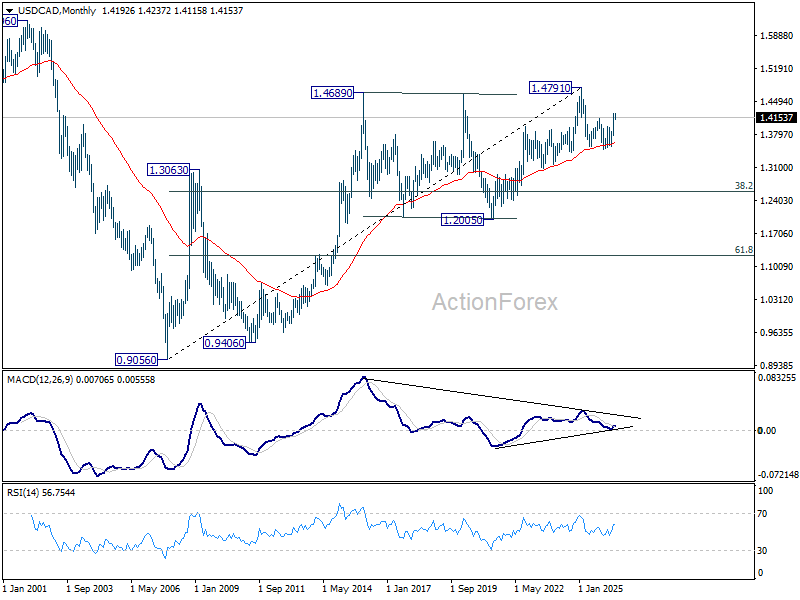
USD/CAD's consolidations from 1.4247 continued last week and outlook is unchanged. Initial bias remains neutral this week first. Deeper pullback cannot be ruled out. But downside should be contained above 1.3965 resistance turned support. Above 1.4247 will resume the rally from 1.3480 to 61.8% retracement of 1.4791 to 1.3480 at 1.4290. Firm break there will pave the way back to 1.4791 high.
In the bigger picture, current development suggests that fall from 1.4791 has completed as a three wave correction to 1.3480. It's still early to judge if rise from there a corrective bounce, or resumption of the larger up trend from 1.2005 (2021 low). But in either case, retest of 1.4791 high should be seen next.
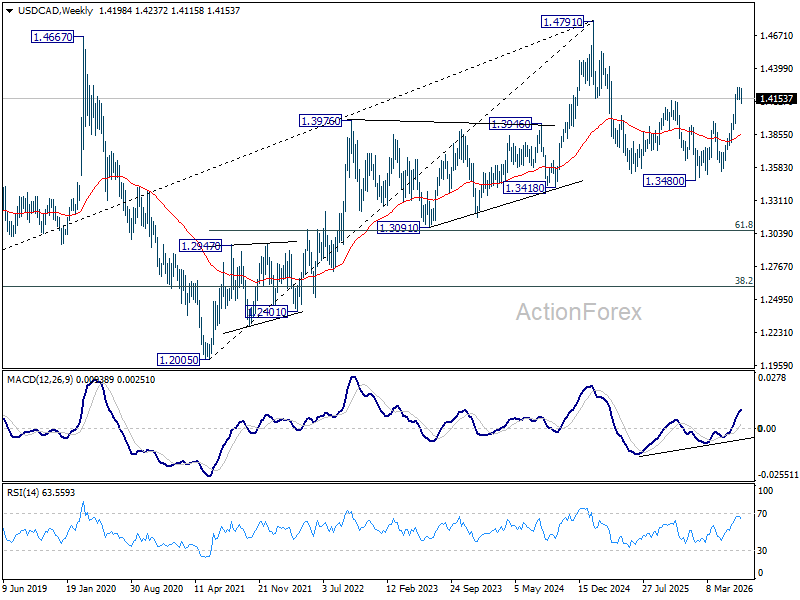
In the long term picture, rising 55 M EMA (now at 1.3631) remains intact. Thus, up trend from 0.9056 (2007 low) could still be in progress. However, considering bearish divergence condition M MACD, sustained trading below 55 M EMA will argue that the up trend has completed with five waves up to 1.4791, and turn medium term outlook bearish for correction to 38.2% retracement of 0.9056 to 1.4791 at 1.2600.
GBP/JPY Weekly Outlook
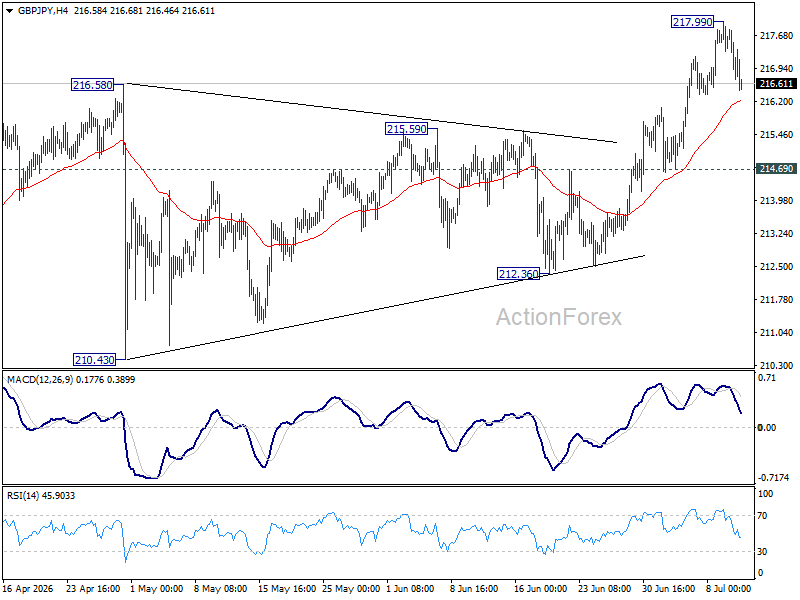
GBP/JPY's up trend resumed last week and surged to 217.99 before retreating. Initial bias remains neutral this week for consolidations. Further rally is expected as long as 214.69 support holds. Above 217.99 will target 220.90 fibonacci projection level next.
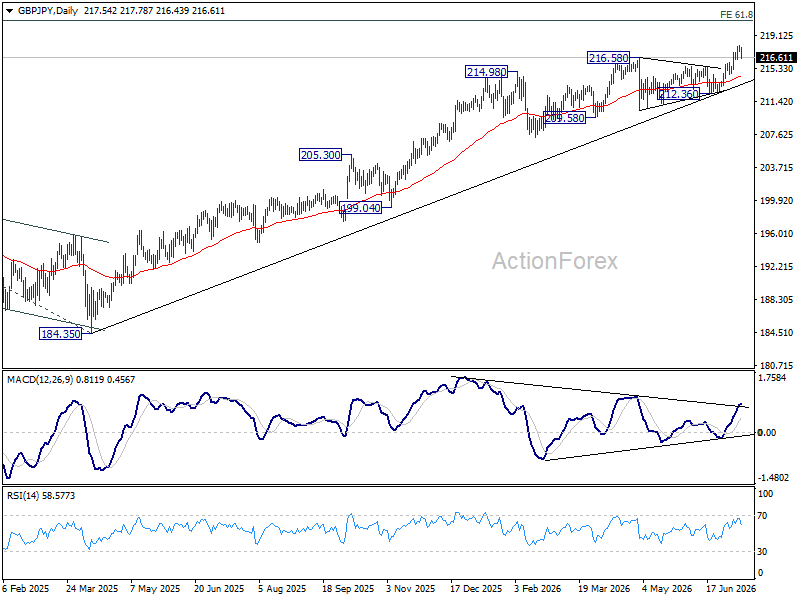
In the bigger picture, the long term up trend is in progress. Next target is 61.8% projection of 148.93 (2022 low) to 208.09 (2024 high) from 184.35 at 220.90. For now, outlook will remain bullish as long as 55 W EMA (now at 207.89) holds, in case of pullback.
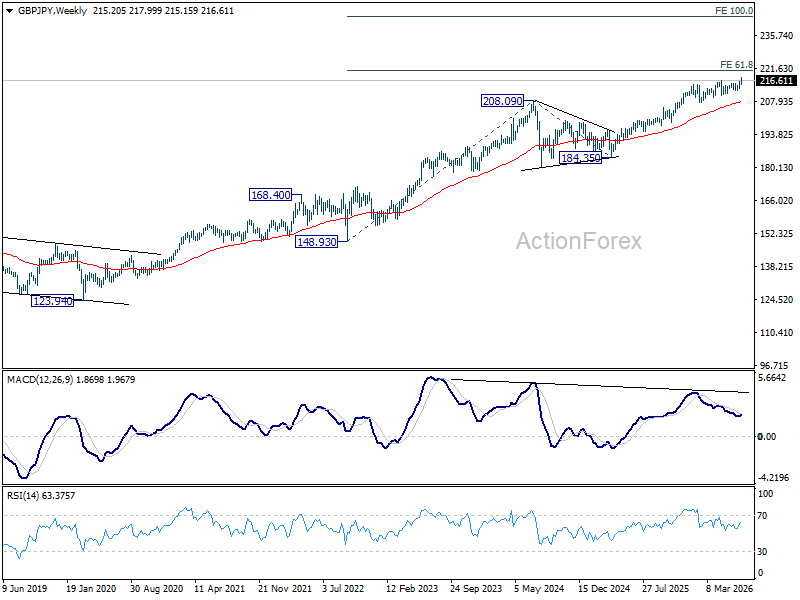
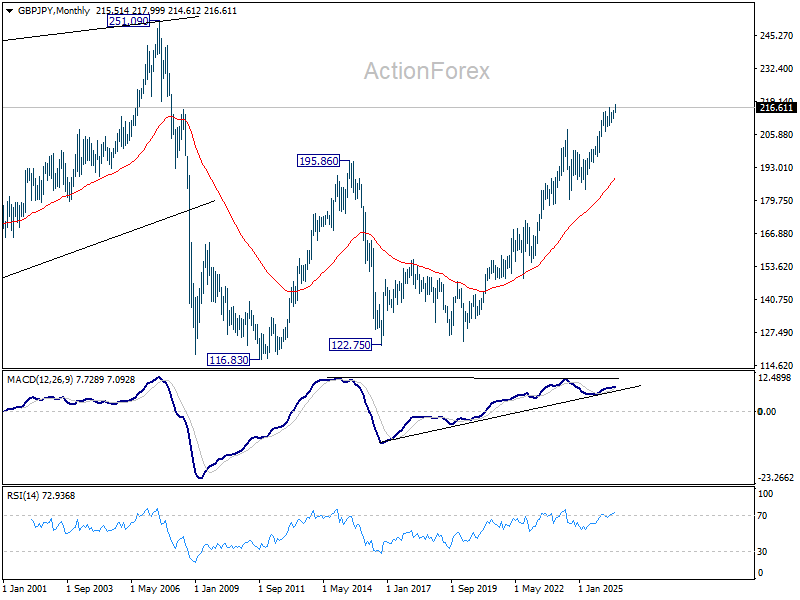
In the long term picture, up trend from 116.83 (2011 low) is in progress. Next target is 251.09 (2007 high). This will remain the favored case as long as 55 M EMA (now at 188.85) holds.
EUR/JPY Weekly Outlook
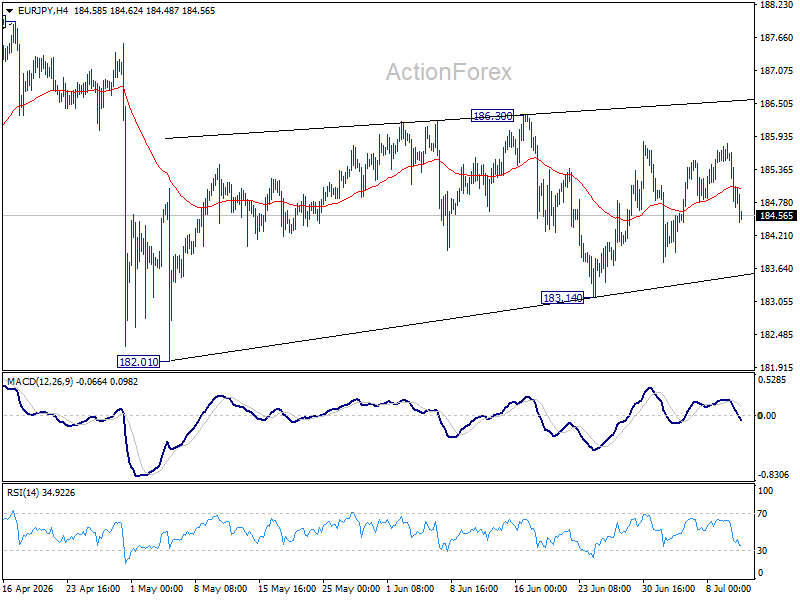
EUR/JPY stayed in range of 183.14/186.30 last week and outlook is unchanged. Initial bias remains neutral this week first. On the upside, firm break of 186.30 will resume the rebound from 182.10 towards 187.93 high. On the downside, break of 183.14 will bring deeper fall to retest 182.10.
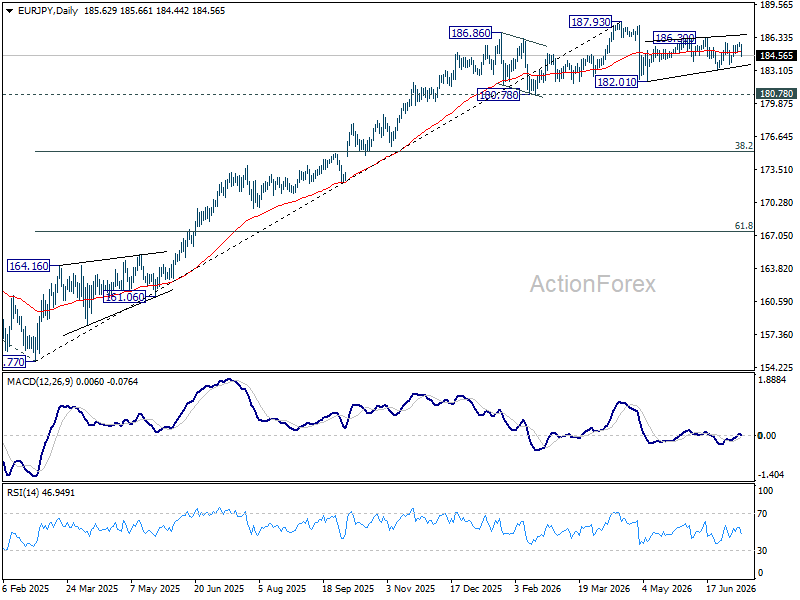
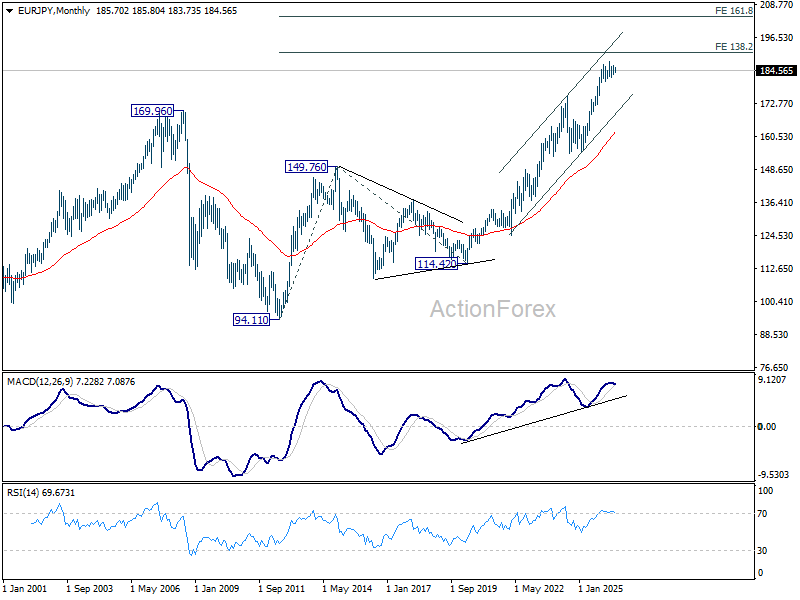
In the bigger picture, there is no sign of reversal yet. Uptrend from 114.42 (2020 low) is still expected to resume at a later stage to 78.6% projection of 124.37 (2022 low) to 175.41 (2025 high) from 154.77 at 194.88. However, sustained break of 55 W EMA (now at 179.76) will argue that it's already in a medium term down trend to 175.41 resistance turned support and below.
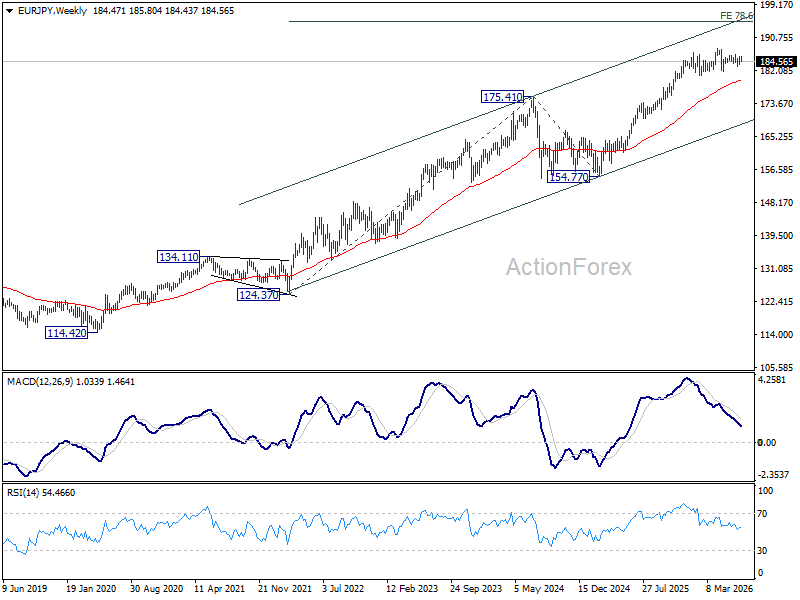
In the long term picture, up trend from 94.11 (2021 low) is in progress. Next target is 138.2% projection of 94.11 to 149.76 (2014 high) from 114.42 (2020 low) at 191.32. This will remain the favored case as long 55 W EMA holds.
EUR/GBP Weekly Outlook
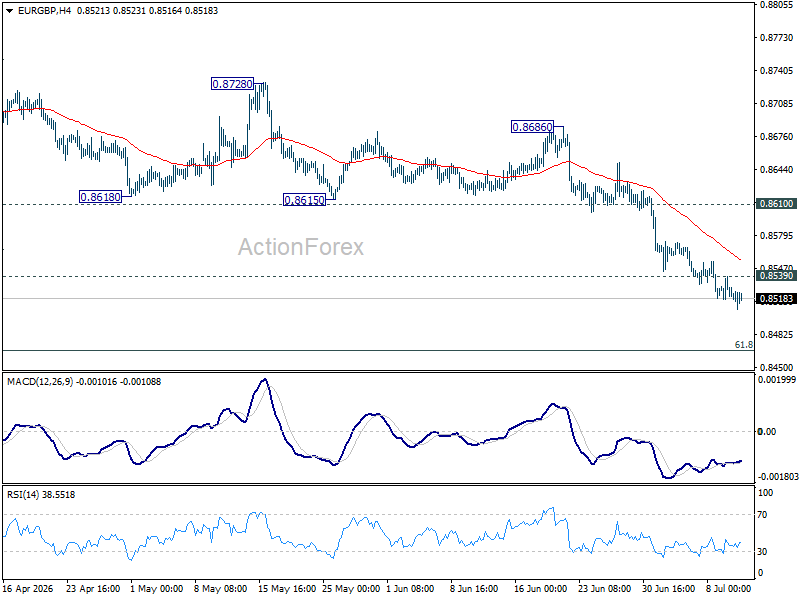
EUR/GBP's decline continued last week and outlook is unchanged. Initial bias remains on the downside this week for 61.8% retracement of 0.8221 to 0.8863 at 0.8466. As the cross is losing downside momentum as seen in 4H MACD, some support could be seen there to bring rebound. On the upside, above 0.8539 resistance will turn intraday bias neutral again. But recovery should be limited by 0.8610 support turned resistance to bring another fall.
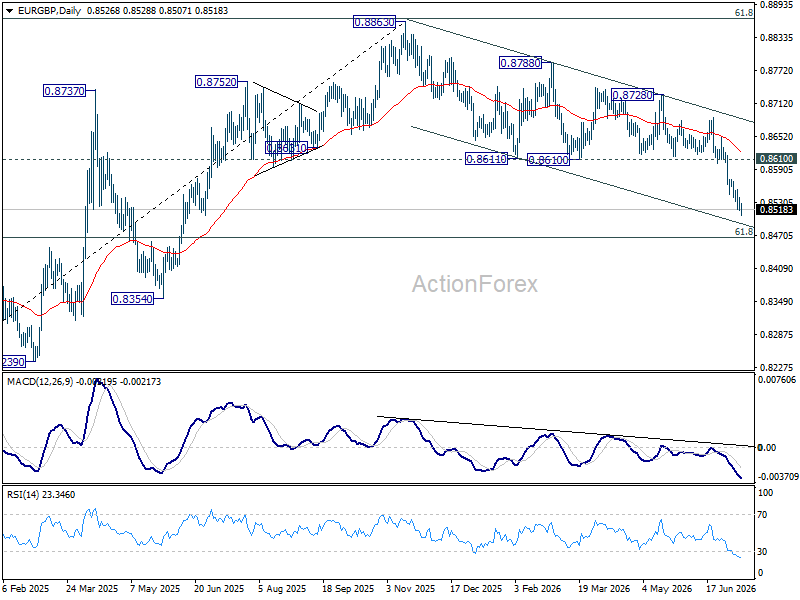
In the bigger picture, current development suggests that rise from 0.8221 (2024 low) has completed at 0.8863, just ahead of 38.2% retracement of 0.8221 (2024 low) to 0.8863 (2025 high) at 0.8618. Deeper fall would be seen back to 0.8201 (2022 low). For now, outlook will be neutral at best as long as 0.8863 hold.
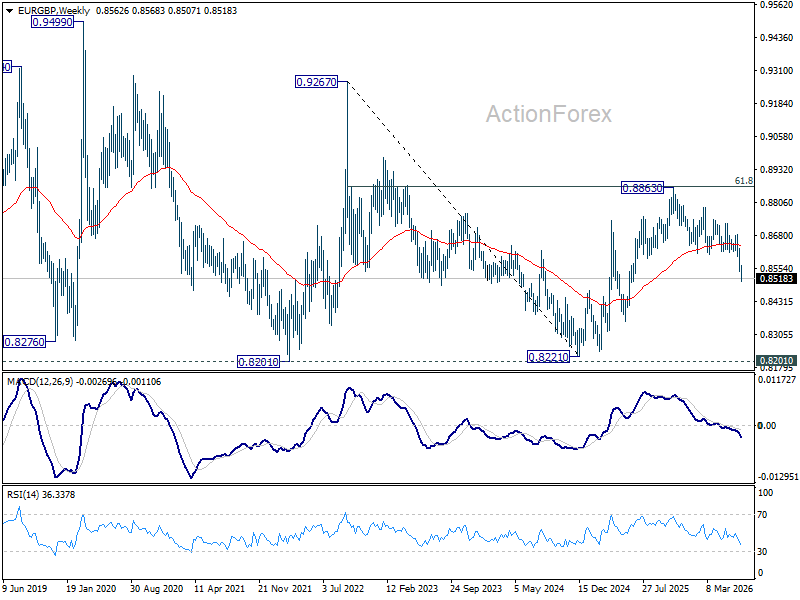
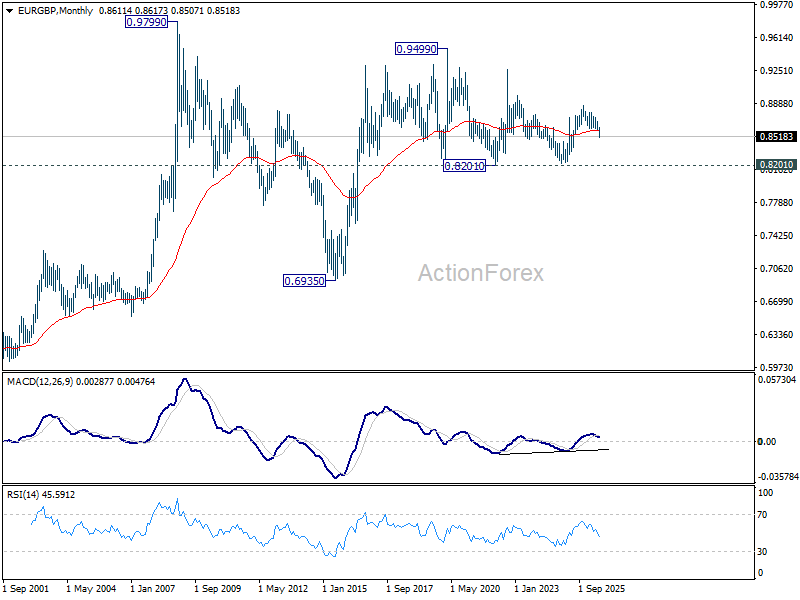
In the long term picture, price action from 0.9499 (2020 high) is seen as part of the long term range pattern from 0.9799 (2008 high). Range trading should continue between 0.8201 and 0.9499, until there is clear signal of imminent breakout.
EUR/AUD Weekly Outlook
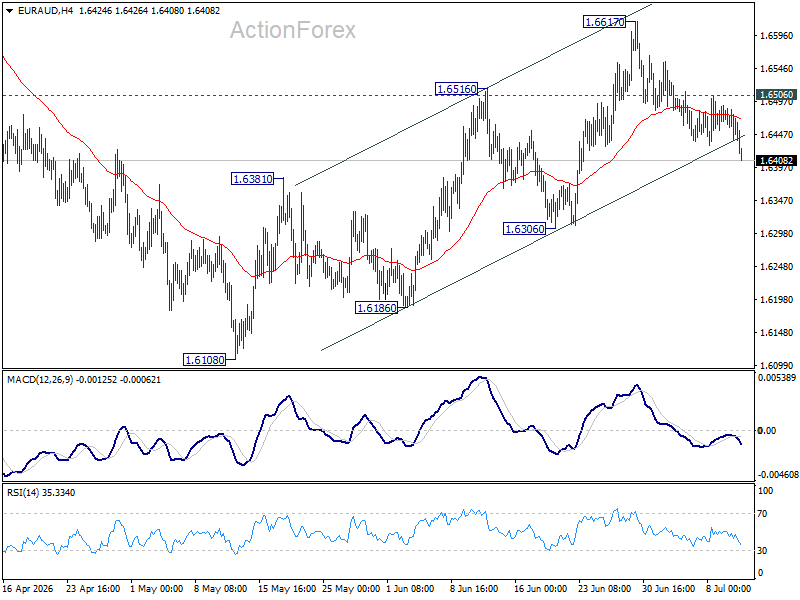
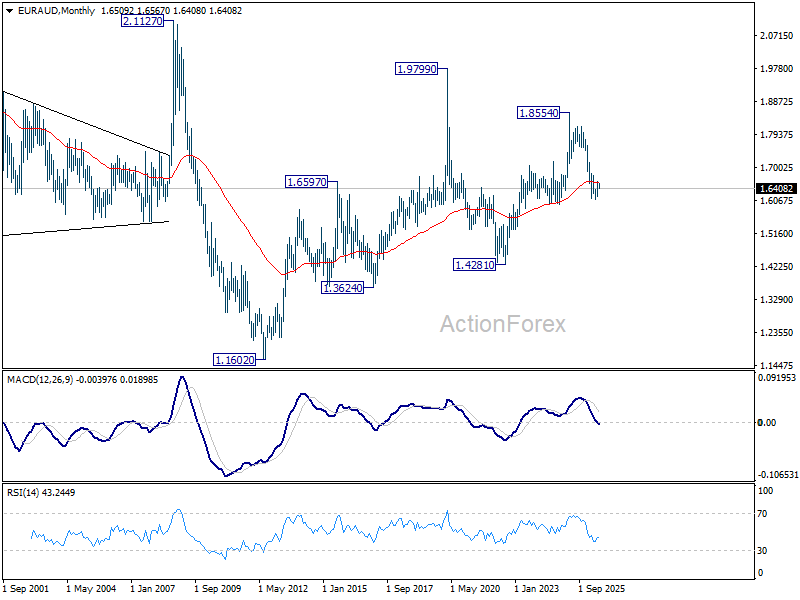
EUR/AUD's pullback from 1.6617 extended lower last week but stayed well above 1.6306 support. Initial bias remains neutral this week first. On the upside, above 1.6506 minor resistance will bring retest of 1.6617. Firm break there will resume the rebound from 1.6108. However, decisive break 1.6306 support will argue that the rebound has completed, and bring retest of 1.6108.
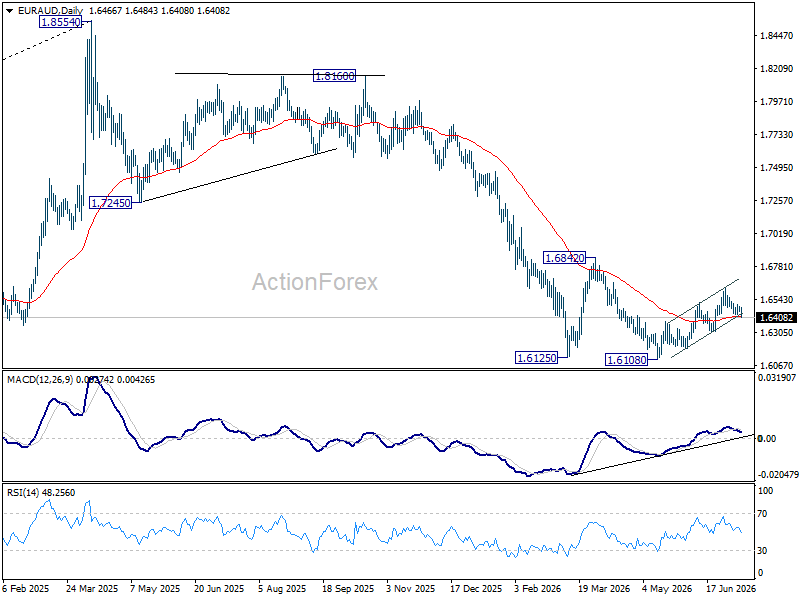
In the bigger picture, outlook will stay bearish as long as 1.6842 resistance holds. Fall from 1.8554 (2025 high) is expected to continue to 61.8% retracement of 1.4281 to 1.8554 at 1.5913. Decisive break there will pave the way back to 1.4281 (2022 low). However, firm break of 1.6842 should confirm medium term bottoming, and bring stronger rally.
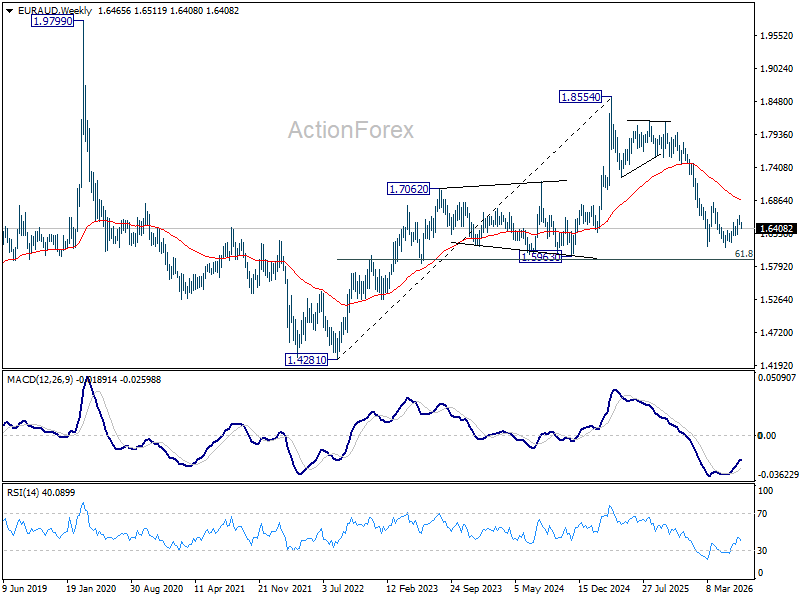
In the longer term picture, fall from 1.8554 is seen as the third leg of the pattern from 1.9799 (2020 high), which is part of the pattern from 2.1127 (2008 high). Sustained trading below 55 M EMA (now at 1.6577) will confirm this bearish case, and pave the way back towards 1.4281.
EUR/CHF Weekly Outlook
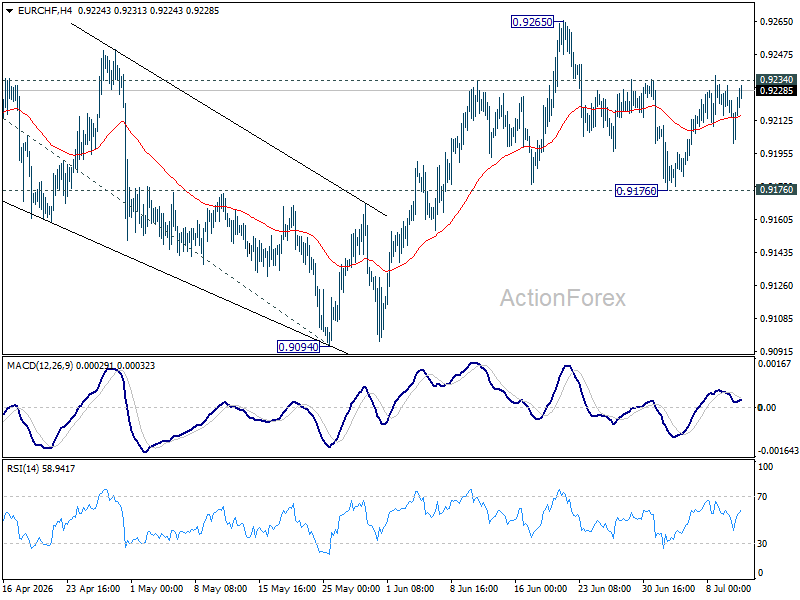
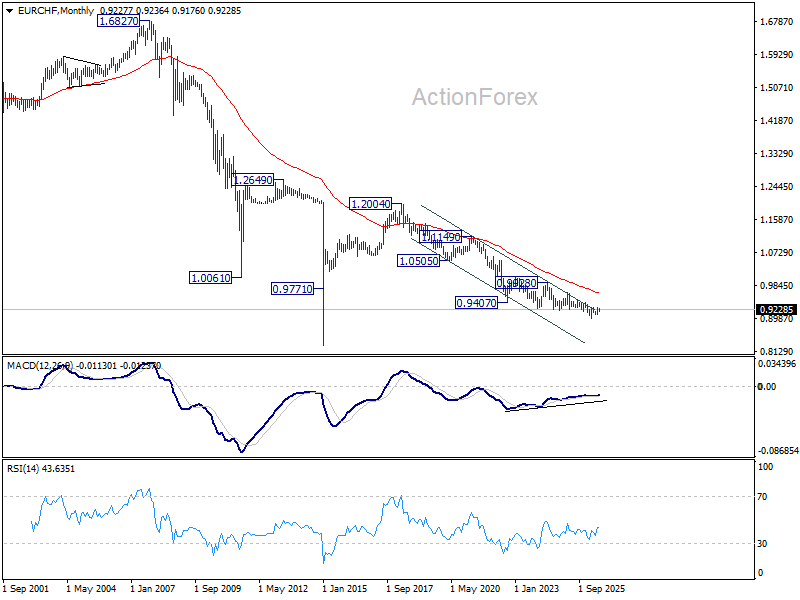
EUR/CHF's recovery was capped by 0.9234 resistance last week. Initial bias remains neutral this week first. Still, with 0.9176 support intact, further rally is expected. On the upside, break of 0.9234 will bring retest of 0.9265 resistance first. Firm break there will resume the rally from 0.8979 to 100% projection of 0.8979 to 0.9264 from 0.9094 at 0.9379. However, decisive break of 0.9179 will dampen this bullish view, and bring deeper fall back to 0.9094 support.
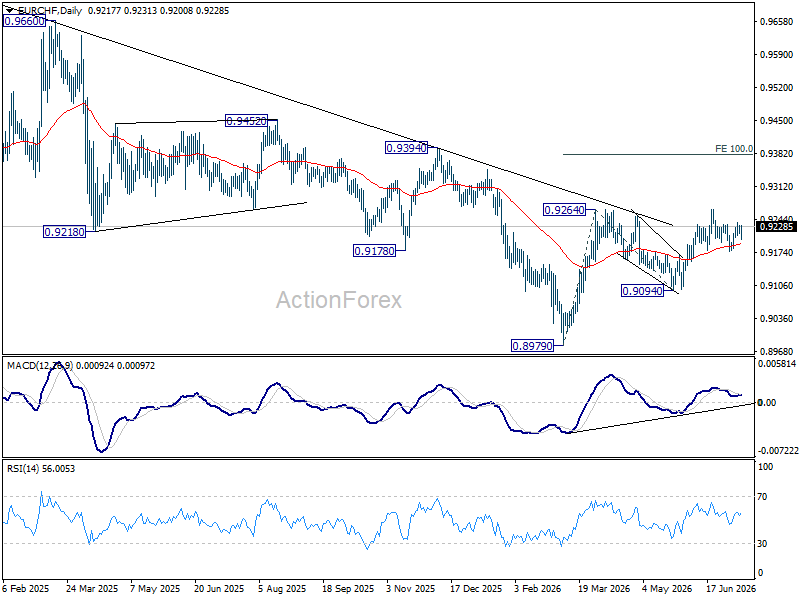
In the bigger picture, the break of medium term falling trend line resistance indicates that 0.8979 is already a medium term bottom. Considering bullish convergence condition in W MACD, rise from there should at least be reversing the fall from 0.9928, with prospect of developing into a medium term up trend. Firm break of 0.9394 resistance will add more credence to this case. For now risk will remain on the upside as long as 0.9094 support holds, in case of retreat.
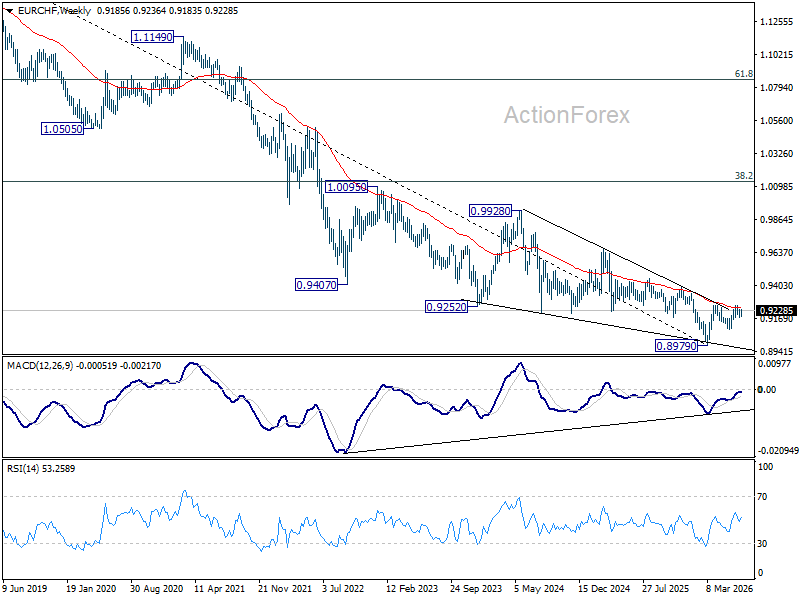
In the long term picture, outlook will stay bearish as long as 0.9407 support turned resistance (2022 low) holds. However, firm break of 0.9407 will argue that the down trend from 1.2004 (2018 high) has completed with five waves down to 0.8979. Stronger rebound should then be seen to 38.2% retracement of 1.2004 to 0.8979 at 1.0135 in the medium term.
The Weekly Bottom Line: GDP Fireworks Ahead of Canada Day
Our summary of recent economic events and what to expect in the weeks ahead.
Canadian Highlights
- The July 1st CUSMA extension deadline came and went, but this outcome was well telegraphed and the status quo, in terms of U.S. tariffs on Canada, remains.
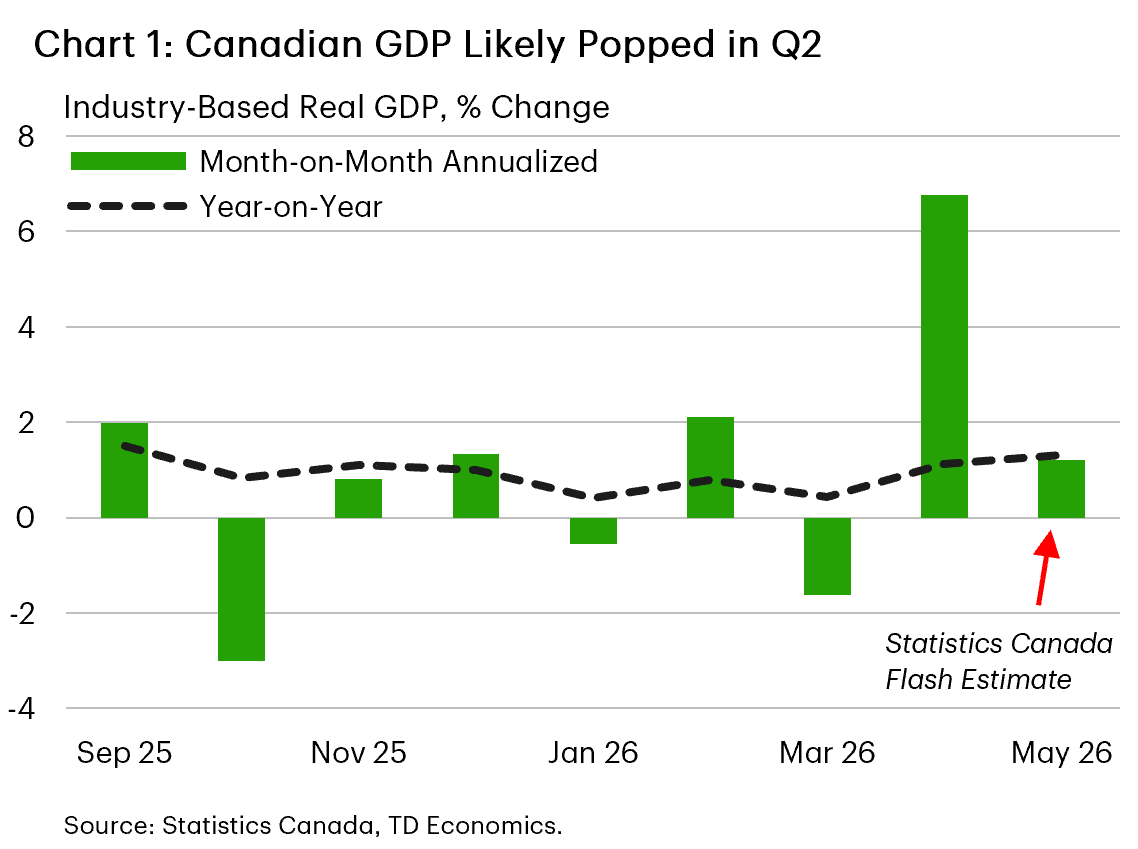
- Canada's economy popped in April and likely grew again in May. This puts Q2 growth on track to print above 2% annualized, easing recession concerns.
- Lower oil prices should help near-term inflation, while underlying slack and contained core inflation pressures strengthen the case for a Bank of Canada hold stance.
U.S. Highlights
- U.S. equities had a stellar first half performance this year, with the S&P 500 and NASDAQ rising 9.5% and 13%, respectively.
- Nonfarm employment moderated in June, but underlying hiring trends remain reasonably solid. The unemployment rate dipped to a twelve-month low of 4.2%.
- The ISM Manufacturing Index remained in expansionary territory for the sixth month in June, while vehicle sales hit a nine-month high of 16.5 million.
Canada – GDP Fireworks Ahead of Canada Day
In this holiday shortened week, there were still some notable moves in financial markets. Oil slid lower and, more broadly, has plunged since early June on hopes of a U.S.-Iran peace deal and improved traffic through the Strait of Hormuz. Canadian bond yields climbed during the week but eased back a bit today, driven by dynamics in the U.S. For its part, the Canadian dollar was unchanged at about 70 cents U.S. but has been tumbling since early May, pressured by hawkish U.S. central bank messaging.
The recent slide in oil prices is certainly a welcome development from an inflation perspective and will be reflected in June's CPI print. However, there could still be some upside to oil prices after this initial downswing. Global inventory buffers were steadily drawn down during the conflict and the summer driving season is set to ramp up.
Nonetheless, our forecast assumes that oil prices are past their peak. The Bank of Canada will breathe a sigh of relief if that turns out to be true, although policymakers were treated to some fireworks ahead of the Canada Day holiday, courtesy of a well-timed surge in monthly GDP. Indeed, Canadian GDP shook off some winter blues, popping by 0.5% month-on-month in April. This should help quell recession chatter, with April's gain marking the largest such increase since July 2025 (Chart 1).
On the less-positive side, the July 1st deadline to extend the CUSMA agreement for another 16 years came and went this week. However, this outcome was telegraphed well ahead of time by Canada, U.S. and Mexico. For now, the status quo remains, with most of Canada's exports to the U.S. tariff-free, but with punishing levies on sectors such as steel, aluminum and autos still in place. The process now moves to annual reviews (which will keep the cloud of uncertainty hanging), although parties can strike a deal at any time. We have tentative evidence that the worst of the trade conflict may be in the rearview. For instance, manufacturing GDP has risen in two of the last three months through April, and may have increased again in May given a pick up in hiring.
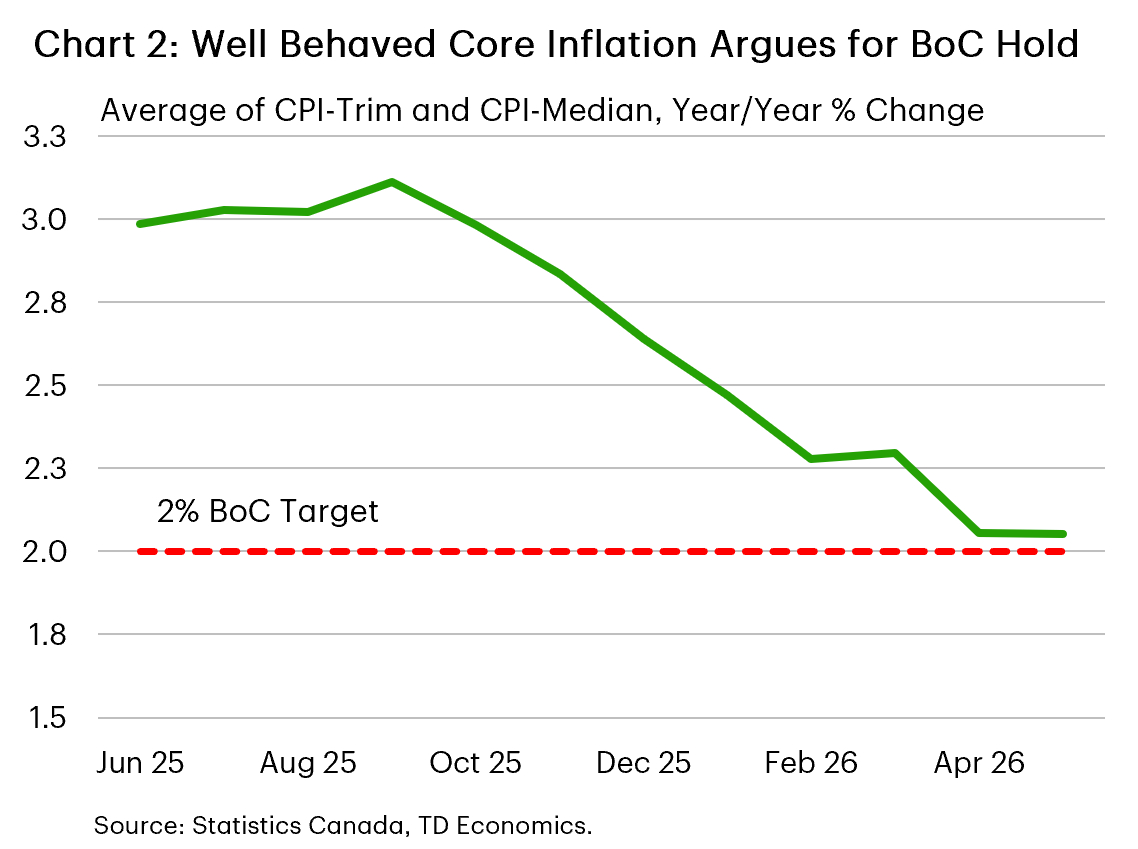
Incorporating StatCan's GDP guidance for May, Canada's economy is now on track to grow at a pace above 2% annualized in the second quarter. This is stronger than what the Bank of Canada expected in its April projection. Even still, it doesn't materially change our view on rates. Remember that the bounce back in GDP comes of heels of several quarters of soft activity, meaning that the economy is still likely in excess supply. Core inflation remains well behaved (Chart 2), with economic slack likely to apply downward pressure. Next week brings a slew of important data, including the Bank of Canada's Business Outlook Survey (BOS) and the June read on the job market. The prior BOS offered evidence that businesses are adjusting to the trade war, while Canadian hiring surged in May (raising the risk of some giveback in next week's report). We'll be monitoring these closely, but it would take some surprises to shake us from the view the Bank will remain on hold this year.
U.S. – Celebrating America's Exceptionalism
This weekend will mark America's 250th anniversary, but for financial markets, this holiday shortened week also brought a brief halftime for calendar 2026. It's been an eventful first six months of the year, marked by a flurry of trade deals, further shifts in tariff policies, a new chapter for the Federal Reserve and plenty of geopolitical tensions. Through it all, financial markets have remained remarkably calm. The S&P 500 rose 9.5% through the first half of the year while the NASDAQ was up nearly 13% - or more than double last year's mid-year performance. It remains to be seen whether the run is something to cheer or fear, but one thing is for certain, the AI built out and the expected productivity enhancements that it could eventually deliver have been pivotal catalysts underpinning the bull rally.
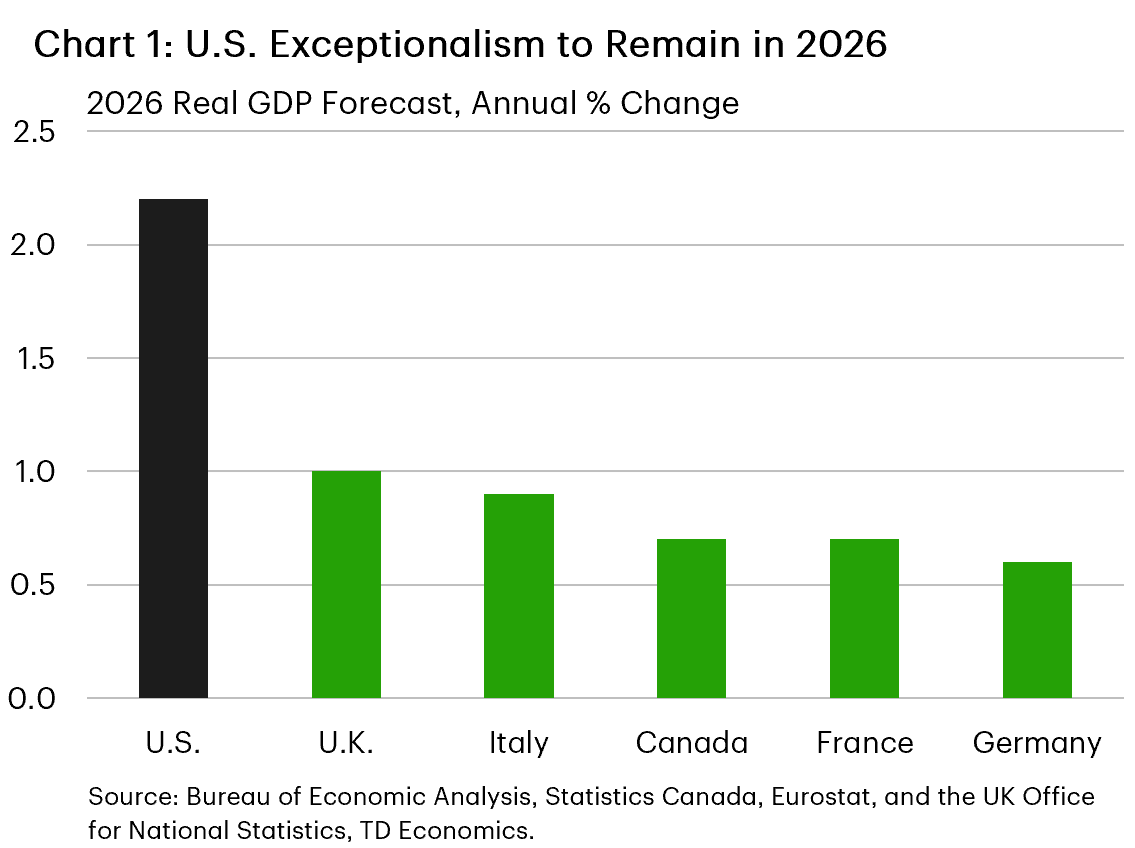
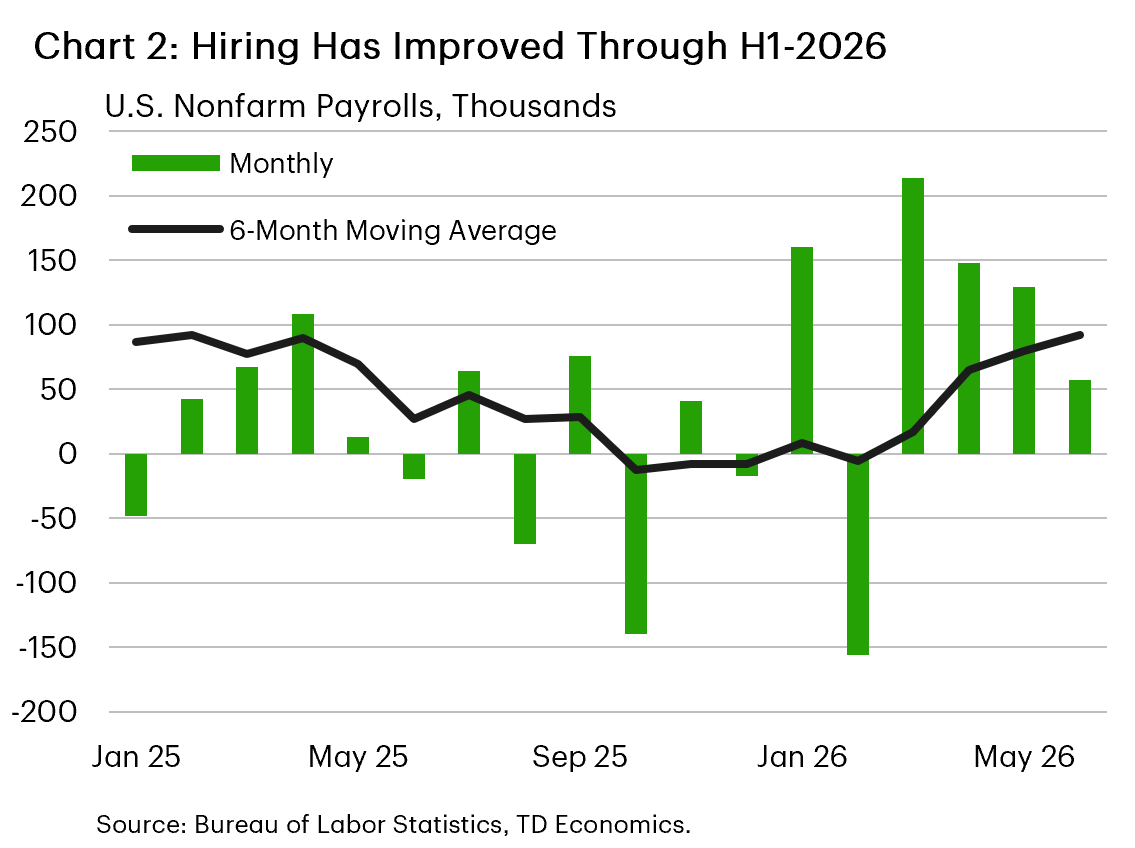
Beyond the AI push, a return to the American exceptionalism trade has also offered a tailwind for equities. U.S. growth is tracking north of 2% for 2026, or a multiple of any of the other G7 nations (Chart 1). And perhaps more encouragingly, is that the balance of risks for the U.S. outlook feel tilted to the upside. The U.S.-Iran peace deal has quickly returned energy prices to pre-conflict levels, dragging gas prices lower. This is good news for the consumer. At the same time, the labor market has clearly turned a corner after grinding through a soft patch last year. Nonfarm payrolls rose by 57k in June, a moderation from prior months, but a decent print nonetheless. Smoothing though the volatility, hiring has averaged 111k and 92k over the last three and six months, respectively (Chart 2). This is well above the breakeven rate, which helped to push the unemployment rate to a twelve-month low of 4.2%. But it wasn't all good news, a sharp drop in the labor force was entirely driven by a decline of over 800k prime working age individuals (i.e., 25 to 54 years old). It's too early to know what drove the decline or whether it's simply related to volatility. But the magnitude is noteworthy and something worth monitoring in the months ahead.
Other data out this week also reinforced America's economic resilience. June vehicle sales rose to a nine-month high of 16.5M, while the ISM Manufacturing Index remained in expansionary territory for the sixth consecutive month. Importantly, both production and new orders continue to expand at decent clips. And while input prices remain elevated, the sub-index fell to a four-month low, suggesting the worst of the cost pressures stemming from the energy shock are now in the rearview mirror.
This is good news for Fed officials, who are hunting for any signs of slowing price pressures amid continued concerns of elevated inflation. In his first public appearance since the June press conference, Chair Warsh underscored the Fed's commitment to return price stability, but stopped short of giving any forward guidance. While this leaves the impression that every meeting is "live" we would argue that the data released since the last FOMC meeting alongside the sharp pullback in energy prices reduces the odds of the Fed hiking rates this summer.
Economics Week Ahead
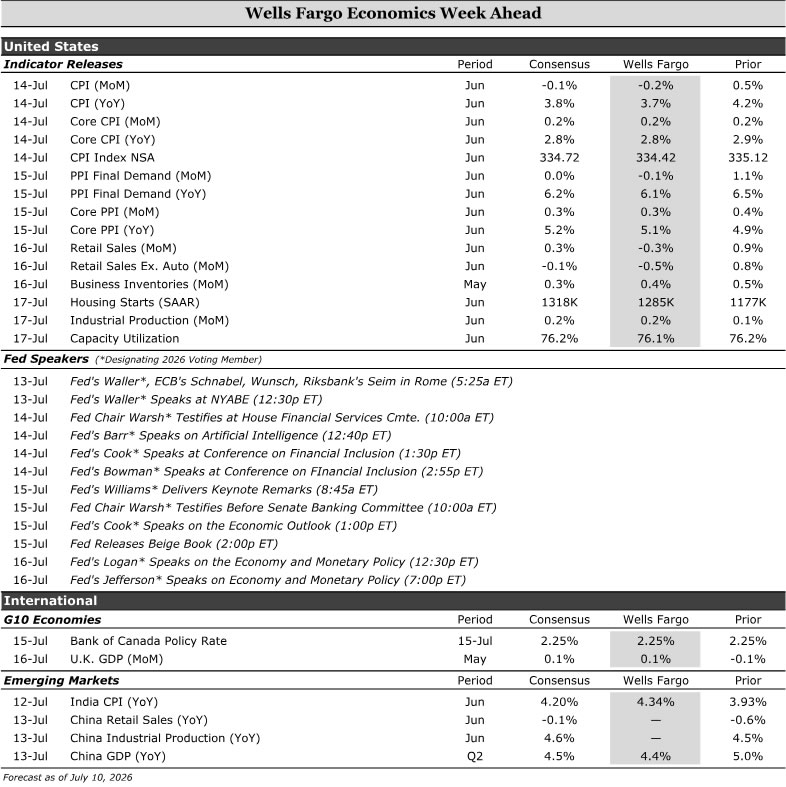
Next week's headline CPI reading is expected to cool, largely reflecting a decline in energy prices. Retail sales are also expected to soften, driven in part by lower gasoline prices. While consumer spending has remained resilient, weakening fundamentals could become a headwind in the months ahead. We expect housing starts to rebound, but it will not be sign of renewed momentum in the housing market.
In Canada, we expect the BoC to leave rates unchanged. In the U.K., economic growth is expected to rise slightly with services being the largest contributor to growth. Among emerging markets, India's CPI print is expected to move higher, complicating the Reserve Bank of India's policy outlook. In China, we expect Q2 GDP growth to slow.
- United States: CPI (Tuesday), Retail Sales (Thursday), Housing Starts (Friday)
- G10 Economies: Bank of Canada Monetary Policy Meeting (Wednesday), U.K. Monthly GDP (Thursday)
- Emerging Markets: India CPI (Monday), China GDP (Wednesday)
U.S. Week Ahead
CPI • Tuesday
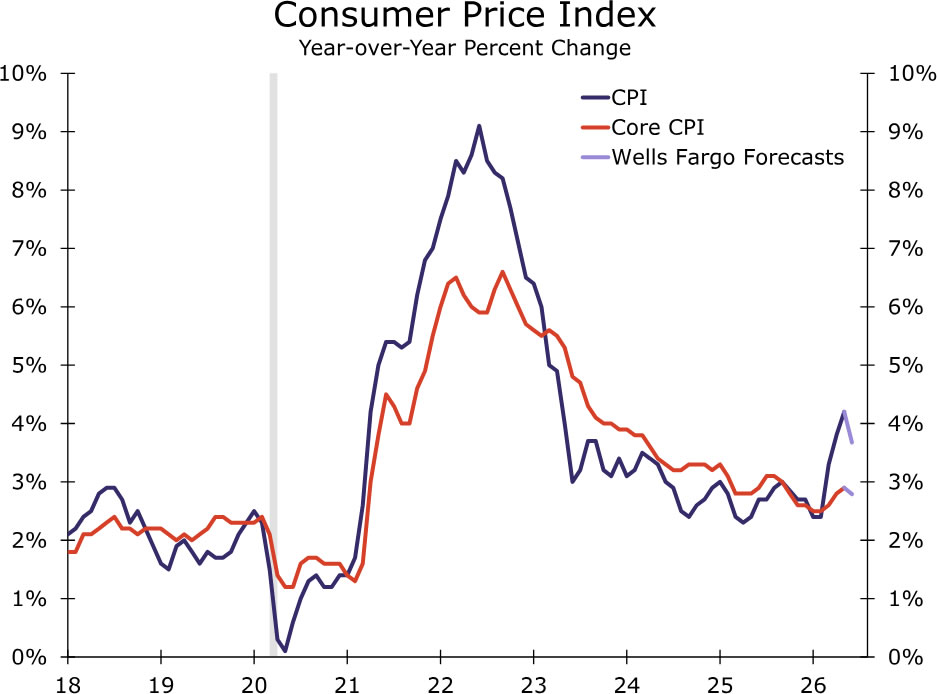
Inflation pressures eased for households in June thanks primarily to retreating gasoline prices. We estimate the CPI declined 0.2% over the month amid a ~10% drop in the price of energy goods. Food prices, however, are likely to have moved higher after a subdued May reading. Earlier increases in energy and transportation costs are still working their way through supply chains, while recently announced grocery price cuts won't leave a mark on the data until July.
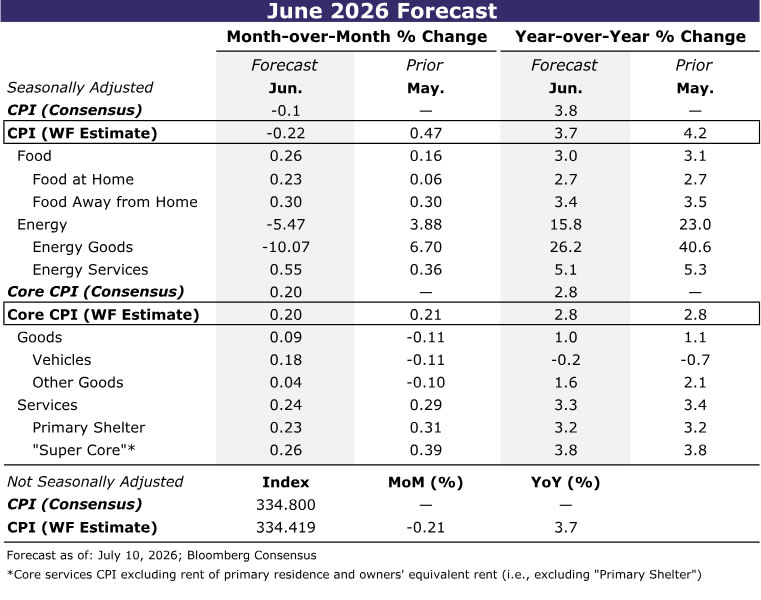
Excluding food and energy, we estimate the core CPI rose 0.2%. Core goods inflation is expected to firm, driven partially by vehicles. Outside of autos, the recent rate of disinflation in prescription drugs and tariff-sensitive categories may prove difficult to sustain as the trade policy shock fades further in the rear-view mirror.
Core services inflation, meanwhile, should moderate in June. Primary shelter inflation is due for some payback after May's above-trend gain. Travel-related services also should provide some relief, with lower jet fuel costs contributing to softer growth in airfares. Medical services inflation likewise appears positioned to cool following unusually strong gains in hospital and physician services in May.
Taken together, June's CPI report should point to some slowing in underlying inflation. While supply-side developments continue to generate volatility in a handful of categories, the broader data do not suggest inflation pressures are re-accelerating across the economy.
Retail Sales • Thursday
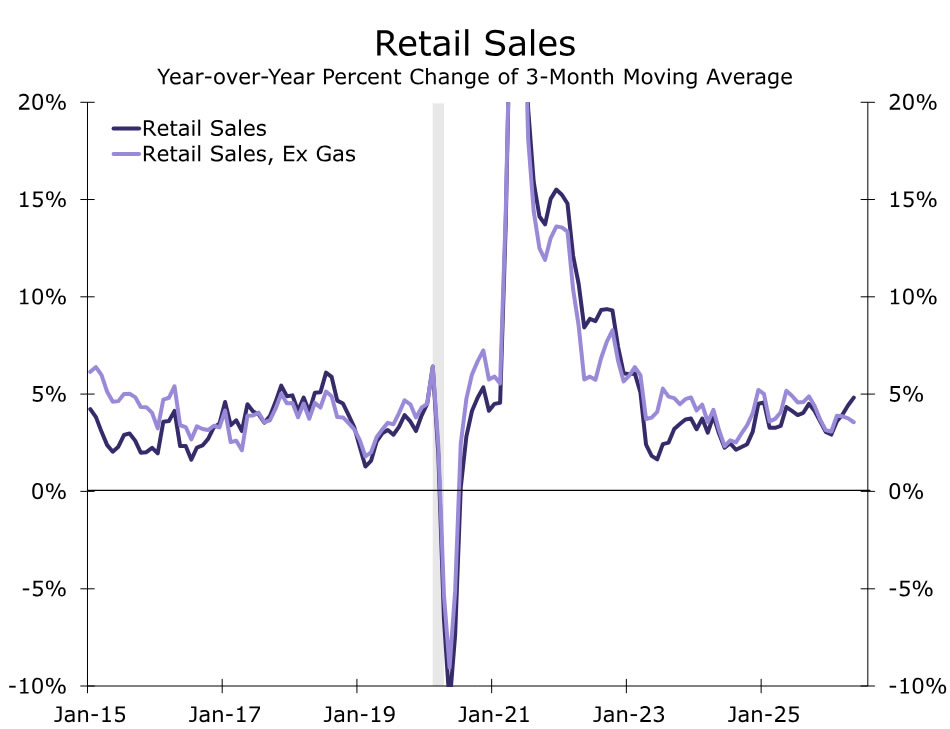
Lower gasoline prices should weigh on headline retail sales in June. We forecast overall sales to decline 0.3%, reflecting the roughly $0.50 drop in average pump prices during the month. While Tuesday's CPI data will provide a more complete picture of households' price exposure, energy prices should account for most of the weakness in nominal sales.
Outside of gasoline, high-frequency credit card data point to some moderation in spending, but we still expect underlying retail sales to rise modestly.
More broadly, underlying consumer spending has remained resilient this year. Larger individual tax refunds have helped offset the drag from higher energy costs, supporting household purchasing power. That said, consumer fundamentals appear less secure. Real disposable income growth has softened amid compounding inflation and a cooler jobs market forcing households to spend more of their income or rely on credit and/or wealth to sustain spending.
Housing Starts • Friday
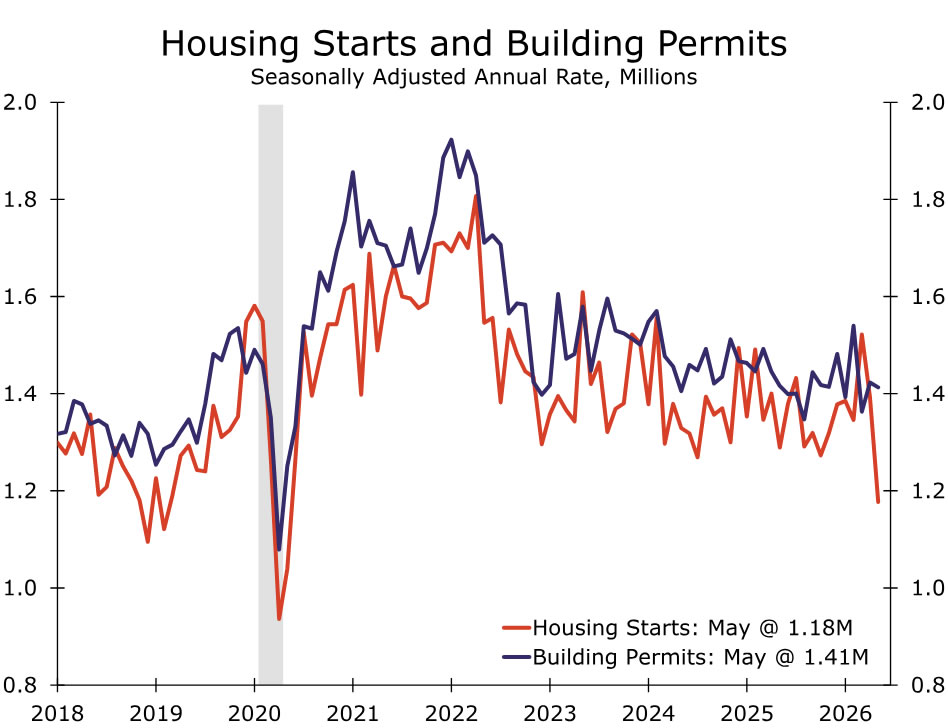
We anticipate residential construction rose to 1285K in June, partially rebounding from the previous month's pronounced decline. That's not to say we believe housing starts are now on an upswing, only that May's unusually sharp pullback likely overstated the downshift in activity that has been evident for much of the year. In our view, the recent decline in permits, which are down 2.6% year-to-date through May, is more reflective of the underlying trend.
The most recent NAHB Housing Market Index points in a similar direction. Builder sentiment edged lower in June, which suggests home builders are becoming increasingly cautious amid still-elevated inventory levels and lackluster pace of new home sales due to the challenging affordability backdrop. Meanwhile, high capital costs and soft apartment market conditions remain as a significant limitation on new multifamily development. All told, we expect housing starts bounced back in June. On balance, however, activity is still likely losing momentum.
G10 Week Ahead
Bank of Canada Monetary Policy Meeting • Wednesday
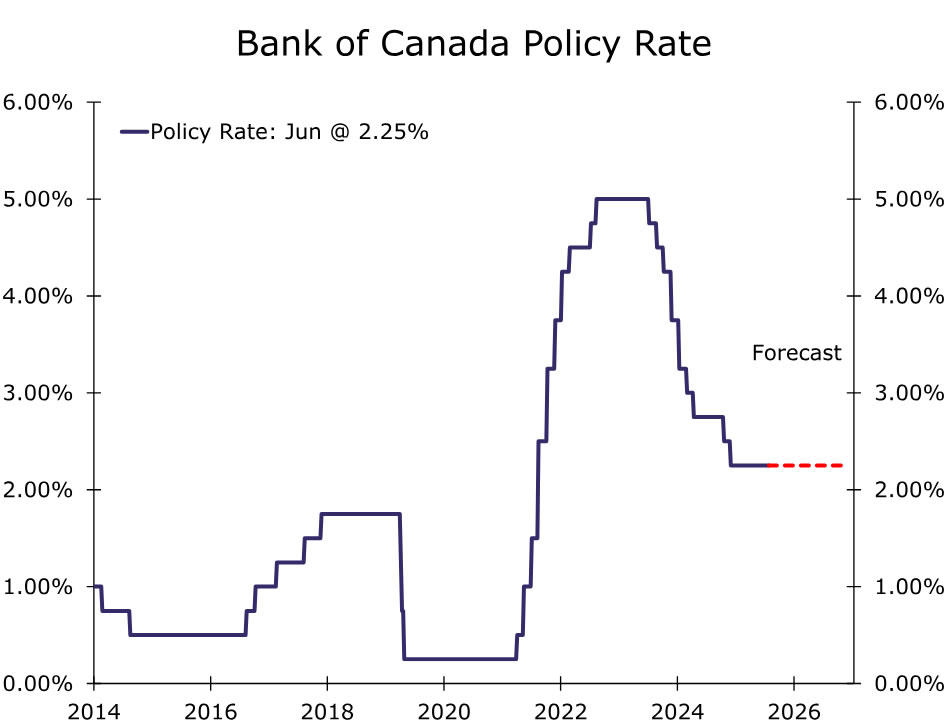
We expect the Bank of Canada (BoC) to remain on hold next week, leaving the policy rate unchanged at 2.25%. Since the June meeting, the backdrop has been somewhat mixed. Following a softer-than-expected Q1 GDP print, monthly GDP rebounded in April, though purchasing manager surveys point to some moderation in activity through June. The latest employment report showed a modest headline gain and a decline in the unemployment rate to 6.5%, but underlying labor market conditions remain uneven.
At the same time, underlying inflation pressures remain relatively contained. Headline inflation has moved higher alongside rising oil prices, but measures of core inflation have shown little sign of broadening price pressures that would require a near-term policy response. While developments in the Middle East and the resulting path for energy prices remain an important upside risk to inflation, the BoC is likely to look through commodity-driven price increases unless they begin to feed more meaningfully into underlying inflation trends.
Recent survey data reinforce that view. The BoC's latest Business Outlook Survey showed inflation expectations remain generally well anchored. While average inflation expectations over the next two years moved higher, one-year-ahead expectations continue to trend lower and five-year expectations were largely unchanged. Taken together, the data should give policymakers confidence that inflation expectations remain contained even as headline inflation faces near-term energy-related pressures.
U.K. GDP • Thursday
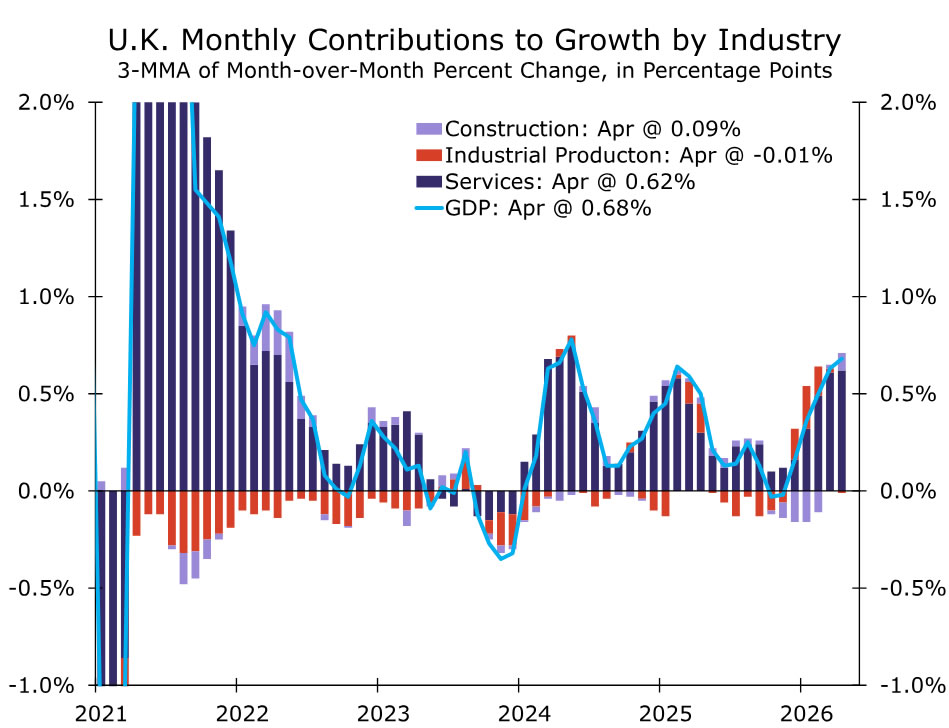
Next week's U.K. GDP release will provide another indication of whether growth is holding up despite a softer survey backdrop. We expect GDP to rise 0.1% month-over-month in May, with services activity remaining the primary driver of growth and manufacturing providing some support following stronger orders and front-loading activity in recent months.
Recent activity data have been mixed. GDP rose 0.7% in the three months through April, but monthly GDP contracted 0.1% month-over-month in April as services output declined. Forward-looking indicators suggest growth momentum remained modest in May. The services PMI fell into contraction territory for the first time since April 2025, while construction activity remained weak. Although manufacturing may provide some near-term support, recent strength could obscure underlying softness in the broader economy if services continue to ease. Early June survey data offer little sign of a rebound, pointing to subdued growth through Q2.
An upside surprise in GDP would indicate that activity has remained more resilient than confidence indicators suggest. Uncertainty in the Middle East remains elevated, raising the risk that higher energy prices feed through to U.K. households through the Ofgem price cap mechanism. Combined with persistently sticky services inflation of 3.6% year-over-year, these potential second-round inflationary pressures remain a key concern for BoE policymakers. As such, we continue to expect the BoE to deliver two 25 bps hikes this year.
EM Week Ahead
India CPI • Monday
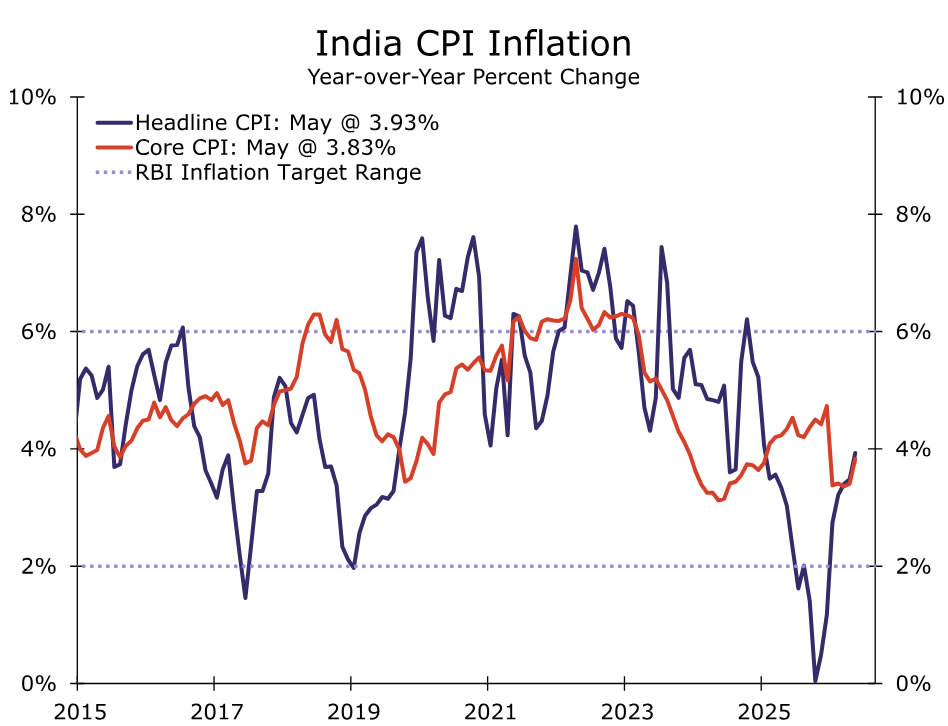
India's June CPI release is due next week, and we expect headline inflation to rise to 4.34% year-over-year (from 3.93% in May), driven mainly by food and energy prices. Core inflation (excluding food, fuel and light) also firmed to 3.83%, though inflation pressures have yet to become clearly broad-based.
The Reserve Bank of India (RBI) has so far maintained a "wait-and-watch" approach, but its latest projections point to rising inflation pressures alongside softer growth. At its latest meeting, the RBI kept the policy rate on hold at 5.25% and lowered its 2026 growth projection to 6.6%, while revising inflation higher, with CPI expected to average 5.1% in 2026 and peak at 5.9% in Q3. The RBI's updated forecasts underscore a more challenging inflation-growth trade-off. A war-driven increase in crude import costs could widen the current account deficit, while a weaker rupee compounds imported inflation. El Niño risks further amplify upward pressure on food prices.
Against this backdrop, we continue to see policy risks skewed toward tightening. We maintain our view for two rate hikes this year, one in Q3 and one in Q4, bringing the Repurchase Rate to a terminal rate of 5.75%.
China GDP • Wednesday
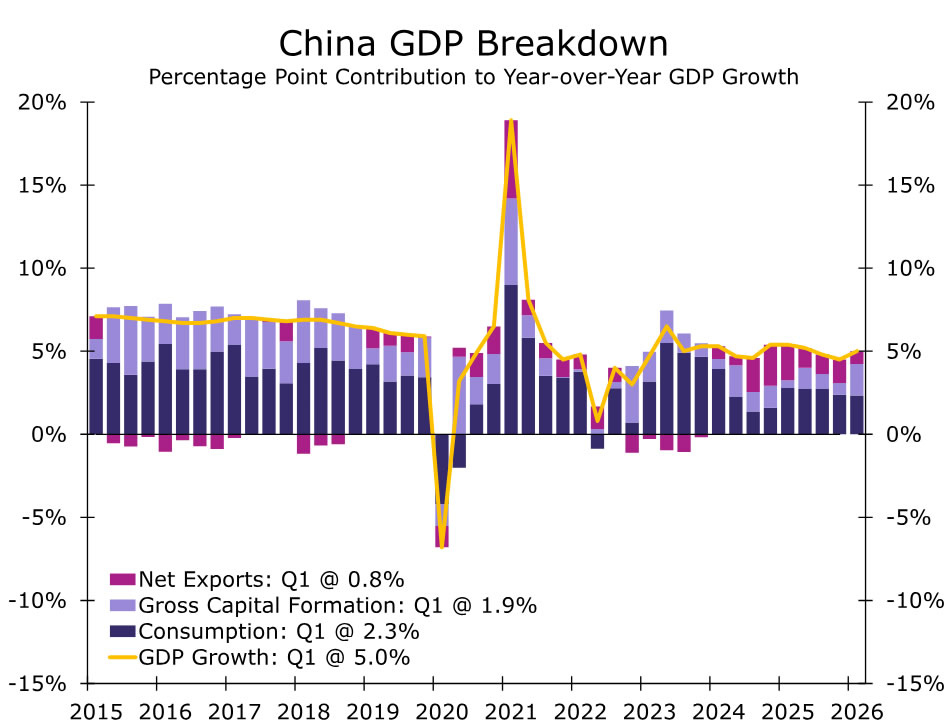
China's Q2 GDP release is due next week, alongside June data for industrial production and retail sales, and should provide a clearer picture of the extent of the economy's loss of momentum during the second quarter. We expect GDP growth to slow to 4.4% year-over-year, down from 5.0% in Q1.
The underlying details are likely to highlight continued divergence across sectors. Industrial activity appears to have held up relatively well, supported by external demand and technology-related production. Recent PMI data point to some resilience in manufacturing, suggesting that factory activity has remained broadly stable. That said, export-driven strength has likely only partly offset weak domestic demand and ongoing pressures in the property sector. On the consumer side, momentum remains soft. Retail sales likely continued to struggle in June, consistent with a still-subdued services backdrop. Robust exports, particularly those linked to global AI demand, have helped cushion the impact of trade disruptions and higher energy costs stemming from geopolitical tensions, but have not been sufficient to drive a broader domestic recovery.
Looking ahead, domestic demand is likely to remain constrained by weak consumer confidence and ongoing challenges in the property sector. While the upcoming data should reinforce the case for additional targeted stimulus, we do not expect policymakers to shift toward broad-based easing. Against this backdrop, we continue to forecast China's GDP growth slowing to 4.5% in 2026 and 4.3% in 2027.