Sample Category Title
Canada Employment Tops Forecast as Jobless Rate Falls Again
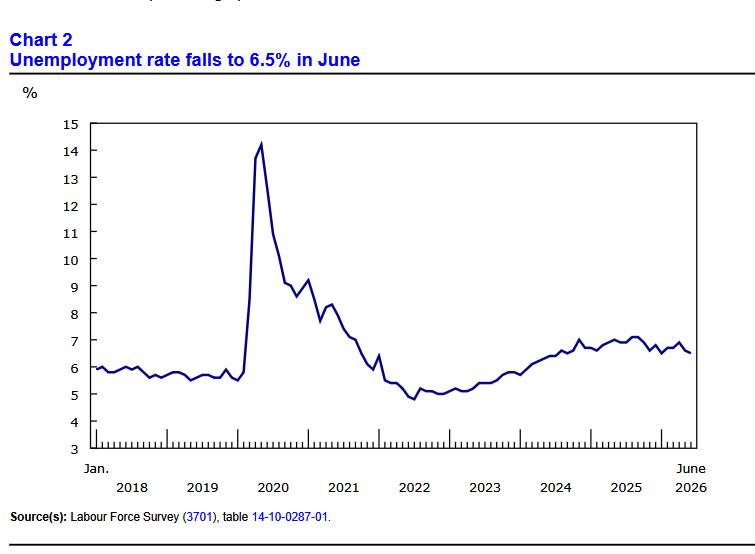
Canada's labor market continued to show resilience in June, with employment rising by 18.2k, comfortably above expectations for a 10.0k increase. While hiring slowed from May's exceptionally strong 87.8k gain, the latest figures point to continued labor market stability rather than the sharp normalization many investors had anticipated. The unemployment rate unexpectedly declined to 6.5% from 6.6%, marking a second consecutive monthly fall and reinforcing the view that labor demand remains firm despite mounting uncertainty surrounding Canada's trade outlook.
The details of the report were broadly encouraging. The employment rate edged up 0.1 percentage point to 60.8%, while the labor force participation rate held steady at 65.0%, indicating that the decline in unemployment was driven by stronger hiring rather than workers leaving the labor force. On a year-over-year basis, employment increased by 99k, or 0.5%, led by a 131k gain in full-time positions. Wage growth also picked up, with average hourly earnings rising 3.3% from a year earlier after a 3.0% increase in May, suggesting income growth remains supportive of household spending.
The figures are unlikely to fundamentally change the Bank of Canada's policy outlook, but they do weaken the case for markets to price a more dovish stance ahead of next week's meeting. Governor Tiff Macklem has emphasized that the larger challenge facing Canada is structural rather than cyclical, with evolving trade relations under the USMCA review process expected to reshape investment and growth over time. One stronger employment report does little to resolve those longer-term uncertainties, but it does suggest the domestic economy is going through that adjustment period in a position of greater strength than many investors had assumed.
| Indicator | June | May | Expectation |
|---|---|---|---|
| Employment Change | +18.2k | +87.8k | +10.0k |
| Unemployment Rate | 6.5% | 6.6% | 6.6% |
| Employment Rate | 60.8% | 60.7% | — |
| Participation Rate | 65.0% | 65.0% | — |
| Average Hourly Wages (YoY) | 3.3% | 3.0% | — |
| Employment (YoY) | +99k (+0.5%) | — | — |
| Full-Time Employment (YoY) | +131k (+0.8%) | — | — |
EUR/USD Daily Outlook
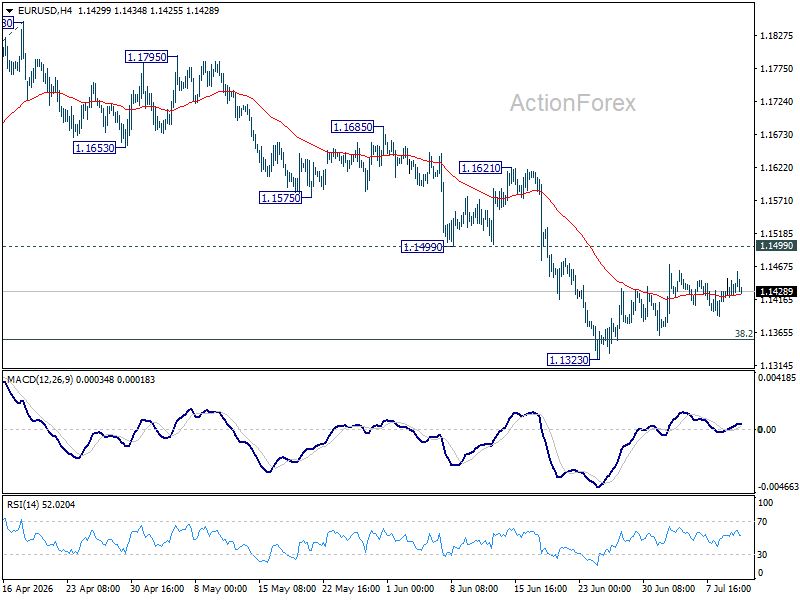
EUR/USD is still bounded in consolidations above 1.1323 and intraday bias remains neutral. . With 1.1499 support turned resistance intact, further decline is expected. On the downside, break of 1.1323 will resume the fall from 1.2081 to 100% projection of 1.2081 to 1.1408 from 1.1848 at 1.1175. However, decisive break of 1.1499 will turn bias back to the upside 1.1621 resistance and above.
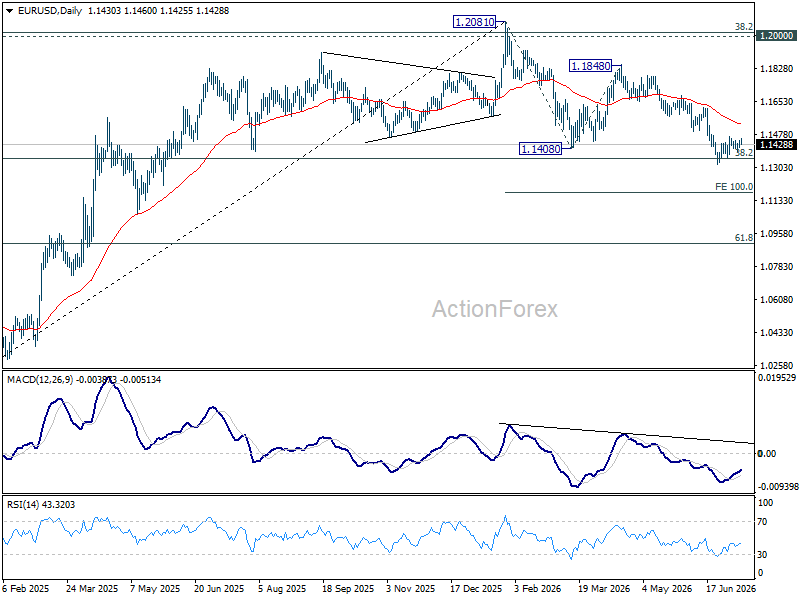
In the bigger picture, focus is back on 38.2% retracement of 1.0176 to 1.2081 at 1.1353. Decisive break there will revive the case of medium term bearish trend reversal after rejection by 1.2 key cluster resistance level. Further fall should be seen to 61.8% retracement at 1.0904. Nevertheless, strong rebound from 1.1353, followed by break of 1.1621 resistance, will retain medium term bullishness.
USD/JPY Daily Outlook
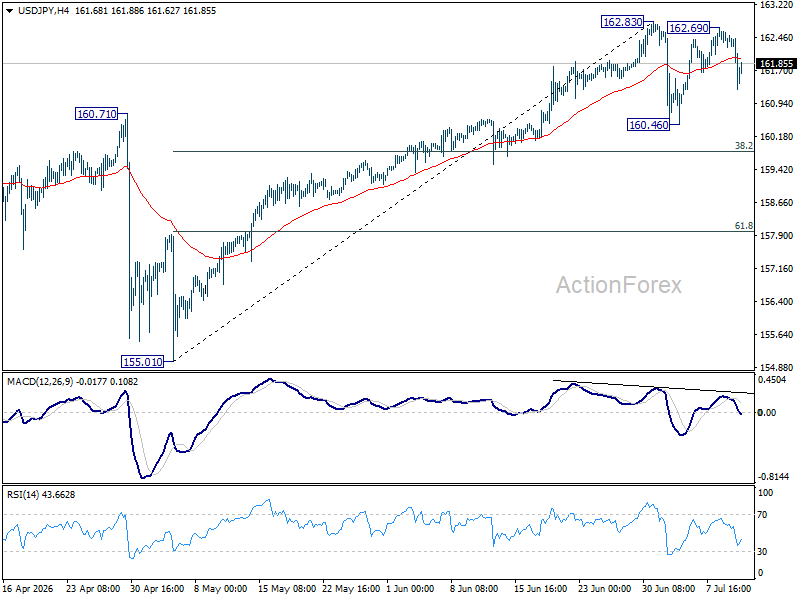
USD/JPY falls sharply today but still it's bounded in range below 162.83. Intraday bias remains neutral and more consolidations would be seen. In case of deeper pullback, downside should be contained by 38.2% retracement of 155.01 to 162.83 at 159.84. On the upside, firm break of 162.83 will resume larger up trend.
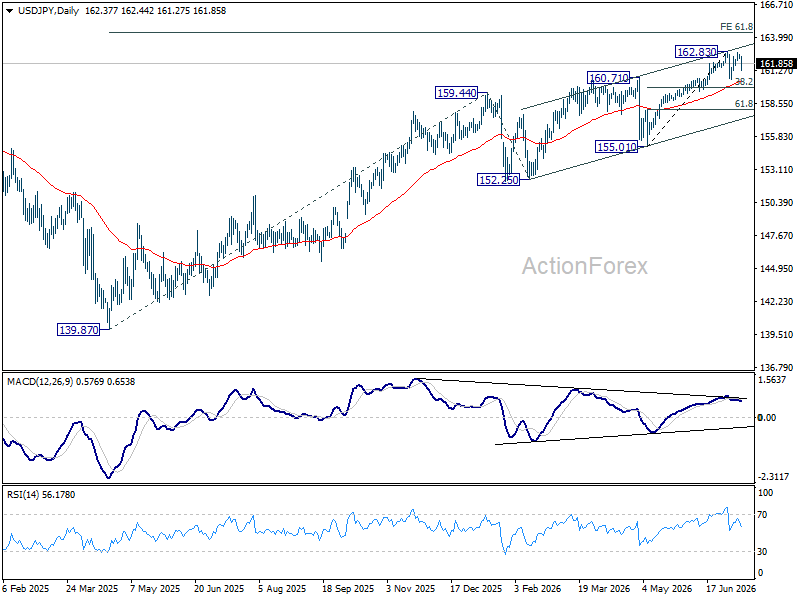
In the bigger picture, rise from 139.87 (2025 low) is seen as another rising leg of the long term up trend. Next target is 61.8% projection of 139.87 to 159.44 from 152.25 at 164.34. For now, outlook will remain bullish as long as 155.01 support holds, even in case of deep pullback.
GBP/USD Daily Outlook
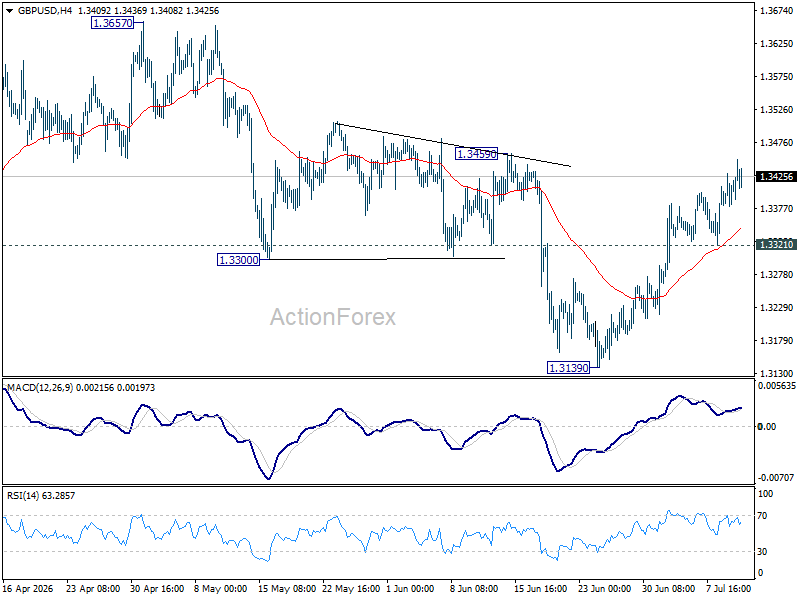
Intraday bias in GBP/USD remains on the upside for the moment. Firm break of 1.3459 will argue that whole correction from 1.3867 has completed, and target 1.3657 resistance for confirmation. On the downside, below 1.3321 minor support will bias neutral again first.
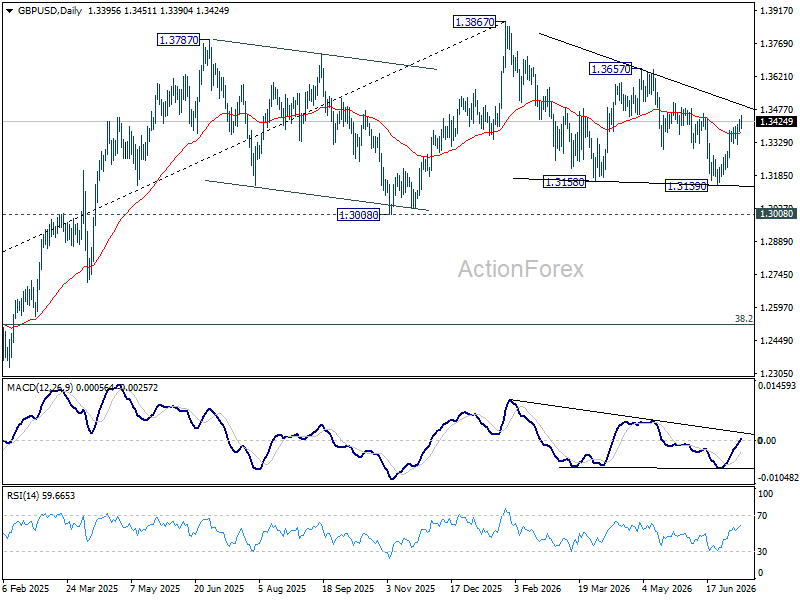
In the bigger picture, price actions from 1.3867 are a corrective pattern within the broader up trend from 1.0351 (2022 low). With 1.3008 support intact, medium term bullishness is maintained and break of 1.3867 is in favor for a later stage, towards 1.4248 key resistance (2021 high). However, firm break of 1.3008 will at least bring deeper fall to 38.2% retracement of 1.0351 to 1.3867 at 1.2524, with increased risk of bearish reversal.
AUD/USD Daily Report
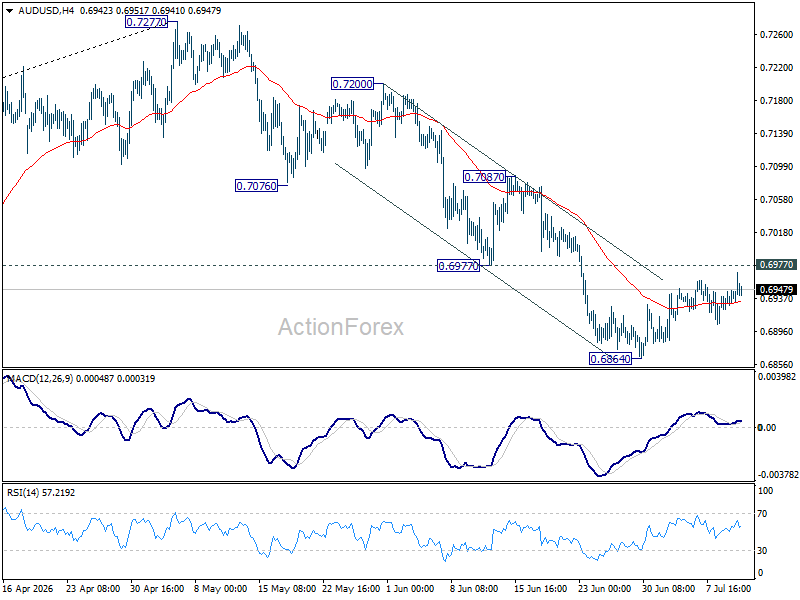
Intraday bias in AUD/USD remains neutral as consolidations continue above 0.6864. Further fall is expected as long as 0.6977 support turned resistance holds. Below 0.6864 will target 0.6832 support. Firm break there will target 0.6756 fibonacci level. However, sustained break of 0.6977 will bring stronger rebound to 0.7087 resistance instead.
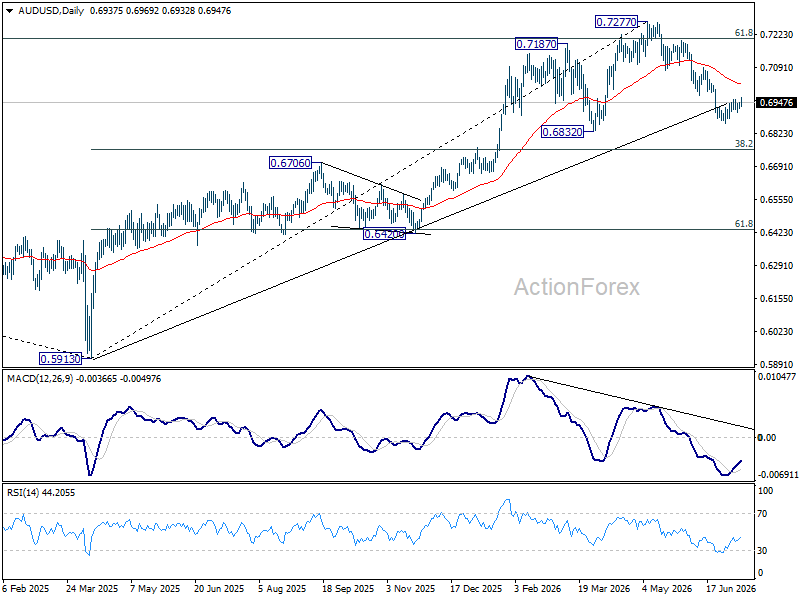
In the bigger picture, considering bearish divergence condition in D MACD, a medium term top could be formed at 0.7277 after failing to sustain above 61.8% retracement of 0.8006 (2021 high) to 0.5913 (2024 low) at 0.7206. Deeper fall could be seen to 38.2% retracement of 0.5913 to 0.7277 at 0.6756 as a correction. But strong support should be seen there to bring rebound. Consolidations would continue below 0.7277 for a while.
USD/CAD Daily Outlook
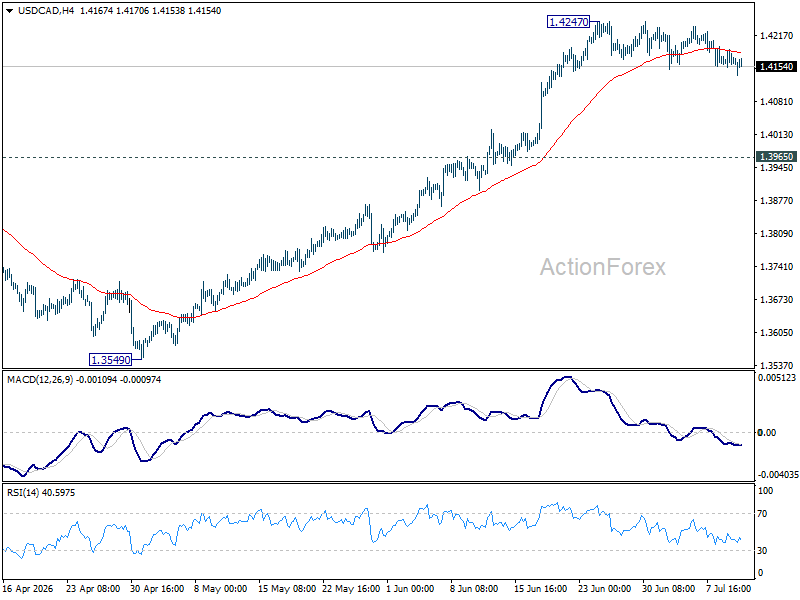
USD/CAD is still extending consolidations below 1.4247 and intraday bias remains neutral. Deeper pullback cannot be ruled out. But downside should be contained above 1.3965 resistance turned support. Above 1.4247 will resume the rally from 1.3480 to 61.8% retracement of 1.4791 to 1.3480 at 1.4290. Firm break there will pave the way back to 1.4791 high.
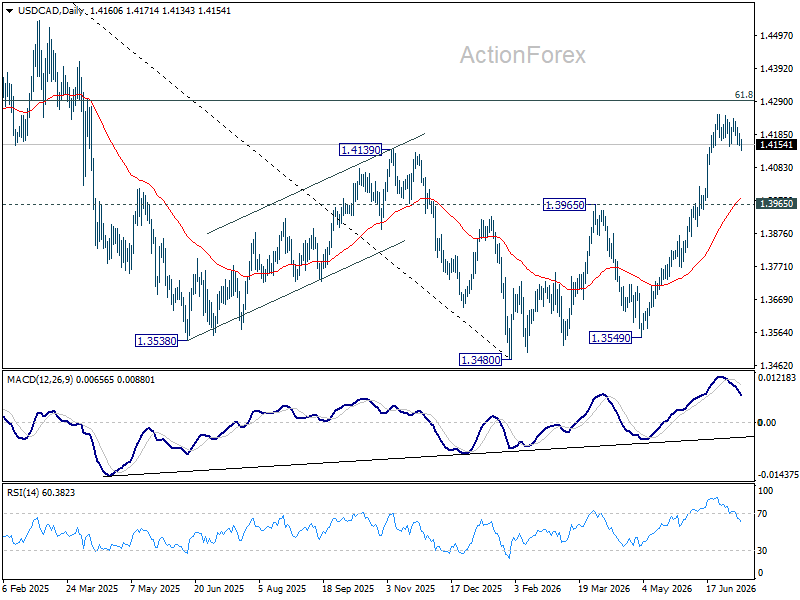
In the bigger picture, current development suggests that fall from 1.4791 has completed as a three wave correction to 1.3480. It's still early to judge if rise from there a corrective bounce, or resumption of the larger up trend from 1.2005 (2021 low). But in either case, retest of 1.4791 high should be seen next.
GBP/JPY Daily Outlook
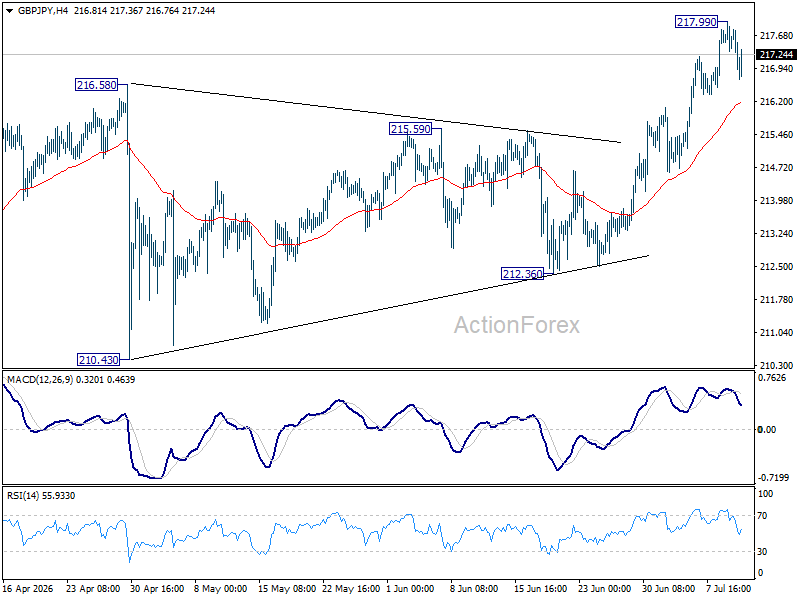
Intraday bias in GBP/JPY is turned neutral again with current retreat. Some consolidations should be seen below 217.99 first. But further rally is expected as long as 55 D EMA (now at 214.44) holds. Above 217.99 will resume larger up trend to 220.90 fibonacci projection level next.
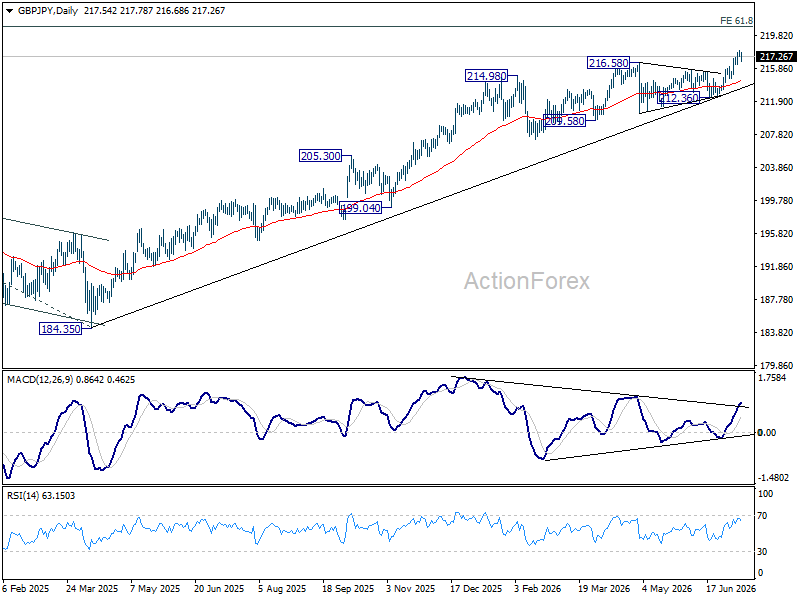
In the bigger picture, there is no clear sign of trend reversal yet. The long term up trend could still extend to 61.8% projection of 148.93 (2022 low) to 208.09 (2024 high) from 184.35 at 220.90 on resumption. However, sustained break of 55 W EMA (now at 207.89) will argue that it's already in medium term down trend for 184.35 support.
EUR/JPY Daily Outlook
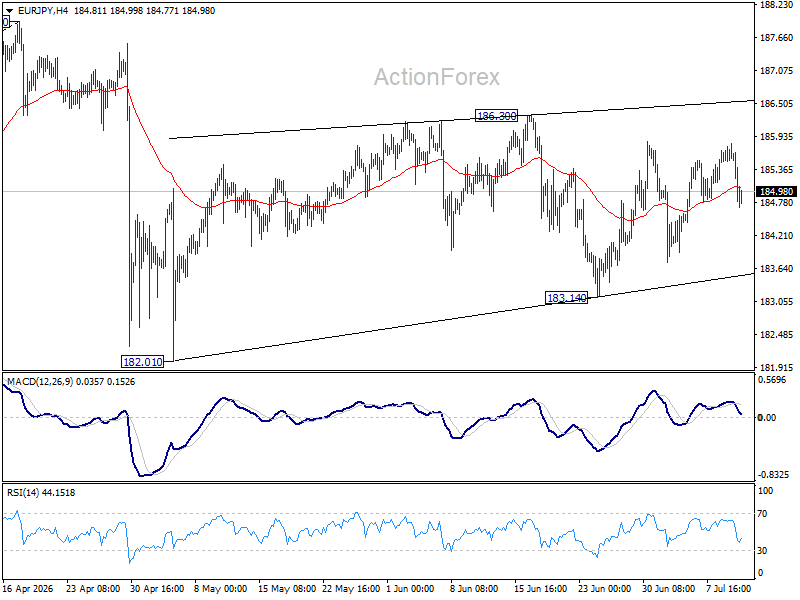
No change in EUR/JPY's outlook as range trading continues. Intraday bias remains neutral for the moment. On the upside, break of 186.30 will resume the rebound from 182.01 to retest 187.93 high. On the downside, break of 183.14 will target 182.10 support next.
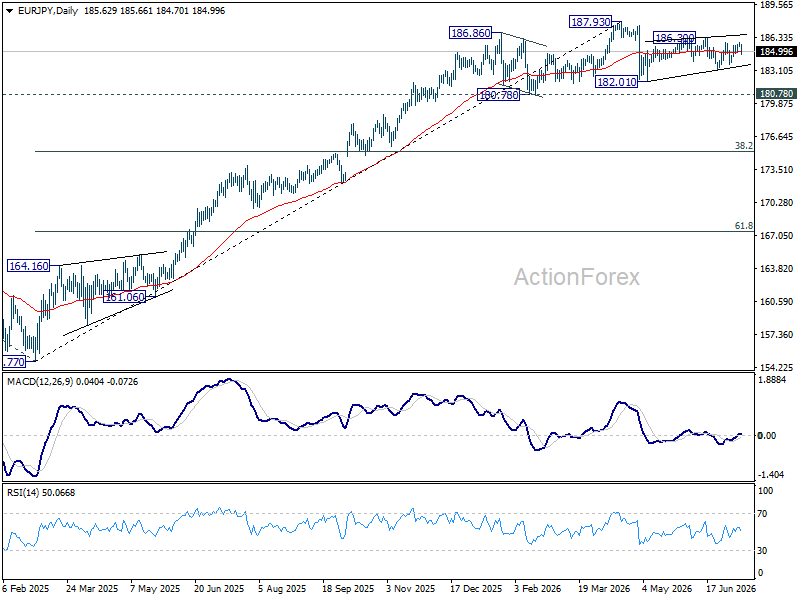
In the bigger picture, there is no sign of reversal yet. Uptrend from 114.42 (2020 low) is still expected to resume at a later stage to 78.6% projection of 124.37 (2022 low) to 175.41 (2025 high) from 154.77 at 194.88. However, sustained break of 55 W EMA (now at 179.76) will argue that it's already in a medium term down trend to 175.41 resistance turned support and below.
EUR/GBP Daily Outlook
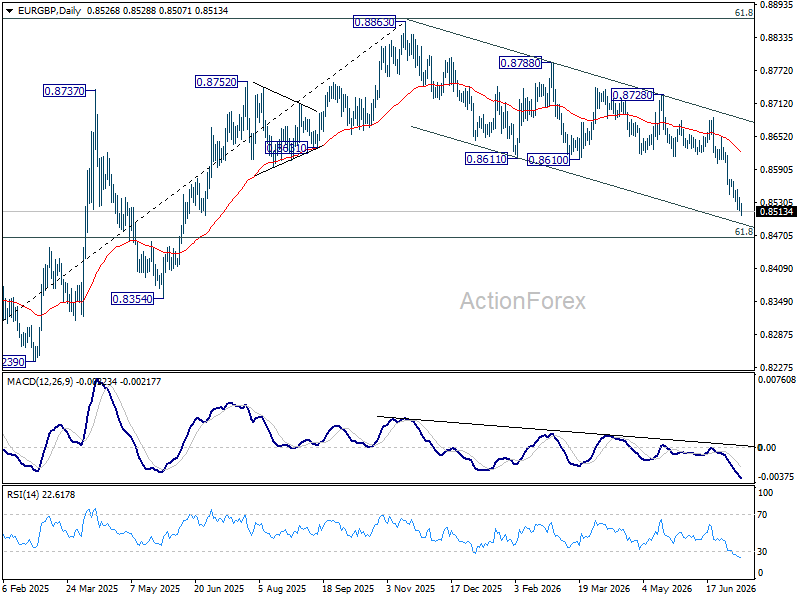
Intraday bias in EUR/GBP remains on the downside for 61.8% retracement of 0.8221 to 0.8863 at 0.8466. Downside could be contained there considering loss of momentum as seen in 4H MACD. On the upside, above 0.8539 resistance will turn intraday bias neutral again. But recovery should be limited by 0.8601 support turned resistance to bring another fall.
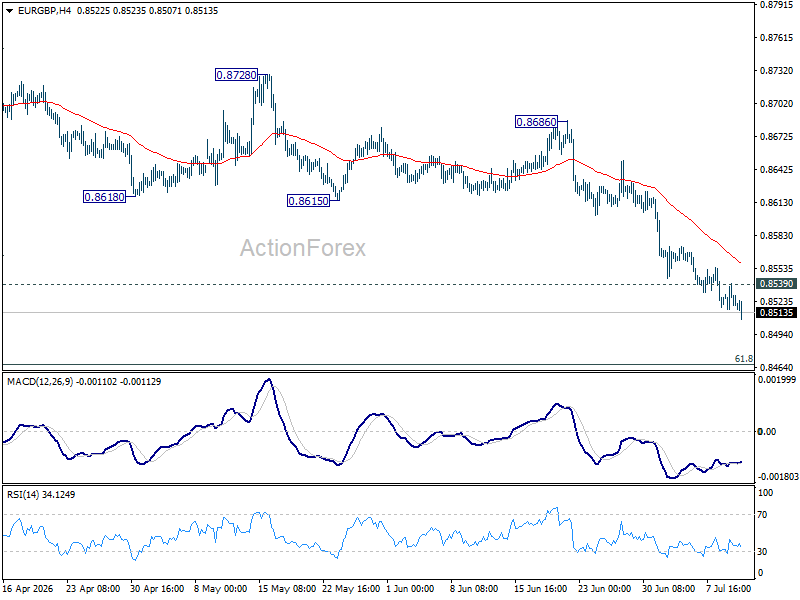
In the bigger picture, current development suggests that rise from 0.8221 (2024 low) has completed at 0.8863, just ahead of 38.2% retracement of 0.8221 (2024 low) to 0.8863 (2025 high) at 0.8618. Deeper fall would be seen back to 0.8201 (2022 low). For now, outlook will be neutral at best as long as 0.8863 hold.
EUR/AUD Daily Outlook
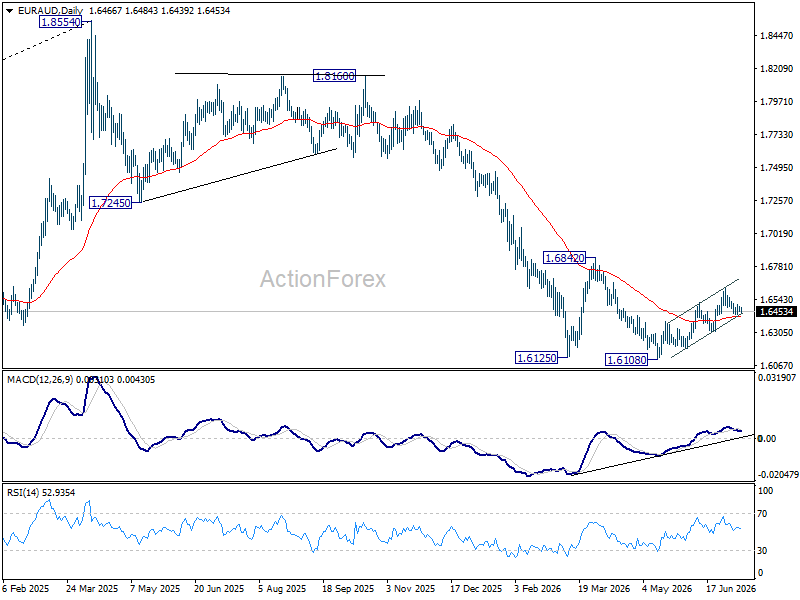
Range trading continues in EUR/AUD and intraday bias remains neutral. Further rise is in favor as long as 1.6306 support holds. Above 1.6617 will extend the rebound from 1.6108 towards 1.6842 key structural resistance. However, firm break of 1.6306 will turn bias back to the downside for retesting 1.6108.
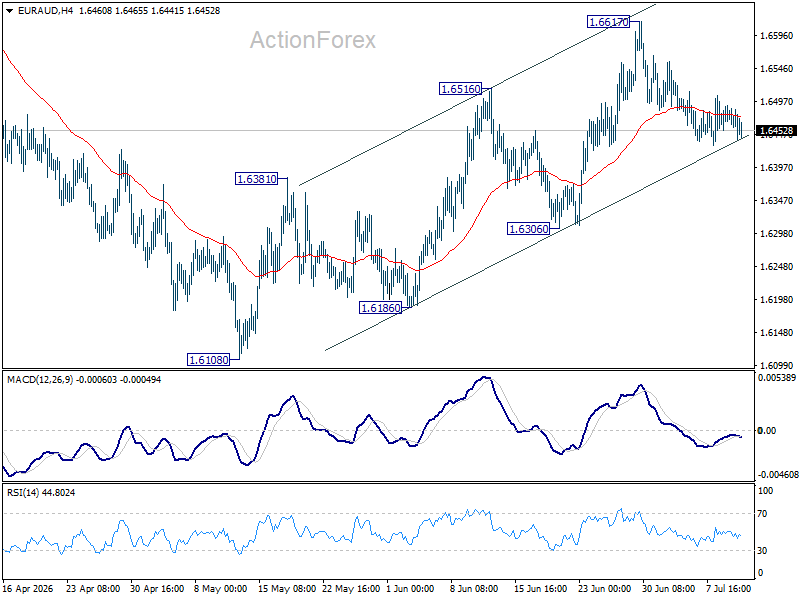
In the bigger picture, outlook will stay bearish as long as 1.6842 resistance holds. Fall from 1.8554 (2025 high) is expected to continue to 61.8% retracement of 1.4281 to 1.8554 at 1.5913. Decisive break there will pave the way back to 1.4281 (2022 low). However, firm break of 1.6842 should confirm medium term bottoming, and bring stronger rally.