Sample Category Title
ECB Minutes: Inflation Damage Already Too Broad to Ignore
The minutes of the ECB's June meeting reinforced the Governing Council's conviction that inflationary pressures had become too broad and persistent to justify waiting any longer before tightening policy. While all members unanimously backed a 25 basis point rate hike, the discussion showed policymakers had fundamentally reassessed the nature of the Middle East energy shock. Rather than treating it as a temporary supply disruption, members concluded that "the current situation no longer qualified as a case for looking through the shock" and that "the option value of waiting for further information had diminished considerably."
The Governing Council argued that inflation had spread well beyond energy prices. Members noted "increasingly visible and broad-based indirect effects on non-energy inflation," while warning that second-round effects were becoming increasingly likely the longer the energy shock persisted. Core inflation was now projected to remain above the ECB's 2% target throughout the forecast horizon. Significantly, policymakers concluded that even under a milder scenario in which the Middle East conflict eased and energy prices were lower, "a significant portion of the inflationary damage... would already have worked its way into the broader economy." Supply chain disruptions, higher production costs and firms' pricing decisions would not simply reverse alongside lower oil prices, making the June rate increase appropriate across all scenarios considered.
Despite the hawkish assessment of inflation, the minutes reaffirmed the ECB's commitment to a data-dependent and meeting-by-meeting approach. Members stressed that communication should "refrain from giving any guidance regarding the future interest rate path," arguing it should remain neutral rather than implying either a sequence of further hikes or a one-off move. At the same time, the Governing Council reiterated its determination to return inflation sustainably to 2%, emphasizing that policy would remain agile and flexible as it assessed how higher energy costs continue feeding through wages, inflation expectations and broader price-setting across the euro area.
(ECB) Monetary policy accounts
Account of the monetary policy meeting of the Governing Council of the European Central Bank held in Frankfurt am Main on Wednesday and Thursday, 10-11 June 2026
9 July 2026
1. Review of financial, economic and monetary developments and policy options
Financial market developments
Ms Schnabel started her presentation by noting that, since the Governing Council's previous monetary policy meeting on 29-30 April 2026, euro area financial markets had been torn between two competing developments: the unresolved conflict in the Middle East and the global artificial intelligence (AI) boom. The continued disruption to shipping in the Strait of Hormuz had reinforced expectations that oil prices would remain higher for longer, despite markedly lower near-term oil prices. Inflation fixings had declined from their high April readings but continued to hover above 3% for 2026 and above 2% for 2027. In tandem with oil prices, ECB rate expectations had moderated somewhat. However, markets still priced in around three interest rate hikes overall, while the median response in the ECB Survey of Monetary Analysts was an expectation of only two hikes. Although the war was weighing on growth expectations in the euro area and globally, investors’ risk appetite had remained strong. A key underlying factor had been renewed optimism about AI and strong momentum in AI-related investment. As a result, euro area equity markets had recovered close to pre-war levels, and corporate and sovereign bond spreads remained narrow. Overall, financial conditions had remained broadly unchanged since April 2026 but remained tighter than before the start of the Middle East war.
Near-term oil prices had declined markedly from the peak reached at the time of the Governing Council's April monetary policy meeting. Brent crude oil prices had fallen from USD 118 to about USD 94 per barrel and had been hovering around that level since late May. At the same time, futures prices over longer horizons had remained largely insulated from the pronounced volatility observed in near-term contracts, with the latest futures curve even somewhat above the April curve and significantly above the levels recorded before the outbreak of the conflict. Gas prices had edged higher since the April meeting and continued to trade at around 50% above their pre-war levels.
The impact of the Middle East conflict had extended beyond crude oil and gas prices. Since the start of the war, the prices of refined products such as petrol, diesel and jet fuel had increased by around 40-45%, significantly more than the price of oil. Prices of fertiliser-related products and plastics had also increased sharply, suggesting that higher energy costs were feeding into broader inflation by affecting downstream product prices. Food prices were expected to remain slightly higher relative to pre-war expectations and were also subject to some upside risks due to the “El Niño” event.
The shifts in the oil futures curve had been mirrored in market-based inflation expectations. Inflation compensation (excluding tobacco) for 2026 and early 2027 had declined from the peaks at around the time of the Governing Council's previous monetary policy meeting. For later horizons, inflation fixings remained close to their April 2026 levels. This suggested that investors continued to expect the inflationary effects of the energy price shock to persist beyond the initial phase of the conflict, likely reflecting the expected pass-through from energy costs to other components of the pricing chain. Medium-term inflation compensation (excluding tobacco) – the one-year inflation-linked swap rate two years ahead – had increased by around 30 basis points following the outbreak of the war, driven partly by inflation risk premia, and stood somewhat above 2%. Longer-term inflation expectations remained broadly anchored, with only a small upward shift in five-year inflation compensation five years ahead.
Risks to the inflation outlook over the medium term had shifted markedly to the upside since the outbreak of the war in the Middle East. According to risk-neutral options prices, markets assigned a 45% probability to inflation being above 2.5%, on average, over the next two years. By comparison, the probability of inflation being below 1.5% was assessed to be less than 15%. Interest rate markets were also pointing to upside risks, but uncertainty surrounding the policy path had moderated somewhat over the weeks preceding the current meeting and remained less pronounced than during the 2022-23 inflation spike. Hence, despite high uncertainty surrounding the macroeconomic outlook, the ECB’s reaction function appeared to be well understood, thus containing rate volatility.
Against this backdrop, markets continued to expect a monetary policy response from the ECB to the persistent shock, with the precise number of expected rate hikes varying with oil prices. Markets were now firmly pricing in a first 25 basis point rate hike in June and a second one in September, with an 84% probability of a third 25 basis point rate hike by the end of 2026. The median expectation in the Survey of Monetary Analysts was for only two rate hikes in 2026, similar to expectations in Bloomberg and Reuters surveys. By contrast, in the United States monetary policy expectations had moved in the opposite direction over the previous weeks. After pricing out two interest rate cuts since the start of the war, market participants had recently started to fully price in one rate hike for 2026.
Euro area nominal overnight index swap rates had declined mildly since the Governing Council's previous meeting on the back of somewhat lower rate expectations and inflation compensation, but they remained higher across maturities than before the war.
The persistent shock, elevated macroeconomic uncertainty and higher risk-free rates had left their footprint on growth expectations. Market analysts nevertheless still expected growth to be well into positive territory, suggesting that forecasters assigned a low probability to a recession.
Despite dampened growth expectations, risk sentiment had generally remained strong. While investors’ risk appetite had declined markedly in the euro area following the escalation of the conflict, the deterioration had been moderate by historical standards. Risk sentiment had lately recovered and was approaching levels seen before the start of the war.
A key factor supporting risk sentiment had been renewed optimism about AI and its implications for corporate earnings. Earnings per share expectations for both the S&P 500 and the STOXX Europe 600 had been revised steadily higher since the start of 2026. They had continued to increase after the outbreak of the war in the Middle East, with revisions being particularly pronounced for the United States. Overall, investors appeared to view the earnings boost associated with the AI investment cycle as more than offsetting the negative impact of the energy price shock.
Having recovered from their trough in March 2026, euro area equities currently stood well above their levels at the beginning of 2026 and close to those before the start of the war. A decomposition of the drivers of euro area equity markets confirmed that higher expected short-term and, especially, longer-term earnings had supported stock market developments, offsetting the negative impact of higher risk-free rates and higher risk premia.
Corporate credit markets had also benefited from strong risk appetite and the broader optimism around AI, as the investment boom was seen as supportive for corporate earnings and credit quality. Corporate bond supply linked to the AI investment cycle had increased sharply over the past two years, especially in the United States. Euro area sovereign bond spreads over overnight index swap rates had also declined since the Governing Council's April monetary policy meeting. Like corporate bond spreads, sovereign bond spreads had shown no sign of a sustained widening since the start of the conflict.
Compressed risk premia and elevated valuations across market segments despite significant macroeconomic shocks and rising inflation risks remained a key concern. High equity valuations, especially in Japan and the United States, increased the risk of an abrupt repricing, particularly if benign growth expectations or earnings prospects related to AI optimism were to be revised or if persistent inflation required material interest rate increases.
The euro had weakened since the start of the Middle East war, reflecting the adverse terms-of-trade shock. However, the depreciation had been moderate overall, with the nominal effective exchange rate remaining close to pre-war levels. Against the US dollar, the euro had continued to move lower but remained in the narrow trading range around EUR/USD 1.16 observed over the past year.
Ms Schnabel concluded by noting that euro area financial conditions had been broadly unchanged since the Governing Council's previous meeting, as reflected in the ECB's Macro-Finance Financial Conditions Index, but they remained tighter than before the war. Taking a longer perspective, financial conditions had remained broadly constant since the ECB’s last interest rate cut in June 2025, despite the repricing of monetary policy expectations after the start of the war, with the key easing factor having been stronger risk assets.
The global environment and economic and monetary developments in the euro area
Mr Lane then went through the latest economic, monetary and financial developments in the global economy and the euro area. Uncertainty surrounding the war in the Middle East remained very elevated, 15 weeks into the conflict. Ongoing negotiations might pave the way for an eventual resolution, but the potential for setbacks and re-escalation was high. The full implications of the war for medium-term inflation and growth would depend on the intensity and duration of the energy price shock, as well as the scale of its indirect and second-round effects.
Starting with inflation developments, headline inflation – as measured by the Harmonised Index of Consumer Prices (HICP) – had increased to 3.2% in May, from 3.0% in April. Although energy prices had declined in month-on-month terms, base effects meant that annual energy inflation had edged up by 0.1 percentage points to 10.9%. Non-energy inflation had increased by 0.2 percentage points to 2.4% and food inflation had decreased to 2.0% from 2.4%, while core inflation – excluding the volatile components of energy and food – had increased to 2.5% from 2.2%. Goods inflation had inched up by 0.1 percentage points to 0.9% and services inflation had risen by 0.5 percentage points to 3.5%.
Domestic cost pressures had eased in the first quarter, supported by slower growth in wages and profits. The annual growth rate of the GDP deflator had declined to 2.3% in the first quarter of 2026, from 2.6% in the fourth quarter of 2025. Profit margins had continued to shrink, indicating that profits continued to buffer the pass-through of higher labour costs. The energy shock was not feeding into wages yet. Annual growth of negotiated wages had declined to 2.5% in the first quarter of 2026, from 2.9% in the fourth quarter of 2025. This outcome was broadly in line with the ECB wage tracker, which, along with corporate surveys on wage expectations, continued to indicate that wage growth should ease over the year. Compensation per employee was projected to grow steadily at 3.2% in 2026, 2027 and 2028, implying an increase in real wages in each year.
A range of forward-looking signals, including Purchasing Managers’ Index (PMI) input prices, pipeline pressures for food, selling-price expectations and some disruptions in supply chains, pointed to inflationary pressures in the coming months. Moreover, some indicators of underlying inflation had already been driven higher by the energy shock. Two exclusion-based measures of inflation available for May had each edged up by 0.2 percentage points – the HICP excluding energy and unprocessed food stood at 2.3% and the HICP excluding energy at 2.4%. Changes in the model-based measures of inflation available for April ranged from 2.2% to 2.6%, with the Persistent and Common Component of Inflation (PCCI) measure for headline inflation having increased by 0.2 percentage points since March. The signal from such measures of underlying inflation was consistent with the above-target rate of headline inflation for 2027 incorporated in the baseline projections that were published as part of the June 2026 Eurosystem staff macroeconomic projections for the euro area.
The increase in energy prices would lift inflation further over the summer and keep it well above the ECB’s 2% target into the first half of 2027. The June staff projections saw headline inflation rising from 3.2% in the current quarter to 3.4% in the third and fourth quarters of 2026, before it eased to 3.2% and then to 2.3% in the first and second quarters of 2027 and stabilised at target from the third quarter onwards. On average, headline inflation was projected at 3.0% in 2026, 2.3% in 2027 and 2.0% in 2028. The trajectory of headline inflation was dominated by the projected energy inflation profile. The downward slope of the energy futures curves, compounded by a negative base effect in the energy component, would push inflation down in 2027, while the introduction of the EU Emissions Trading System 2 would push energy inflation up in 2028. Relative to the March 2026 ECB staff projections, headline inflation had been revised up by 0.4 percentage points for 2026 and 0.3 percentage points for 2027. This was largely on account of higher energy and food price assumptions, as well as higher goods and services inflation due to stronger indirect effects from the energy shock. Headline inflation had been revised down by 0.1 percentage points for 2028, reflecting a steeper than previously assumed decline in oil prices. Non-energy inflation was projected to average 2.5% in 2026, 2.7% in 2027 and 2.2% in 2028. Core inflation was projected at 2.5% for both 2026 and 2027, and at 2.2% for 2028, having been revised up by 0.2 percentage points, 0.3 percentage points and 0.1 percentage points respectively.
Inflation expectations over shorter horizons remained well above the levels observed before the outbreak of the war in the Middle East. At the same time, most measures of longer-term inflation expectations stood at around 2%, supporting the stabilisation of inflation around the ECB’s target in the medium term. According to market-based inflation compensation measures, inflation was expected to average 3.0% in 2026, 2.4% in 2027 and 2.0% in 2028. The latest Survey of Monetary Analysts also pointed to above-target inflation in the near term but a return to target in the third quarter of 2027. Households continued to expect above-target inflation also at longer-term horizons, which might reflect an upward bias in household inflation expectations that was visible in consumer surveys globally. However, the fact that longer-term expectations – as reported in the ECB Consumer Expectations Survey – had remained relatively stable relative to pre-war levels and that the term structure of household inflation expectations was steeply downward-sloping confirmed that the current inflation shock was expected to fade relatively quickly.
Turning to the external environment, the global economy had remained resilient overall. Incoming information pointed to global economic growth (excluding the euro area) of 0.7% quarter on quarter in the first quarter of 2026, following growth of 0.8% in the fourth quarter of 2025, and survey indicators suggested continued expansion in the second quarter. The global composite PMI (excluding the euro area) was little changed in May, at 52.3. Services activity had been more subdued than manufacturing, since manufacturing appeared to be supported by a temporary boost as firms built buffers in anticipation of supply chain disruptions. Global PMI supplier delivery times were stable in May, after lengthening in April, and supply pressures had so far remained concentrated in energy and energy-intensive goods.
Since the Governing Council’s April meeting, Brent crude oil prices had declined by roughly 20% to around USD 94 per barrel, although this was still about 30% higher than pre-war levels. European gas prices stood about 50% above their pre-war level, at around EUR 50 per MWh. The latest oil futures of 8 June stood somewhat below the baseline assumptions of the June staff projections for the duration of 2026 and reconnected to the baseline assumptions from 2027 onwards. The euro had depreciated slightly – by 1.4% to USD 1.15 and by 0.8% in nominal effective terms – amid continued uncertainty over a potential peace agreement to bring an end to the conflict in the Middle East. This recent mild depreciation only partly reversed the sizeable appreciation that had taken place during the first half of 2025.
The euro area economy had contracted unexpectedly by 0.2% in the first quarter of the year, owing to a contraction in measured multinational activity in Ireland. Excluding Ireland, the euro area economy had grown by 0.3%, supported by domestic demand and exports. Public and private consumption had contributed positively, while investment and inventories had declined. Nevertheless, the war in the Middle East was weighing on activity. The euro area composite PMI had fallen again in May, by 0.3 points to 48.5. The weakening in services activity, which was more pronounced than in manufacturing, mirrored the global PMI dynamics since the start of the war. However, the support from precautionary inventory accumulation by firms already seemed to be fading, as new orders had stagnated in May. Supplier delivery times had lengthened further but remained far shorter than during the pandemic period.
The labour market remained resilient. The unemployment rate continued to stand close to historical lows, at 6.3% in April, with recent surveys pointing to some labour hoarding. Labour demand had cooled further, and firms and households expected the labour market to weaken. Employment growth had slowed in the first quarter of the year, to 0.1% from 0.2%. The job vacancy rate had edged down by 0.1 percentage points to 2.2% in the first quarter of 2026, and high-frequency indicators – such as Indeed job postings – had weakened. The composite employment PMI had edged down again in May, to 49.0, reflecting developments in both manufacturing and services.
The euro area fiscal stance was projected to loosen by 0.5 percentage points in 2026 and then to tighten somewhat again over 2027-28. The loosening in 2026 was mainly on account of investment and fiscal transfers, with the increase in investment primarily reflecting high defence and infrastructure spending in Germany. The subsequent tightening was seen as the result of a mix of factors, including the unwinding of temporary fiscal support measures and the Next Generation EU funding programme coming to an end.
Looking ahead, domestic demand was now projected to be weaker than had been expected in the March projections, as the war was weighing on confidence and higher energy costs were eroding real incomes. At the same time, household balance sheets were solid overall, and consumption should remain the main driver of growth. Higher energy costs and lower confidence would dent private investment in the short run, but it should be underpinned by firms investing in new digital technologies. Higher government spending on defence and infrastructure should continue to support public investment. These factors were expected to provide some cushioning against the fallout from the war. The June staff baseline projections foresaw real GDP growth of 0.8% in 2026, 1.2% in 2027 and 1.5% in 2028. Relative to the March projections, growth had been revised down by 0.1 percentage points for 2026 and 2027, reflecting a more pronounced impact of the war on commodity markets, real incomes and confidence. For 2028, growth had been revised up by 0.1 percentage points owing to an unwinding of these effects.
The June baseline projections were flanked by three scenarios – one milder, one adverse and one severe – that reflected the large uncertainty surrounding the baseline. While the scenarios in the March staff projections were more explicitly linked to assumptions about the duration of the war, the scenario analyses in the June staff projections were instead calibrated using market‑implied probability distributions for commodity prices. Under the adverse and severe scenarios, inflation would remain above target over the entire projection horizon, while growth would be lower than in the baseline in the near term. Under the milder scenario, inflation would peak at a level similar to the baseline but would fall below target in the medium term, while growth would be slightly above the baseline for 2027 and 2028.
Financial conditions were broadly unchanged since the Governing Council’s previous meeting but remained tighter than before the war. The cost of issuing market-based debt had risen to 4.0% in April, from 3.9% in March. The growth rate of corporate bond issuance had risen to 4.6%, from 4.1% in March. Regarding bank-based financing of firms, higher funding costs, higher risk perceptions and generally low risk tolerance might keep credit supply relatively tight, but solid balance sheets were helping banks withstand current economic and financial headwinds. Bank lending rates for firms had remained at 3.6% in April and mortgage rates at 3.4%. The annual growth rate of bank lending to firms had increased to 3.4% in April, from 3.2% in March. Mortgage lending again grew by 3.0% in April.
Monetary policy considerations and policy options
On the basis of incoming information and a comprehensive assessment of the inflation outlook and the risks surrounding it, as well as the dynamics of underlying inflation and the strength of monetary policy transmission, Mr Lane proposed that the three key ECB interest rates be increased by 25 basis points. The incoming information about the intensity and duration of the energy shock and the likely persistence of its impact on inflation suggested that a 25 basis point policy rate hike in June was appropriate. This would ensure that the Governing Council remained well positioned in the period ahead.
The case for a measured adjustment in the policy rate was robust across a wide range of scenarios, given the projected paths for inflation and output. The absence of financial stress on the one hand, and solid household, corporate and bank balance sheets on the other, meant that a hike should be transmitted through the financial system in an orderly manner. Retaining the data-dependent, meeting-by-meeting approach without a pre-commitment to any particular rate path remained appropriate.
2. Governing Council’s discussion and monetary policy decisions
Economic, monetary and financial analyses
Regarding the economic analysis, members broadly agreed with the assessment provided by Mr Lane in his introduction. The external environment had remained resilient overall but continued to be shaped by the global energy shock and still elevated geopolitical uncertainty. While a possible resolution to the war in the Middle East had been intimated many times, the conflict was now into its fourth month, and incoming information had shown the energy shock to be more persistent and intense than previously expected, particularly in terms of its global effects. Still, global growth was holding up, with global PMIs in expansionary territory and solid growth in the United States and China. Global growth was being supported by the AI-related investment boom, which constituted a positive global demand shock that was cushioning the adverse growth effects of the energy shock while reinforcing its inflationary impact, particularly in the United States. Indeed, global and US inflation were increasing sharply as pipeline pressures propagated through global supply chains, especially for goods. US headline inflation had risen to 4.2% in May, with demand conditions appearing to be stronger than in the euro area, partly because of the AI boom but also on account of wealth effects.
Commodity markets – for oil in particular – were a central theme in the discussion. In the baseline of the June staff projections, oil prices were expected to remain at a higher level than in the March adverse scenario, particularly over longer horizons, indicating that the shock had become more persistent. Oil and gas prices also remained well above pre-war levels and higher energy prices were having knock-on effects on downstream markets, such as refined products, plastics and fertilisers. At the same time, it was argued that the shock should be increasingly viewed as being more of an oil shock than a broad-based energy shock involving natural gas, fertilisers and other channels. This was partly because natural gas from the affected region represented a limited share of global gas consumption and because an acceleration in renewable energy could substitute for gas relatively quickly. Oil, on the other hand, was a different matter given the very large supply disruption, low short-run demand elasticities and the relatively limited and gradual impact on oil demand from the transition to electric vehicles.
While oil prices continued to be volatile in light of fluctuating prospects for a resolution to the conflict, it was suggested that the current market pricing embedded in the futures curve might be too benign, with the expectation of a future fall in oil prices being optimistic. The earlier accumulation and subsequent release of oil inventories by China had been one factor explaining global energy price developments, and these dynamics – together with a wider global run-down of pre-existing inventories – could have helped to contain upward price pressures by attenuating physical supply disruptions. However, inventories were falling and, if they reached critical levels, oil prices could rise quickly, with additional uncertainty particularly in relation to refined fuels. In this context, there was a discussion of why oil prices had not risen more sharply despite the continued closure of the Strait of Hormuz. Although this could potentially be attributed to expectations about a peace deal, other possible explanations included increased oil production, the use of pipelines and other alternative routes, inventory usage, Chinese storage behaviour, and demand destruction, including from lower energy-intensive production activity in China. Looking ahead, it was cautioned that even a sustainable resolution to the conflict in the Middle East would not necessarily mean an end to the shock. This was because it would take time for energy supplies to return to normal or to a new equilibrium, and inventories would also need to be replenished at some point, which could put upward pressure on energy prices for a sustained period, especially if reserves fell to very low levels before the conflict was resolved.
With regard to economic activity, members concurred with the assessment presented by Mr Lane. Adjusting for a temporary factor in Ireland, the euro area economy had grown in the first quarter of the year, supported by domestic demand and exports. When this adjustment was not taken into account, euro area GDP had unexpectedly contracted by 0.2% in the first quarter, owing to a sharp reduction in measured multinational activity in Ireland. It was important that the economic assessment and communication should distinguish statistical effects in Ireland from economic fundamentals, primarily by focusing on the modified domestic demand indicator for economic activity in Ireland developed by staff.
Euro area domestic demand remained relatively robust and the economy had shown momentum around the turn of the year, which was providing support to growth in 2026 via carry-over effects. However, the incoming data were, overall, seen as confirming that the energy shock was having greater implications for growth than previously expected. In particular, the war in the Middle East was weighing on activity and confidence, and surveys were pointing to a slowdown, especially in services. Manufacturing had held up so far, partly reflecting higher defence spending. However, this could be partly attributed to firms building up stocks to cope with supply chain pressures. It was suggested that such front-loading of production and inventory accumulation by firms should not be seen as giving too much comfort, since they reflected concerns about supply chains, such as those in globally integrated sectors like the automotive sector and the machinery sector. More generally, higher input costs and longer delivery times were putting pressure on firms. At the same time, it was reported that, for the Spanish economy, high-frequency real-time indicators pointed to practically no short-run impact on activity.
Overall, the war-related rise in energy prices was acting as an increasingly persistent negative supply shock, putting upward pressure on inflation and downward pressure on economic growth. Against this backdrop, the growth outlook had weakened, particularly when compared with the December 2025 staff projections, published prior to the start of the war, but also when compared with the March 2026 staff projections, and it remained fragile and surrounded by a high degree of uncertainty, with risks being to the downside. In the June 2026 projections baseline, staff now expected economic growth to average 0.8% in 2026, 1.2% in 2027 and 1.5% in 2028. This represented a downward revision for 2026 and 2027, reflecting a more pronounced impact of the war on commodity markets, real incomes and confidence. In particular, staff now expected domestic demand to be weaker than they had projected in March as the war weighed on confidence and higher energy costs eroded real incomes. At the same time, household balance sheets were solid overall and consumption should remain the main driver of growth. Higher energy costs and lower confidence would dent private investment in the short run, but it should be underpinned by firms investing in new digital technologies. Governments spending more on defence and infrastructure should continue to support public investment. These factors were expected to provide some cushioning against the fallout from the war. Therefore, economic growth was expected to increase gradually over the projection horizon and recession risks remained relatively low. The current situation could thus not be characterised as stagflation. In this context, it was also noted that the economy had exhibited surprising resilience in the face of other adverse shocks over recent years.
Nevertheless, the outlook for growth – especially for 2026 – was assessed as sluggish. However, it continued to be supported by still rising nominal incomes, accumulated savings, the resilient labour market, AI-related investment and government spending on defence and infrastructure. It was also argued that the euro area economy had become more adaptable to energy shocks, reflecting its reduced dependence on fossil fuels. These factors could help explain why the revision to the growth outlook in the latest projections had been relatively small compared with the revision to the inflation outlook. However, it was cautioned that the aggregate GDP outlook could be masking weaker domestic demand components, with consumption and investment revised down and only lower imports helping to cushion the effect on headline growth, with the scale of the revision for imports seen as relatively large when compared with the revision for domestic demand. The outlook for exports was constrained by a structural loss of market share to competition from China and by the euro area economy being less geared towards technology and AI than some other parts of the world. Risks to economic growth were to the downside, especially in services, with the risk of shortages and severe supply chain disruptions increasing the longer conflict-related disruptions went on. At the same time, it was suggested that the euro area economy would probably return to being more services-led if there were a resolution to the conflict. It was also argued that part of the weakness in euro area growth was structural and that this became more visible in challenging times. Over the medium term there was also a risk that the euro area’s structural growth challenges could be compounded if there were a more substantial fragmentation of the world economy.
Private consumption was one key channel through which higher energy prices would weigh on activity by eroding real disposable income and reducing consumer confidence. Although the effect on consumption could be partly buffered by using accumulated savings, it was noted that financially constrained households could not fully smooth consumption. Nevertheless, it was stressed that consumption should be supported by continued relatively strong nominal wage growth, rising real wage growth – especially later in the projection horizon – and low unemployment. There were also signs that consumers were adapting to higher fuel prices to some extent, as reflected in declining petrol consumption and strong sales of electric vehicles. At the same time, it was suggested that there were downside risks to the outlook for consumption. The rapid deterioration in consumer sentiment could weigh on spending. In addition, the assumption that there would be a swift recovery in consumption if the shock were temporary, was challenged. In particular, it was argued that households might instead perceive the repeated sequence of negative shocks over recent years as a more permanent deterioration in their income prospects, potentially linked to concerns about geopolitical developments and international fragmentation. It was also questioned whether the projections for private consumption were consistent with the shock being temporary. If the shock were perceived to be temporary, theory would suggest that households should buffer it by using their savings rather than by substantially reducing their consumption. Given that, in the projections, consumption was expected to decline, this could be interpreted as evidence either that some households lacked sufficient buffers of savings, or that households did not regard the shock as temporary. In addition, it was suggested that households – especially those at the lower end of the income spectrum who might quickly deplete their buffers of savings – could use any future increases in labour income to repair their balance sheets rather than spending more.
While private investment was expected to be hampered in the near term by higher energy costs, elevated uncertainty and reduced confidence, it was also being supported by AI-related investment. However, it was argued that there could be some downside risks to investment. In particular, the ongoing sequence of adverse supply shocks and persistent uncertainty might make firms think twice before investing, the closure of the Strait of Hormuz could constrain AI investment if the availability of helium became further impaired, and tightening credit conditions could weigh on investment more generally.
The labour market remained resilient and continued to support domestic demand, with additional jobs being created in the first quarter, although at a slower pace than in the last quarter of 2025. While labour demand had cooled further and firms and households expected the labour market to weaken, it was pointed out that there was still more confidence in employment prospects than had been the case before the pandemic. Unemployment also remained close to historical lows, with the June staff projections seeing a further decline in the unemployment rate – from 6.3% to 5.9%. It was argued that this could indicate a further tightening of the labour market. However, there was also a risk that employment would not remain as resilient following this shock as had been the case following the 2022 shock, because firms might be less inclined to hoard labour this time and might instead use the opportunity to substitute AI for labour.
Turning to fiscal policy, it was noted that, while much smaller than during the 2022 energy shock, recently introduced energy-related fiscal support measures were helping to cushion the effect of the current shock on the economy, although the effect of these measures might be dampened by increased VAT revenues from higher energy prices. More generally, part of the expected resilience of the euro area economy could be attributed to public investment linked to greater spending on defence and infrastructure, especially in view of the German fiscal package announced in March 2025, and to the Next Generation EU programme, which was a major source of funding that was not dependent on the economic cycle. The recent European Commission proposal to grant limited additional fiscal leeway under the national escape clause for defence expenditure in relation to projects supporting energy resilience and transition could also pose an upside risk to growth if it led to additional fiscal spending. At the same time, it was warned that fiscal policy was already relatively loose. Since fiscal sustainability was a crucial anchor for broader economic stability, it was vital to maintain sound public finances. In this context, fiscal responses to the energy price shock should be temporary, targeted and tailored, as emphasised in the European Commission’s 2026 European Semester Spring Package.
Regarding structural policies, there was an urgent need to strengthen the euro area economy. Reforms to enhance the euro area’s growth potential and accelerate the energy transition to reduce reliance on fossil fuels were more vital than ever. Completing the savings and investments union was key to funding innovation, supporting the green and digital transitions, and improving productivity. The digital euro and tokenised wholesale central bank money would enhance Europe’s strategic autonomy, competitiveness and financial integration, and would boost innovation in payments. It was thus essential to swiftly adopt the Regulation on the establishment of the digital euro. Simplifying and harmonising rules across the EU’s Single Market would help European firms grow faster.
Against this background, members assessed that the risks to the growth outlook were to the downside, mainly owing to the war in the Middle East, which had added to the volatile global policy environment. Prolonged disruption of energy supplies could increase energy prices further and for longer than currently expected. These factors would erode real incomes even more and make firms and households more reluctant to invest and spend. The drag on growth would intensify if the closure of major shipping routes were to cause acute shortages of key inputs that forced euro area firms to curtail output. A worsening of global financial market sentiment or a tighter supply of credit could dampen demand. Additional frictions in international trade could also further disrupt supply chains, reduce exports and weaken consumption and investment. Other geopolitical tensions, in particular Russia’s unjustified war against Ukraine, remained a major source of uncertainty. By contrast, growth could turn out to be higher if the economy and energy markets were to adapt more quickly than expected to the disruption caused by the war in the Middle East or if the war was resolved promptly and sustainably. Moreover, planned defence and infrastructure spending, reforms to enhance productivity and euro area firms adopting new technologies might drive up growth by more than expected. A deeper integration of the Single Market could also boost growth beyond current expectations.
With regard to price developments, members concurred with the assessment presented by Mr Lane in his introduction. Incoming data since the April meeting were seen as confirming a less favourable inflation assessment than had been anticipated at that time and as validating previous concerns that the energy shock would prove to be more persistent than previously expected. While inflation still appeared to be mostly driven by developments in energy-related sectors, an important change since April had been the increasingly visible and broadening materialisation of indirect effects into services and non-energy industrial goods inflation.
Inflation had risen to 3.2% in May, its third consecutive month above the 2% target, with energy price inflation being the main driver. However, the outcome for energy price inflation in May had been somewhat weaker than expected, and a question was raised as to whether this reflected the recently introduced temporary fiscal compensation measures or other more persistent factors. In this regard, distinctions had to be made between oil, gas and electricity. Natural gas had been less affected than oil by the conflict in the Middle East, while electricity prices had not yet been affected much. This might have been because the sensitivity of electricity prices to developments in natural gas prices had weakened owing to the larger share of renewable energy production in the energy mix, as well as nuclear power generation capacity in several countries. Although food price inflation had fallen to 2.0% in May, from 2.4% in April, it was still considered an important channel through which the energy shock could broaden across the consumption basket.
Inflation excluding energy and food had picked up to 2.5% in May, from 2.2% in April, surprising to the upside. This had been driven by both higher non-energy industrial goods inflation and a surprisingly large rise in services inflation. The increase in non-energy industrial goods inflation was seen as a sign of strengthening indirect effects from energy price increases. Supply chain pressures were also increasing, driven by longer delivery times, as indicated by the latest PMI data, and rising backlogs of orders. Pipeline pressures and producer prices were picking up around the world and the global supply chain pressure index had reached its highest level since 2022. The global character of the shock was also reversing the previous trend of imported disinflation, with prices for imports from China also expected to fall at a slower pace than previously. Regarding services inflation, it was argued that the rise from 3.0% in April to 3.5% in May was concerning, given the heavy weight of services in the consumption basket and their strong link to domestic cost conditions. The experience following the 2022 shock had shown that services inflation tended to react with a significant lag but might then prove to be very persistent, in part reflecting stronger wage growth. All of this implied that the surprise rise in services inflation could raise questions about the speed at which inflation would converge to the 2% target. However, it remained to be seen to what extent the latest rise in services inflation reflected temporary factors, such as the cost of package holidays in Germany and concert-related hotel prices in the Netherlands, or whether it could be considered more persistent, reflecting the first signs of the pass-through of energy prices and stronger than expected indirect effects.
With the energy shock proving more persistent than had been envisaged at the time of the March and April meetings, and indirect effects starting to become increasingly visible and broad-based, the inflation outlook had deteriorated further. In the baseline of the new June staff projections, headline inflation was now expected to average 3.0% in 2026, 2.3% in 2027 and 2.0% in 2028, while inflation excluding energy and food was expected to average 2.5% in 2026 and 2027, and 2.2% in 2028. Compared with the March projections, staff had revised up their baseline projection for inflation in 2026 and 2027 owing to a higher path for energy prices, which, to some extent, was expected to feed into food, goods and services inflation. In particular, non-energy industrial goods inflation was now projected to rise significantly over the coming quarters, whereas services inflation was projected to decline much more gradually than previously foreseen. Both developments were putting upward pressure on core inflation. While the main driver of higher inflation remained the sustained rise in oil prices linked to the conflict in the Middle East and the closure or disruption of key supply routes, the upward revision to non-energy inflation in the projections was seen as indicating that the indirect effects of the oil price shock were wider and more persistent than had been previously assessed.
There was considerable discussion about the direct effects, indirect effects and possible second-round effects of the energy shock. Direct effects had occurred rapidly, mainly through higher fuel and energy prices. However, indirect effects were now increasingly visible from the pass-through of higher energy prices to the prices of refined oil products, plastics, fertilisers, transportation and imports. It was noted that the staff baseline projections incorporated sizeable indirect effects, which were reflected in the upward movement in food inflation and non-energy industrial goods inflation. While it was indisputable that indirect effects would occur, it was key to monitor whether they were stronger or weaker than expected. Conversely, it was generally agreed that second-round effects were not yet observed in the data, although it was suggested that the risks of such effects were rising as the duration of the shock increased. In this context, it was noted that memories of the 2022 high-inflation episode could make households and firms react more quickly than in the past, increasing the risk that price-setting and wage-bargaining behaviour would adjust.
Domestic cost pressures had eased in the first quarter, supported by slower growth in wages and profits. The ECB wage tracker and surveys on wage expectations continued to indicate that wage growth should ease over the year, and projected growth in compensation per employee in 2026 had been revised down in the June staff projections. Overall, there was no evidence so far of second-round effects via higher wage growth. However, it was observed that wages adjusted with a significant lag and were therefore an imperfect real-time indicator, while it seemed likely that upcoming wage negotiations would incorporate considerations related to purchasing power. It was also suggested that a more structural tightening of the labour market over time, including on account of demographic changes, could exert upward pressure on wage growth and services inflation, although this was unlikely to be a near-term concern.
Inflation expectations for shorter horizons had moved up, as reflected in surveys of both experts and households. It was highlighted that consumers’ inflation expectations remained elevated across all horizons and that the distribution of expectations had shifted to the right. It was also suggested that if the rise in short-term inflation expectations were prolonged and left unchecked it could spill over into medium and longer-term inflation expectations, especially of firms and households. Therefore, it was important to carefully monitor the risk of a potential unanchoring of inflation expectations. At the same time, most measures of longer-term inflation expectations had been relatively stable and continued to stand at around 2%.
Against this background, members assessed that the risks to the inflation outlook were to the upside. If energy prices were to rise by more and for longer than currently expected, euro area inflation would increase further. This could be reinforced and become more persistent if higher energy prices were to spill over by more than expected to other prices and to wages, if longer-term inflation expectations were to rise in response, or if global supply chains were disrupted more broadly. Ongoing trade tensions could also give rise to more fragmented global supply chains, curtail the supply of critical raw materials and worsen capacity constraints in the euro area economy. Extreme weather events, and the unfolding climate and nature crises more broadly, could drive up food prices by more than expected. By contrast, inflation could turn out to be somewhat lower if the economic effects of the war in the Middle East proved to be more short-lived than currently expected or if indirect or second-round effects proved less pronounced than anticipated. More volatile and risk-averse financial markets could weigh on demand and thereby lower inflation as well.
Members considered that, in view of the ongoing elevated uncertainty, supplementing the staff baseline projections and the regular risk assessment with alternative illustrative scenarios was informative to give an indication of the broad range of possible outcomes for inflation and growth. Under the adverse and severe scenarios, headline and core inflation would both be significantly above 2% over the entire projection horizon, with the implications for medium-term inflation depending crucially on the scale of indirect and second-round effects of a stronger and more persistent energy shock, but also on the possibility of physical shortages of oil and severe supply chain disruptions. Conversely, under the milder scenario, inflation would peak at a level similar to that foreseen in the baseline in the short term but would fall below target in the medium term.
Members agreed that the scenarios should be seen as complementary to the baseline projections in terms of informing the policy discussion, while they were also useful for narrative and communication purposes. However, there was debate about the design of the scenarios and the likelihood of their materialisation. The switch to constructing the various scenarios on the basis of market-implied future price paths, notably for oil and gas prices in various parts of the distribution, was broadly welcomed as being objective, transparent and helpful for facilitating communication. Although it was noted that oil futures were often poor predictors of future realised spot prices and that current market pricing and option-implied distributions might not fully reflect the real economic impact and risks associated with the conflict, especially in relation to physical shortages, bottlenecks, depletion of inventories and second-round effects, there was no clearly superior, objective alternative. Nevertheless, it was questioned whether using scenarios based on market-implied probabilities of price outcomes was the correct approach to take, given that the related narrative underpinning the scenarios might be less clear and given that current uncertainties in oil markets were primarily on the physical side, and the mapping from these possible physical outcomes to possible price outcomes was surrounded by a considerable degree of uncertainty.
While it was generally considered that the risks to energy prices were to the upside and that the adverse scenario was more likely than the milder scenario, a few members suggested that the adverse scenario could potentially be more likely than the baseline. In this context, it was pointed out that energy prices exhibited backwardation – a negative slope – from late 2026 in all scenarios and were also expected to fall well below current levels by the end of the projection horizon in all but the severe scenario, which suggested that market expectations might be overconfident, especially for the upper part of the distribution. Consistent with this, it was highlighted that information from other sources, such as think tanks and Polymarket, appeared less optimistic than the option-implied distributions for oil prices. At the same time, it was suggested that the severe scenario was now very unlikely, given how the oil market had managed the disruption for over three months. In addition, it was noted that episodes of heightened tensions in energy markets over the last three months had often been followed quite quickly by de-escalation of the conflict or by peace talks. Moreover, a feature common across all the scenarios, including the milder scenario, was that oil prices remained higher than pre-war expectations even at the end of the projection horizon. This meant that, unless a very mild scenario materialised, oil prices would probably be significantly higher over the next two years than had been expected before the war, and this still represented a large shock.
Turning to the monetary and financial analysis, members broadly concurred with the assessment provided by Ms Schnabel and Mr Lane in their introductions. Financial markets were now expecting around three 25 basis point interest rate hikes overall, with one hike fully priced in for the June Governing Council meeting and another for the September meeting. At the same time, since the start of the war in the Middle East the sharp increase in shorter-term inflation expectations had lowered real short-term interest rates and made current policy rates more accommodative, even though there had been no deliberate policy easing.
Overall, financial conditions were broadly unchanged since the Governing Council’s previous monetary policy meeting, but they remained tighter than before the war. However, the tightening effect of higher policy rate expectations had been counteracted by an easing impulse from risk asset markets. While continuing to exhibit volatility, risk asset markets remained buoyant overall, as was evident in compressed bond spreads and stretched equity valuations, especially in the United States. Indeed, the AI boom meant that US equity markets had sometimes appeared to behave as if there were no war, with valuation multiples in some segments suggesting fragilities. In this context, there were continued and possibly rising risks of a sharp correction in financial markets and an abrupt tightening in global financial conditions. This could be triggered by fading optimism about AI, especially given the circular phenomenon whereby expectations of higher dividends and profits could drive up valuations, which could in turn generate expectations of further increases in dividends and profits, and given that the limited network of companies involved were often one another’s clients, suppliers and investors. A market correction could also be triggered if the increase in global inflation – possibly amplified by renewed escalation of the war in the Middle East – induced global central banks to pursue tighter than expected monetary policy.
A sudden, sharp drop in asset prices, potentially amplified by the non-bank financial sector, which exhibited vulnerabilities, and by deteriorating asset quality, particularly in energy and trade-sensitive sectors, would also pose risks to financial stability. These risks were increasing the longer the current geopolitical conflicts lasted. However, euro area banks remained resilient, supported by strong capital and liquidity ratios, solid asset quality and robust profitability. More generally, macroprudential policy remained the first line of defence against the build-up of financial vulnerabilities, enhancing resilience and preserving macroprudential space. In this context, members assessed that there was currently no conflict between financial stability considerations and monetary policy.
Regarding the financing conditions for households and firms, the cost of issuing market-based debt had risen to 4.0% in April, from 3.9% in March, while bank lending rates for firms had remained at 3.6% in April and mortgage rates at 3.4%. Corporate credit growth and mortgage loan growth had remained robust, with the annual growth rate of bank lending to firms increasing to 3.4% in April, from 3.2% in March, the growth rate of corporate bond issuance rising to 4.6%, and mortgage lending again growing by 3.0%. However, according to the latest bank lending survey for the euro area, credit standards for loans to firms had tightened in the first quarter of 2026. It was suggested that this would have a dampening impact on credit in the period ahead, at least for those sectors hit harder by the energy shock.
Monetary policy stance and policy considerations
Turning to the monetary policy stance, members assessed the data that had become available since the last monetary policy meeting in accordance with the three main elements that the Governing Council had communicated in 2023, and updated in July 2025, as shaping its reaction function, namely: (i) the implications of the incoming economic and financial data for the inflation outlook and the risks surrounding it; (ii) the dynamics of underlying inflation; and (iii) the strength of monetary policy transmission.
Members largely agreed that the continuation of the conflict in the Middle East and the incoming data had led to a deterioration of the inflation outlook relative to both the outlook embedded in the March staff baseline projections and the outlook at the time of the previous monetary policy meeting in April. Headline inflation had risen significantly above target owing to the direct effects of the energy price shock and the fact that the shock was spreading into non-energy inflationary dynamics via increasingly visible and broad-based indirect effects. There were also clear signs of pipeline pressures, with producer prices rising globally and sharply increasing input prices translating, at least partly, into higher output prices, while short-term inflation expectations were becoming increasingly sensitive to the shock. Compared with the March projections, staff had revised up their baseline projection for inflation in 2026 and 2027, with above-target inflation more pronounced and persistent than previously envisaged owing to a higher path for energy prices, which was, to some extent, expected to feed into food, goods and services inflation. Headline inflation was set to rise further over the summer and remain well above target into the first half of 2027, despite almost three 25 basis point interest rate hikes being embedded in the projections. It was then expected to return to target in the second half of 2027, supported by falling energy prices and slower increases in other prices, but also partly by base effects. By contrast, inflation excluding energy and food was projected to remain above 2% until the end of the projection horizon.
The staff baseline projections were subject to substantial uncertainty owing to the war in the Middle East. This uncertainty was also reflected in the broad range of outcomes for inflation and growth in the updated illustrative scenarios put together by Eurosystem staff. The full implications of the war for medium-term inflation and growth would depend on the intensity and duration of the energy price shock, as well as the scale of its indirect and second-round effects. The longer energy prices stayed high, the more likely they were to drive up broader inflation through indirect and second-round effects. Such dynamics would raise the risk of the energy shock becoming embedded in underlying inflation and in medium and longer-term inflation expectations. Still, second-round effects had not yet been seen. In addition, while inflation expectations over shorter horizons remained well above levels before the outbreak of the war in the Middle East, the credibility of the ECB’s commitment to price stability remained solid, with medium and longer-term inflation expectations remaining broadly anchored. Most measures of longer-term inflation expectations stood at around 2%, supporting the stabilisation of inflation around target in the medium term.
All members viewed the risks surrounding the inflation outlook as being to the upside relative to the staff baseline projections, with the evolution of the conflict in the Middle East being the key source of risk. If energy prices were to rise by more and for longer than currently expected, euro area inflation would increase further. In this context, it was noted that the return of inflation to target in the staff baseline projections was predicated on the fairly pronounced decline in oil and other energy prices from current levels implied by the shape of energy futures curves. This strong backwardation reinforced the large negative base effects that would automatically push inflation down once high past price increases dropped out of the annual calculation, whereas core inflation was expected to remain above 2% for the entire projection horizon. Therefore, if energy prices did not decline as implied by the futures curves, above-target inflation was likely to prove considerably more persistent. Moreover, relying on energy price developments for inflation to return to target was seen as risky given ongoing geopolitical tensions, recent market volatility and uncertainty as to whether energy supply risks and the possibility of physical shortages were sufficiently reflected in market prices.
Inflationary risks from energy prices could be reinforced and become more persistent if higher energy prices were to spill over by more than expected to other prices and to wages, if longer-term inflation expectations were to rise in response, or if global supply chains were disrupted more broadly. Recent price signals from PMIs and growing prospects of supply bottlenecks were a concern in this regard. In this context, it was argued that, given the size of the shock, pass-through could be non-linear even under the baseline, with the likelihood and strength of non-linearities increasing with the duration of the conflict. Additional fiscal spending on energy resilience and the energy transition in light of additional flexibility under the national escape clause for defence expenditure, as recently proposed by the European Commission, posed another upside risk to inflation. More broadly, there remained a continuing risk that ongoing trade tensions could give rise to more fragmented global supply chains, curtail the supply of critical raw materials and worsen capacity constraints in the euro area economy. Finally, extreme weather events, and the unfolding climate and nature crises more broadly, could drive up food prices by more than expected, especially given the risk of a “super” El Niño.
At the same time, inflation could turn out to be somewhat lower if the economic effects of the war in the Middle East proved to be more short-lived than currently expected or if indirect or second-round effects proved less pronounced than anticipated. In this context, it was argued that demand remained relatively weak, which might limit the ability of firms to pass on higher energy costs to final product prices and reduce the intensity of indirect and second-round effects. However, it was also argued that rising input and output prices, as well as surging selling price expectations, suggested that the weakening of the economy in response to the energy shock was probably insufficient to bring inflation back to target over the medium term, especially as incentives for firms to pass cost increases on to consumer prices were likely to become stronger as profit margins were eroded. In addition, the staff baseline growth projection had not been revised down by much, and it was suggested that this implied that the downside risks to growth were more limited than the upside risks to inflation. The relatively flat slope of the Phillips curve – which was influenced by the relative inflexibility of the euro area economy – also implied that lower growth was unlikely to be sufficient to bring inflation back down to target.
In this context, members discussed how the current environment compared to the situation at the time of the energy shock triggered by Russia’s invasion of Ukraine in 2022, after which significant second-round effects and non-linearities had come into play. So far, the magnitude of the current shock was still smaller than the overall sequence of inflationary shocks experienced in late 2021 and early 2022, although the global nature of the energy shock this time, in contrast to the relatively contained regional disturbance of 2022, raised the risk of larger indirect effects through import prices and along global value chains. The economic backdrop was also now quite different from the situation in 2022. The energy shock then had occurred in the context of strong pent-up demand after the post-pandemic reopening, whereas the economy was currently experiencing more subdued growth amid relatively weaker demand conditions. The current composition of demand was also different, as the services component that had made inflation so persistent in the previous cycle was not the main driver on this occasion. In addition, the fiscal reaction to the current shock and associated demand impetus was much smaller than it had been in 2022, and monetary policy had been highly accommodative prior to the shock in 2022, whereas it had been broadly neutral entering the current shock. Finally, notwithstanding some pressures, global supply chain bottlenecks remained much more contained on this occasion. These factors all suggested that the effects of the current shock would be more short-lived than those of the previous episode. Still, it was important to remain vigilant. This was especially the case because the 2022 inflation episode was still fresh in the memories of both households and firms. Therefore, more attention was likely to be paid to price rises now than at the time of the previous energy shock, and this could mean that firms and workers might react more quickly on this occasion.
Turning to underlying inflation, some indicators had already been driven higher by the energy shock. Core inflation had risen. Following an upward revision in the June staff projections, it was now projected to remain above 2% for the entire projection horizon and exceed 2.5% for a significant period, despite the policy tightening embedded in the projections. It was also suggested that risks to the outlook for core inflation were tilted to the upside. More generally, the limited other available measures of underlying inflation had all increased in May, and the April PCCI, which was often seen as the most reliable indicator, also pointed to upside risks. It was suggested that the evolution of underlying inflation dynamics was indicative of persistent rather than temporary underlying price pressures and therefore a cause for concern. Moreover, it was argued that underlying inflation measures – including core inflation – were particularly relevant from the current policy perspective since they could be seen as the main “attractor” for headline inflation over the medium term and also reflected the spillovers from energy prices to broader inflation dynamics. In this vein, it was suggested that it would be misleading to look at current headline inflation in isolation, given that its projected future path depended heavily on the shape of the energy futures curve and it was also expected to be brought down later in the projection horizon by large negative base effects. At the same time, it was argued that underlying inflation, while very relevant for monetary policy, was not the same concept as medium-term inflation since underlying inflation measures were most pertinent to inflation dynamics one year ahead. Core inflation and non-energy inflation were expected to peak in 2027 and then decline. Therefore, the rise in underlying inflation could be viewed as only reflecting a lagged adjustment to the original shock, which did not preclude inflation from returning to target in the medium term, assuming sufficient monetary policy action. There was also no evidence so far of the energy shock translating into higher wage growth, with recent wage developments and the outlook for wages both being consistent with inflation at target over the medium term. It was suggested that recent indicators of wage growth had been less responsive to recent developments than previously expected and that future wage claims could be moderated by a cooling labour market and threats to employment from AI. This could imply that the risk of second-round effects via wages was lower than thought. However, wages only adjusted with a significant lag. With the labour market still relatively resilient, it was argued that, over time, workers could seek to recoup lost purchasing power, potentially negotiating more forcefully this time given their previous experience after the 2022 energy shock. This could create an upside risk to wage growth. It was also becoming more expensive for firms to source other inputs, and they therefore expected to put up their selling prices. From this perspective, it was argued that the risk of second-round effects remained on the horizon.
Finally, the transmission of monetary policy continued to be smooth and effective. Monetary policy had been broadly neutral for the past year. However, in 2025 the final residual drag from the earlier tightening cycle had continued to exert downward pressure on economic activity. Therefore, the resilience of the economy so far this year partly reflected the policy support associated with the removal of that headwind. The dampening effect from the tighter financial conditions since the outbreak of the war had been limited so far, with credit growth remaining robust. Looking ahead, however, it was suggested that the recent rise in long-term interest rates and tightening of bank lending standards would lower credit demand, weigh on investment and weaken economic momentum, thereby generating a disinflationary impulse over the medium term. It was also observed that, while bank-based transmission appeared to be working well, market-based transmission was affected by investor risk appetite, which could swing rapidly. Against this backdrop, a tighter supply of credit or a worsening of global financial market sentiment associated with more volatile and risk-averse financial markets could weigh on demand and thereby pose a downside risk to both growth and inflation.
Monetary policy decisions and communication
Against this background, all members supported the proposal made by Mr Lane to raise the three key ECB interest rates by 25 basis points. This was in line with the Governing Council’s commitment to setting monetary policy to ensure that inflation stabilised at the 2% target in the medium term. The war in the Middle East was generating inflation pressures. Higher inflation on account of the persistent energy price shock was no longer merely forecast but had already materialised, with the incoming data now also signalling increasingly visible and broad-based indirect effects on non-energy inflation. Further indirect effects were in the pipeline, pointing to more broadening of inflationary pressures across the economy, and second-round effects remained a clear possibility, with their likelihood increasing the longer the energy shock persisted. The inflation outlook had deteriorated, with the staff baseline projections for inflation revised up, such that above-target inflation was projected to be more pronounced and persistent than had been previously envisaged, and core inflation was now expected to remain above 2% for the entire projection horizon.
While uncertainty remained very high, especially in relation to the duration of the energy shock, it was now clearer than in April that the conflict and associated shock were persistent. There was also a greater understanding of the consequences of the shock, in part because of the full analysis of the outlook and surrounding risks that was possible in the context of the staff projection exercise. In addition, despite the upward revision to the inflation outlook, risks were still to the upside. Overall, it was now clear that the current situation no longer qualified as a case for looking through the shock. Therefore, the option value of waiting for further information had diminished considerably since the previous meeting. Instead, monetary policy now had to react to the information that was available and, in particular, to the projected deviation of inflation from the 2% target over the medium term as the energy price shock spread to other parts of the consumption basket. Such action should help to contain indirect effects and risks of second-round effects from the energy shock. In addition, it should support the credibility of the ECB’s price stability commitment, especially in the face of high and rising short-term inflation expectations, and ensure that medium and longer-term inflation expectations remained well anchored, also in view of market participants’ understanding of the Governing Council’s reaction function. There was also currently no conflict between financial stability considerations and monetary policy. Raising interest rates by 25 basis points at this time was consistent with the strategy of a measured adjustment of policy in response to a supply shock generating a large though not too persistent overshoot of the inflation target. Such a move would continue to leave the Governing Council well positioned to navigate the uncertainty caused by the war, evaluate the upcoming data and maintain flexibility for future meetings.
The decision was also robust across a range of scenarios mapping out how the shock might evolve and affect the medium-term outlook for the euro area. In all scenarios, inflation would exceed the target over the medium term in the absence of tighter monetary policy. Even under a milder scenario with less elevated energy prices – which might emerge if the conflict was resolved promptly and sustainably – a significant portion of the inflationary damage from the shock would already have worked its way into the broader economy. In particular, supply chain disruptions, higher production costs and firm-level price adjustments would not simply or quickly reverse with the resolution of the conflict. Therefore, hiking interest rates at the current juncture would be appropriate even under the milder scenario, implying that under no scenario considered in the projection exercise would maintaining the deposit facility rate at 2% in June be appropriate.
Given these considerations, while a hike could have been seen as precautionary had it been decided at the Governing Council’s monetary policy meetings in March or April, the current adjustment should not be seen as an insurance hike but rather as a decision that was robust across the baseline outlook and the full range of alternative scenarios, supported by a thorough assessment. This also meant that it was helpful to demonstrate this robustness by publishing the milder scenario alongside the adverse and severe scenarios so that it was clear that the policy decision was robust across all scenarios and that the Governing Council had assessed how its policy decision would fare under a milder scenario.
In this context, members discussed how the current environment compared to the situation in 2011, when the ECB had raised interest rates in April and July before subsequently reversing course in November and December. Since that time, the Governing Council had reviewed its monetary policy strategy twice and learnt lessons both from that episode and from a range of different shocks. It was observed that the key difference now was that, notwithstanding some financial stability risks such as those related to stretched valuations in financial markets, there were currently no tangible signs of unfolding financial stress and associated recessionary risks, whereas the interest rate hikes in 2011 had come at a time when the euro area sovereign debt crisis was in full swing. More generally, the lesson from 2011 was not that the Governing Council should never increase interest rates when financial stability risks were present, but rather it should avoid pre-committing in relation to future policy decisions. Hiking interest rates by 25 basis points at the current meeting while continuing to monitor financial stability risks and maintaining the data-dependent and meeting-by-meeting approach was seen as consistent with these lessons.
With regard to communication, members reiterated that the Governing Council’s future interest rate decisions would continue to be based on its assessment of the inflation outlook and the risks surrounding it, in light of the incoming economic and financial data, as well as the dynamics of underlying inflation and the strength of monetary policy transmission. The Governing Council would also continue to follow a data-dependent and meeting-by-meeting approach to determining the appropriate monetary policy stance without pre-committing to a particular rate path.
Given the continuing high uncertainty, it was important to refrain from giving any guidance regarding the future interest rate path. Communication should remain neutral, neither suggesting that the current decision was the first of a sequence of hikes to come nor that it was a one-off move. Avoiding pre-commitment could help to cater effectively for different scenarios regarding the evolution of the shock. At the same time, continued vigilance was vital, and it was important to acknowledge that further rate hikes were embedded in the baseline projections. Therefore, it was important to communicate that the Governing Council was firmly committed to delivering 2% inflation over the medium term, was closely monitoring the situation, and remained agile and flexible to do whatever was necessary to respond to threats to the price stability objective. It was also noted that the combination of the Governing Council’s reaction function and the data-dependent and meeting-by-meeting approach was consistent with its monetary policy strategy for handling the highly uncertain economic environment. It had proved to be a robust approach that was well understood by market participants and had helped to deliver price stability following the inflation surge in 2022.
Looking ahead, the Governing Council would continue to carefully monitor the evolving situation and its data-dependent approach would help it to set monetary policy as appropriate to ensure that inflation stabilised sustainably at the medium-term target. The longer energy prices stayed high, the more likely they were to drive up broader inflation through indirect and second-round effects. It was therefore important to closely monitor the size and persistence of the energy price increase and how it was feeding through to price and wage-setting, inflation expectations and overall economic dynamics. Other key elements to monitor included potential physical shortages of energy and other commodities, the evolution of aggregate demand, developments in core and underlying inflation, the evolution of financial conditions – including to assess whether policy was being transmitted smoothly – and financial market developments, also in view of financial stability risks.
Taking into account the foregoing discussion among the members, upon a proposal by the President, the Governing Council took the monetary policy decisions as set out in the monetary policy press release. The members of the Governing Council subsequently finalised the monetary policy statement, which the President and the Vice-President would, as usual, deliver at the press conference following the Governing Council meeting.
Monetary policy statement
Monetary policy statement for the press conference of 11 June 2026
Press release
Meeting of the ECB’s Governing Council, 10-11 June 2026
Members
- Ms Lagarde, President
- Mr Vujčić, Vice-President
- Mr Cipollone
- Mr Demarco
- Mr Dolenc*
- Mr Elderson
- Mr Escrivá
- Mr Kaasik
- Mr Kazāks
- Mr Kažimír*
- Mr Kocher*
- Mr Lane
- Mr Makhlouf
- Mr Moulin
- Mr Nagel
- Mr Panetta*
- Mr Patsalides
- Mr Pereira*
- Mr Radev
- Mr Rehn*
- Mr Reinesch
- Ms Schnabel
- Mr Šimkus
- Mr Sleijpen
- Mr Stournaras
- Ms Švaljek, Deputy Governor of Hrvatska narodna banka
- Mr Wunsch
* Members not holding a voting right in June 2026 under Article 10.2 of the ESCB Statute.
Other attendees
- Ms Senkovic, Secretary, Director General Secretariat
- Mr Kamps, Acting Secretary for monetary policy, Acting Director General Monetary Policy
- Mr Kapadia, Head of Division, Directorate General Monetary Policy
Accompanying persons
- Ms Bénassy-Quéré
- Mr Dewachter
- Mr Horváth
- Mr Koukoularides
- Mr Kroes
- Mr López
- Mr Lünnemann
- Ms Mauderer
- Mr Nicoletti Altimari
- Mr Petriček
- Mr Randveer
- Ms Raposo
- Mr Reuter
- Mr Rutkaste
- Ms Schembri
- Mr Šošić
- Ms Tamoševičienė
- Mr Tavlas
- Mr Välimäki
Other ECB staff
- Mr Proissl, Director General Communications
- Ms Vansteenkiste, Counsellor to the President
- Ms Rahmouni-Rousseau, Director General Market Operations
- Mr Arce, Director General Economics
- Ms Nickel, Deputy Director General Economics
Release of the next monetary policy account foreseen on 27 August 2026.
EURGBP – Limited Correction to Precede Fresh Push Lower
EURGBP holds within narrow consolidation on Thursday after hitting new over one year low in strong bearish acceleration in past couple of sessions.
The pair is also on track for the third consecutive strong weekly loss, as Sterling continues to benefit from calmer political situation after resignation of PM Starmer (although still with a lot of uncertainty about potential new PM Burnham’s policies and cabinet members).
Strongly oversold conditions on daily chart suggest that bears may pause for consolidation / limited correction, as larger bears remain firmly in play.
Initial resistance lays at 0.8543 (broken Fibo 50% retracement of 0.8222/0.8865) and 0.8553 (broken 100WMA / weekly cloud base) with weekly close below these levels to reinforce broader bearish structure.
Stronger upticks, on the other hand, should stay capped under 0.8600 zone (falling 20DMA / former higher base) to provide better selling levels for fresh push lower.
Res: 0.8543; 0.8553; 0.8566; 0.8600
Sup: 0.8500; 0.8467; 0.8449; 0.8414
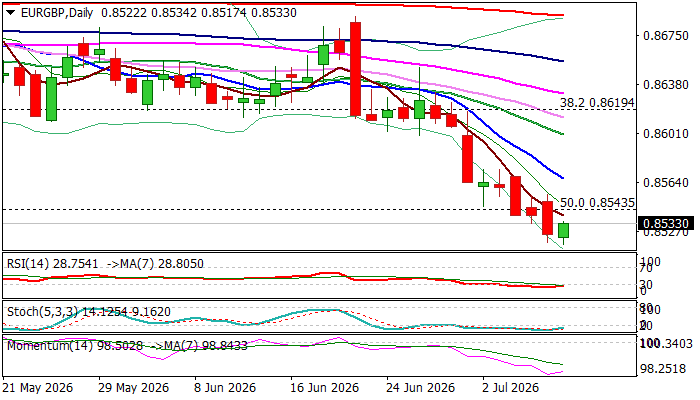
EUR/USD Daily Outlook
Range trading continues in EUR/USD and intraday bias stays neutral. With 1.1499 support turned resistance intact, further decline is expected. On the downside, break of 1.1323 will resume the fall from 1.2081 to 100% projection of 1.2081 to 1.1408 from 1.1848 at 1.1175. However, decisive break of 1.1499 will turn bias back to the upside for 55 D EMA (now at 1.1536) and above.
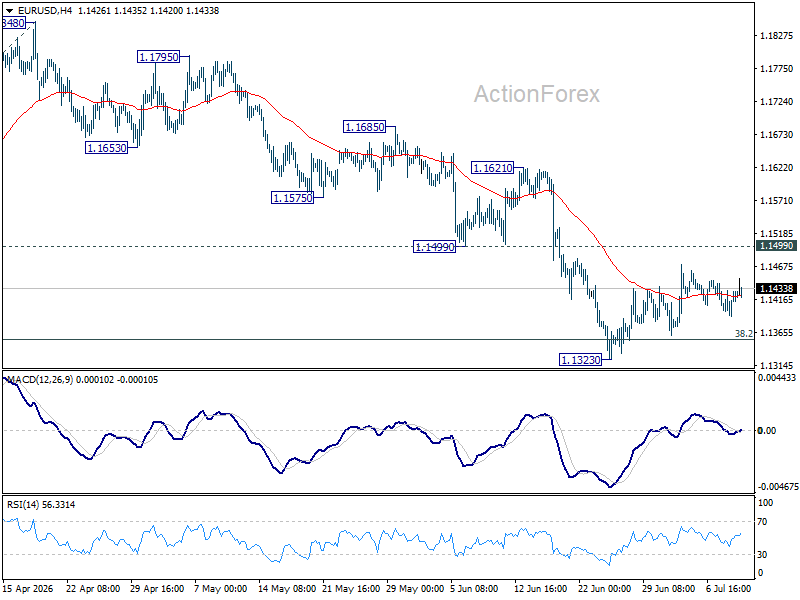
In the bigger picture, focus is back on 38.2% retracement of 1.0176 to 1.2081 at 1.1353. Decisive break there will revive the case of medium term bearish trend reversal after rejection by 1.2 key cluster resistance level. Further fall should be seen to 61.8% retracement at 1.0904. Nevertheless, strong rebound from 1.1353, followed by break of 1.1621 resistance, will retain medium term bullishness.
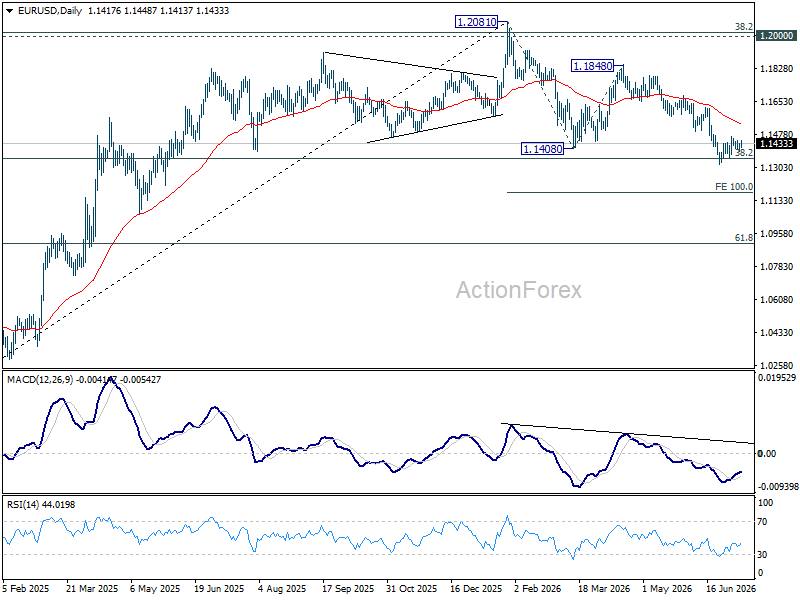
USD/JPY Daily Outlook
Range trading continues in USD/JPY and intraday bias stays neutral. More consolidations could be seen below 162.83. In case of another fall, downside should be contained by 38.2% retracement of 155.01 to 162.83 at 159.84. On the upside, firm break of 162.83 will resume larger up trend.
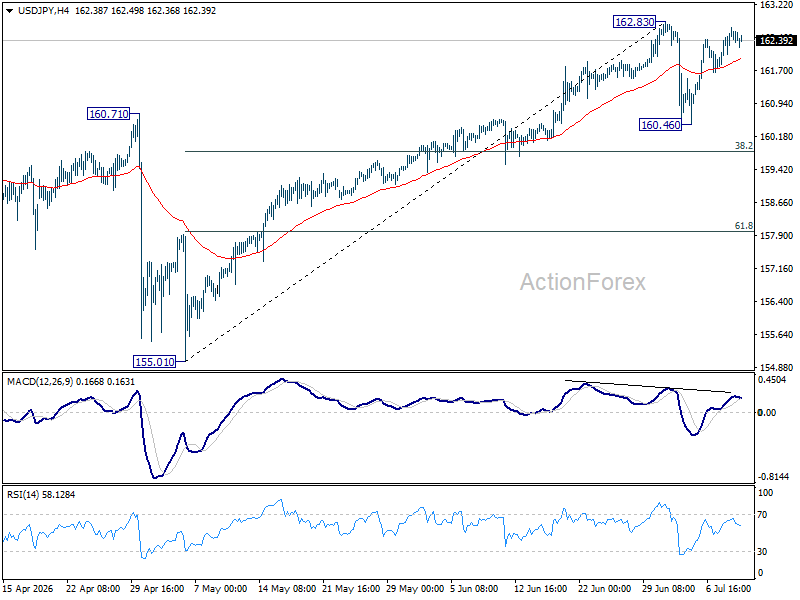
In the bigger picture, rise from 139.87 (2025 low) is seen as another rising leg of the long term up trend. Next target is 61.8% projection of 139.87 to 159.44 from 152.25 at 164.34. For now, outlook will remain bullish as long as 155.01 support holds, even in case of deep pullback.
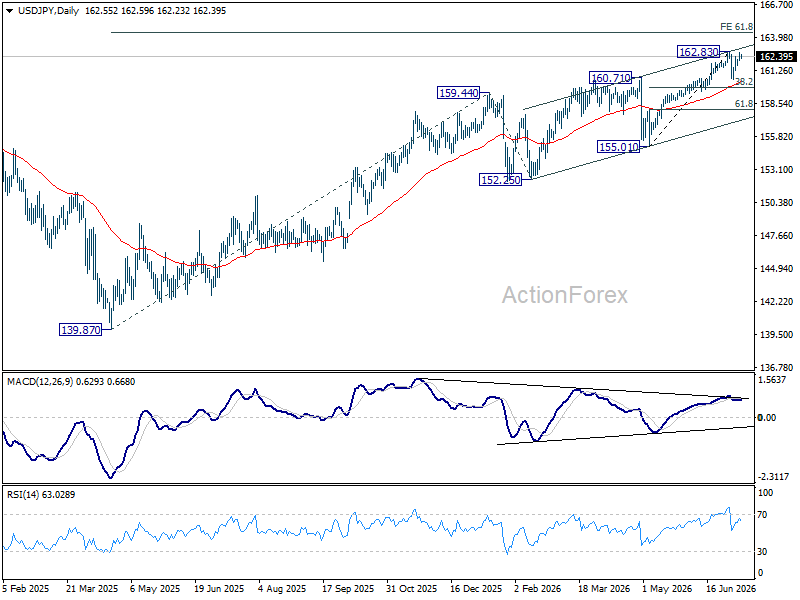
GBP/USD Daily Outlook
GBP/USD's rally from 1.3139 resumed after brief consolidations and intraday bias is back on the upside. Firm break of 1.3459 will argue that whole correction from 1.3867 has completed, and target 1.3657 resistance for confirmation. On the downside, below 1.3321 minor support will bias neutral again first.
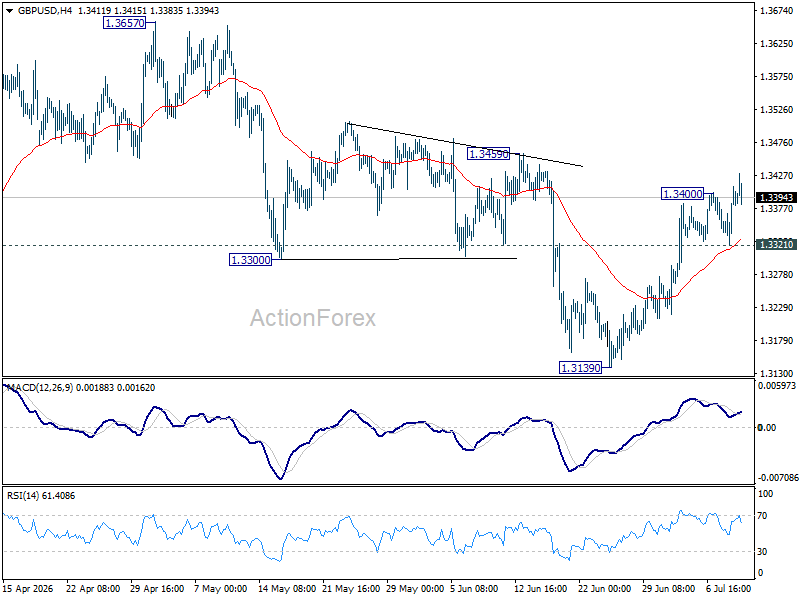
In the bigger picture, price actions from 1.3867 are a corrective pattern within the broader up trend from 1.0351 (2022 low). With 1.3008 support intact, medium term bullishness is maintained and break of 1.3867 is in favor for a later stage, towards 1.4248 key resistance (2021 high). However, firm break of 1.3008 will at least bring deeper fall to 38.2% retracement of 1.0351 to 1.3867 at 1.2524, with increased risk of bearish reversal.
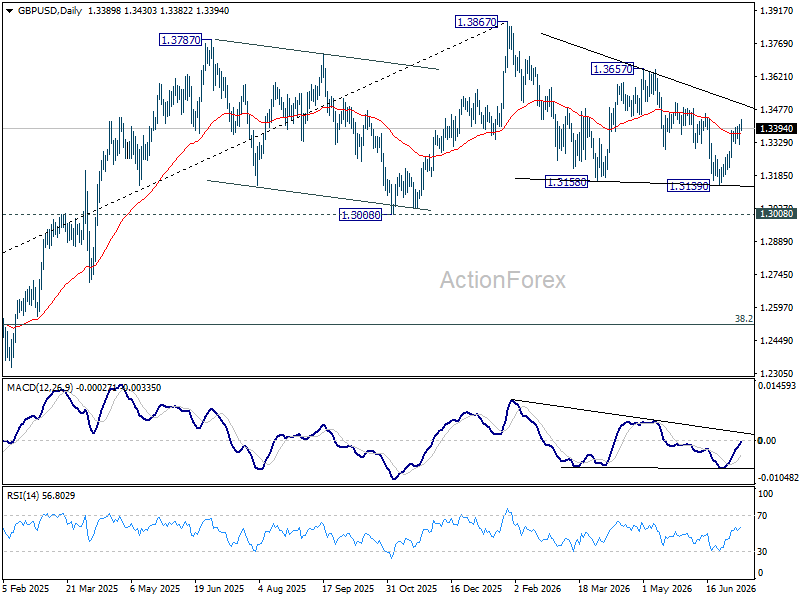
USD/CHF Daily Outlook
USD/CHF is staying in consolidations below 0.8139 and intraday bias remains neutral. Further rally is expected as long as 0.8009 support holds. Above 0.8139 will extend the rally from 0.7760 to 100% projection 0.7603 to 0.8041 from 0.7600 at 0.8198 next. However, sustained break of 0.8009 support will bring deeper fall 0.7909 support and below.
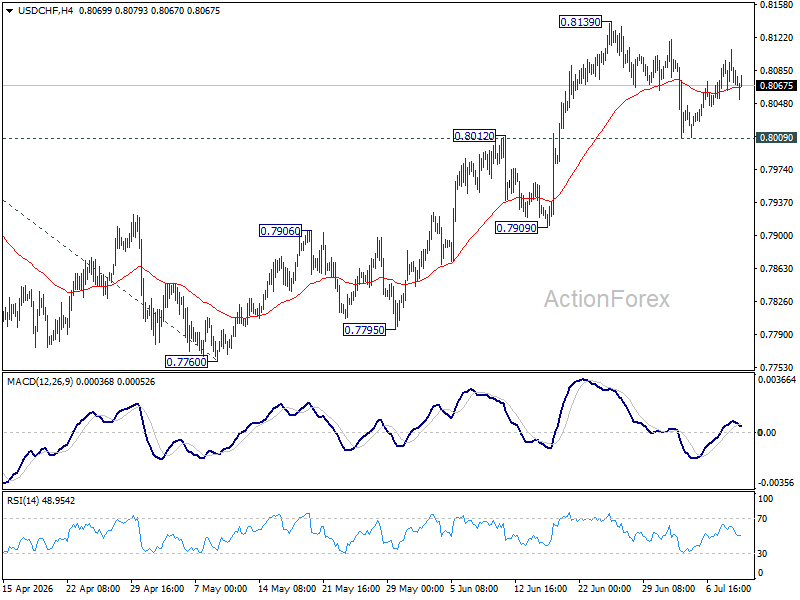
In the bigger picture, while a medium term bottom was formed at 0.7603, it's still early to call for bullish trend reversal. As long as 38.2% retracement of 0.9200 (2025 high) to 0.7603 at 0.8213 holds, the larger down trend could still continue through 0.7603 at a later stage. However, firm break of 0.7603 will argue that the trend has reversed and turn focus to 0.8332 support turned resistance (2023 low) for confirmation.
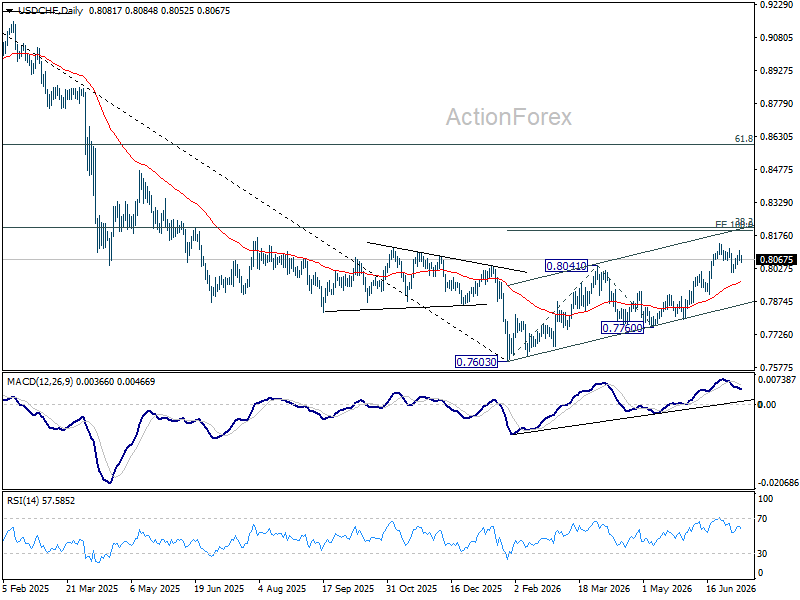
AUD/USD Daily Report
AUD/USD is staying in consolidations from 0.6864 ad intraday bias remains neutral. Further fall is expected as long as 0.6977 support turned resistance holds. Below 0.6864 will target 0.6832 support. Firm break there will target 0.6756 fibonacci level. However, sustained break of 0.6977 will bring stronger rebound to 0.7087 resistance instead.
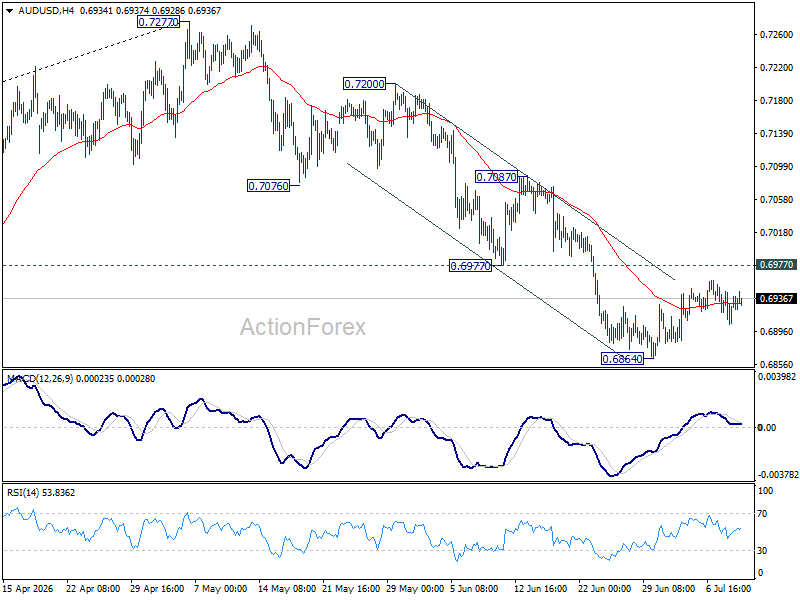
In the bigger picture, considering bearish divergence condition in D MACD, a medium term top could be formed at 0.7277 after failing to sustain above 61.8% retracement of 0.8006 (2021 high) to 0.5913 (2024 low) at 0.7206. Deeper fall could be seen to 38.2% retracement of 0.5913 to 0.7277 at 0.6756 as a correction. But strong support should be seen there to bring rebound. Consolidations would continue below 0.7277 for a while.
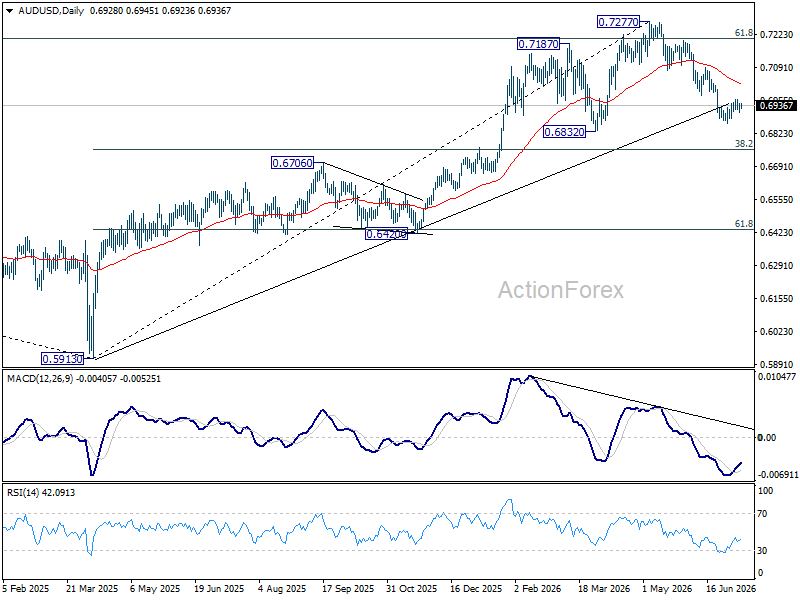
USD/CAD Daily Outlook
Consolidation continues below 1.4247 and intraday bias remains neutral in USD/CAD. Deeper pullback cannot be ruled out. But downside should be contained above 1.3965 resistance turned support. Above 1.4247 will resume the rally from 1.3480 to 61.8% retracement of 1.4791 to 1.3480 at 1.4290. Firm break there will pave the way back to 1.4791 high.
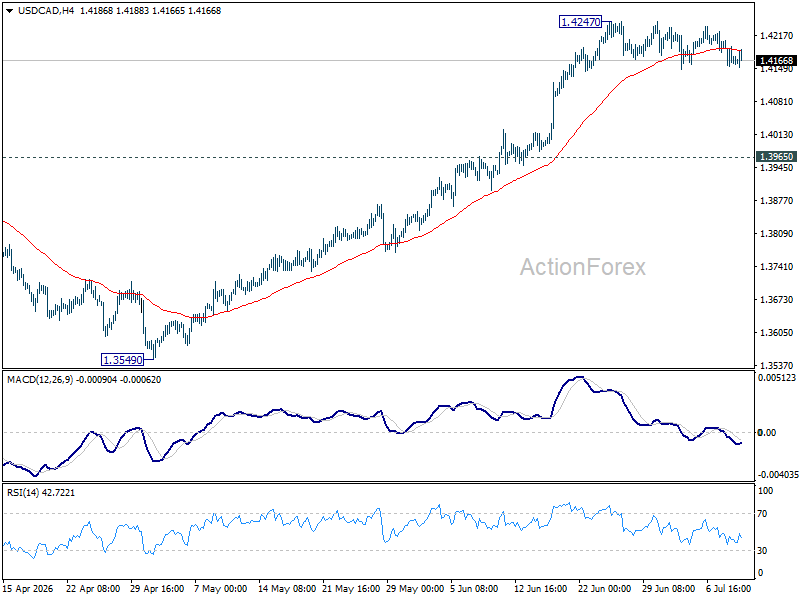
In the bigger picture, current development suggests that fall from 1.4791 has completed as a three wave correction to 1.3480. It's still early to judge if rise from there a corrective bounce, or resumption of the larger up trend from 1.2005 (2021 low). But in either case, retest of 1.4791 high should be seen next.
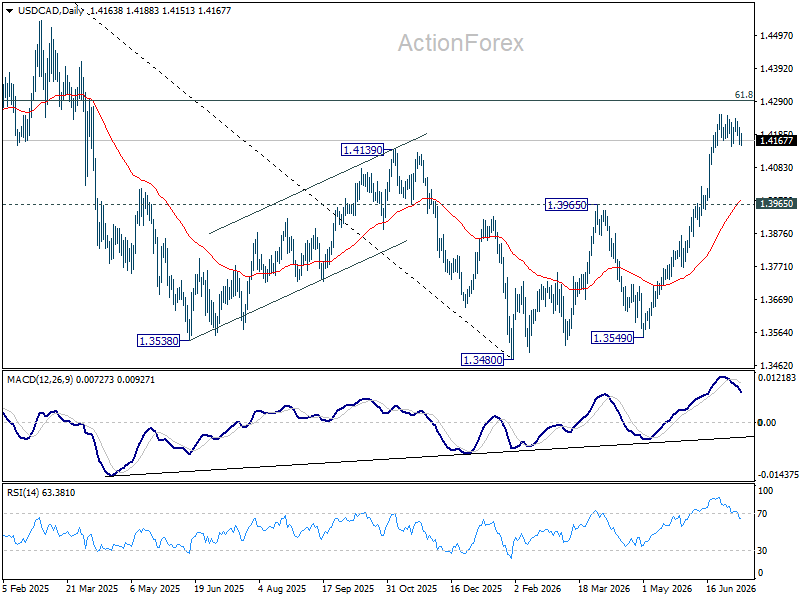
GBP/JPY Daily Outlook
GBP/JPY's rally resumed after brief consolidations and intraday bias is back on the upside. Current up trend should target 220.90 fibonacci projection level next. On the downside, below 216.34 minor support will turn intraday bias neutral again and bring consolidations, before staging another rally.
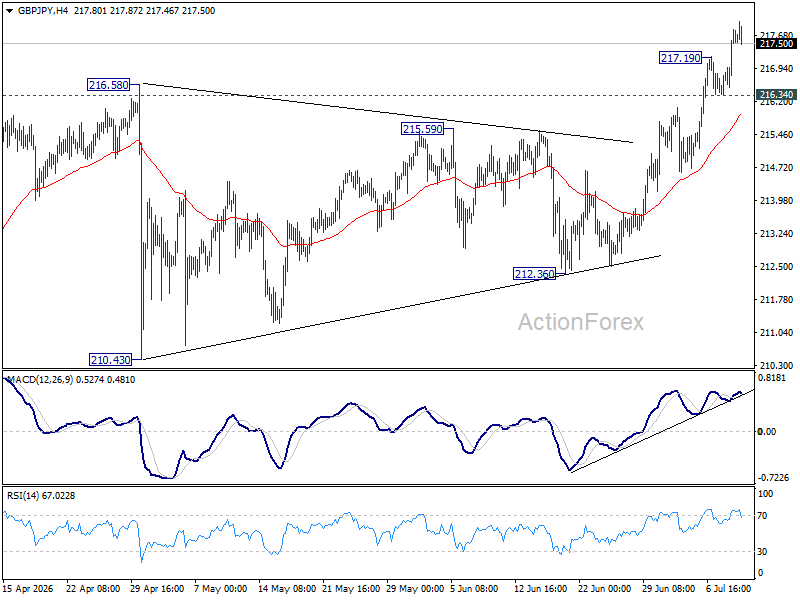
In the bigger picture, there is no clear sign of trend reversal yet. The long term up trend could still extend to 61.8% projection of 148.93 (2022 low) to 208.09 (2024 high) from 184.35 at 220.90 on resumption. However, sustained break of 55 W EMA (now at 207.89) will argue that it's already in medium term down trend for 184.35 support.