Sample Category Title
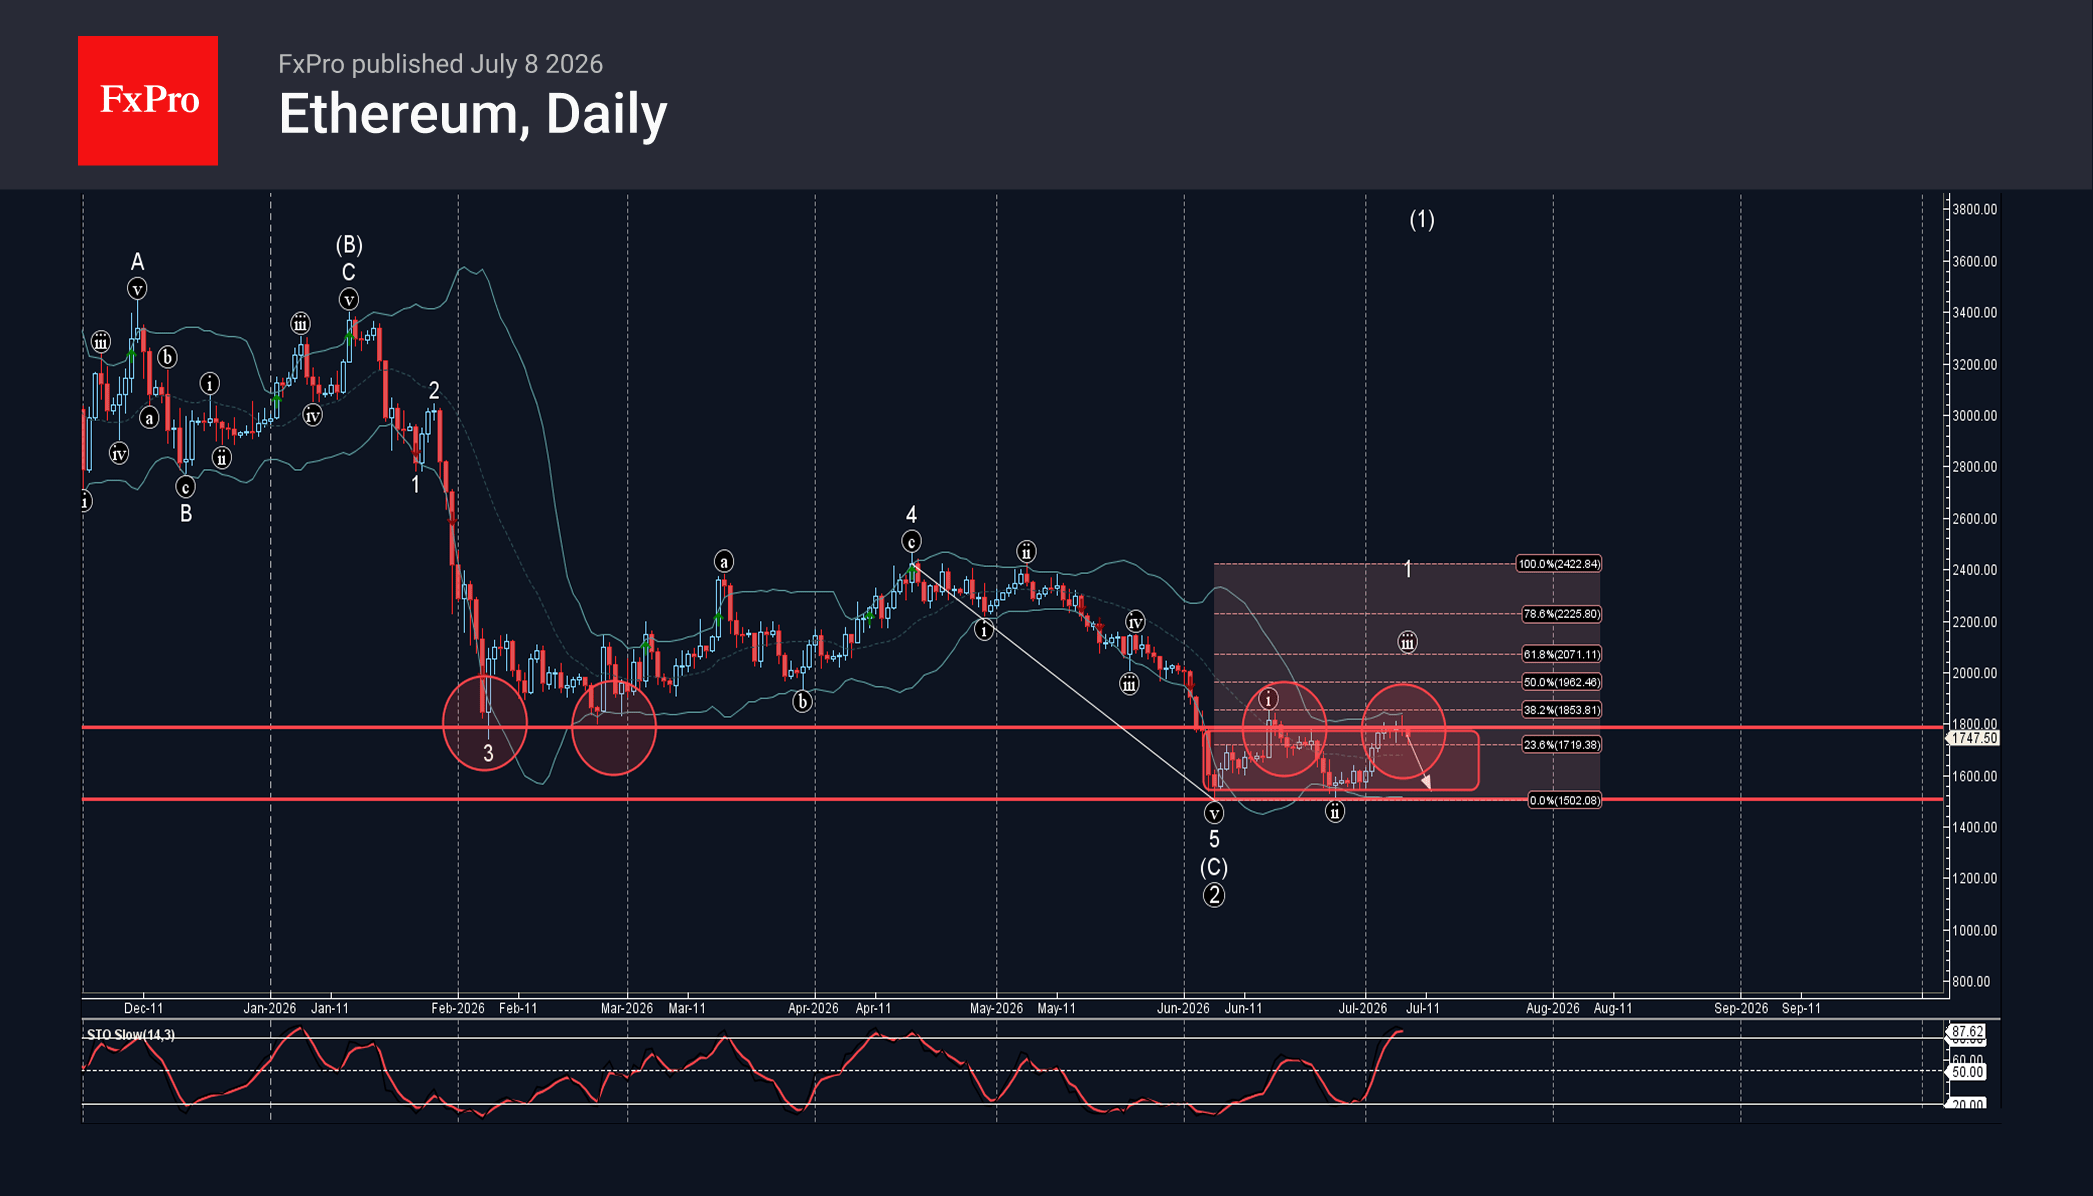
Ethereum Wave Analysis
Ethereum: ⬇️ Sell
– Ethereum reversed from resistance level 1800.00
– Likely to fall to support level 1500.00
Ethereum cryptocurrency recently reversed from the pivotal resistance level 1800.00 (former Double Bottom from February) intersecting with the upper daily Bollinger Band and the 38.2% Fibonacci correction of the downward impulse 5 from April.
The resistance level 1800.00 is also the upper boundary of the sideways price range inside which the pierce has been moving from June.
Given the clear daily downtrend and the overbought daily Stochastic, Ethereum cryptocurrency can be expected to fall further to the next support level 1500.00 – lower boundary of the active sideways price range.
Sunset Market Commentary
Markets
The US-Iranian ceasefire is not only under pressure, it is over. At least as far as president Trump is concerned. He told reporters during his trip to Ankara for a NATO summit that he wasted time dealing with the Iranians. Trump said his negotiators may keep talking if they want, keeping the door ajar still, but he "doesn't see it". The comments come after the US revoked a waiver of sanctions on Iranian oil sales and attacked several Iranian sites in response to the Middle East country targeting three commercial ships yesterday that didn't travel across the Iranian designated route. Markets reacted sharply. Oil prices had been bottoming out slowly early July and have shot up the last two days to $78.4 currently (Brent). It is reviving the inflationary spirits just after the recent oil drop had perhaps caused some complacency. It also serves as a stark reminder to central banks that vigilance remains warranted in an environment where things change in split seconds. For ECB's Nagel, the news means "we're back where we began." (Core) bonds sold off, particularly in Europe and at the front end of the curve. Money markets have pushed forward the timing for a second rate hike from December to October with September given a 85% implied probability currently. German yields rise 4.8 bps (30-yr) 8 bps (2-yr). The French 10-yr yield surpassed the previous peak to rally to a 2009 intraday high. While paring some gains afterwards it is still on track for the highest close since that year.
Political risks (RN's Le Pen eligible for presidential elections) are perhaps mixing with fiscal and inflation ones. OAT/swap spreads rose to their highest level in months. UK gilt yields rally 7-10 bps. Treasuries outperform with yields adding 1-2 bps.
US dollar gains are far from convincing, especially considering the sour risk mood. European stocks tumbled up to 1.8% at some point. Yet EUR/USD lost only a few ticks to be testing the 1.14 big fig again. DXY's mirror image is doing the same around 101. USD/JPY shows some of the biggest gains, perhaps to Japan's/JPY's outsized reliance on Middle East oil supplies. The pair at 162.6 is within striking distance of the 40-year high set July 1st at 162.84. Sterling is going nowhere for a second day straight, suggesting the recent rally has run out of steam at least temporarily. EUR/GBP stabilizes around the 0.8544 support zone.
News & Views
Inflation in Sweden in June remained well below the 2% Riksbank target. CPIF headline inflation (fixed interest rate) eased to 0.3% m/m and 1.3% Y/Y (was 1.5% in May). CPIF ex. energy decelerated to 0.6% m/m and 0.4% y/y. Low inflation is largely due to fiscal policy measures. The statistics agency indicated that inflation mainly slowed down due to lower food price and transport costs. While the core measures were expected to ease even slightly further, they still allow the Riksbank to continue its wait-and-see approach. The RB in June assessed that it was well-balanced to leave the policy rate unchanged at 1.75%, but that the probability of higher rates later this year has increased compared to March. Markets currently expect RB to keep its policy rate still unchanged at the August meeting. About 50% probability of a rate hike is priced in from September. The low policy rate and the reluctance to tighten policy anytime soon (e.g. compared to the ECB) kept the Swedish krone in the defensive during most of 2026 so far. EUR/SEK currently trades near 11.05 to be compared with levels near 10.50 early February.
The National Bank of Hungary (MNB) today published the Minutes of the June 23 meeting. At that meeting the MNB cut the main policy rate by 25 bps to 6%. It was noted that the inflation outlook had improved significantly. For the rest of this year and next year, inflation was expected to remain below the central bank's target. The inflation rate in May (1.8%) was below the 3% (+/- 1%) tolerance band of the MNB. The strengthening of the forint and lower food prices were seen as having contributed to the downward shift in the inflation path compared to March. Even a withdrawal of the price margin caps was not seen as endangering price stability. In the Council's June assessment, there would be an opportunity to implement three 25 bps rate cuts during the summer, after which the September Inflation Report would provide guidance regarding the interest rate path. They remarked that such a pace was in line with the Council's careful, data-driven approach applied so far. However one policy member saw more room and voted to cut the policy rate by 50 bps. The HUF 2-y swap rate today rises by 11 bps (5.17%) and the forint eases to EUR/HUF 357.5. This is more due to the overall risk-off, rather than country specific issues.
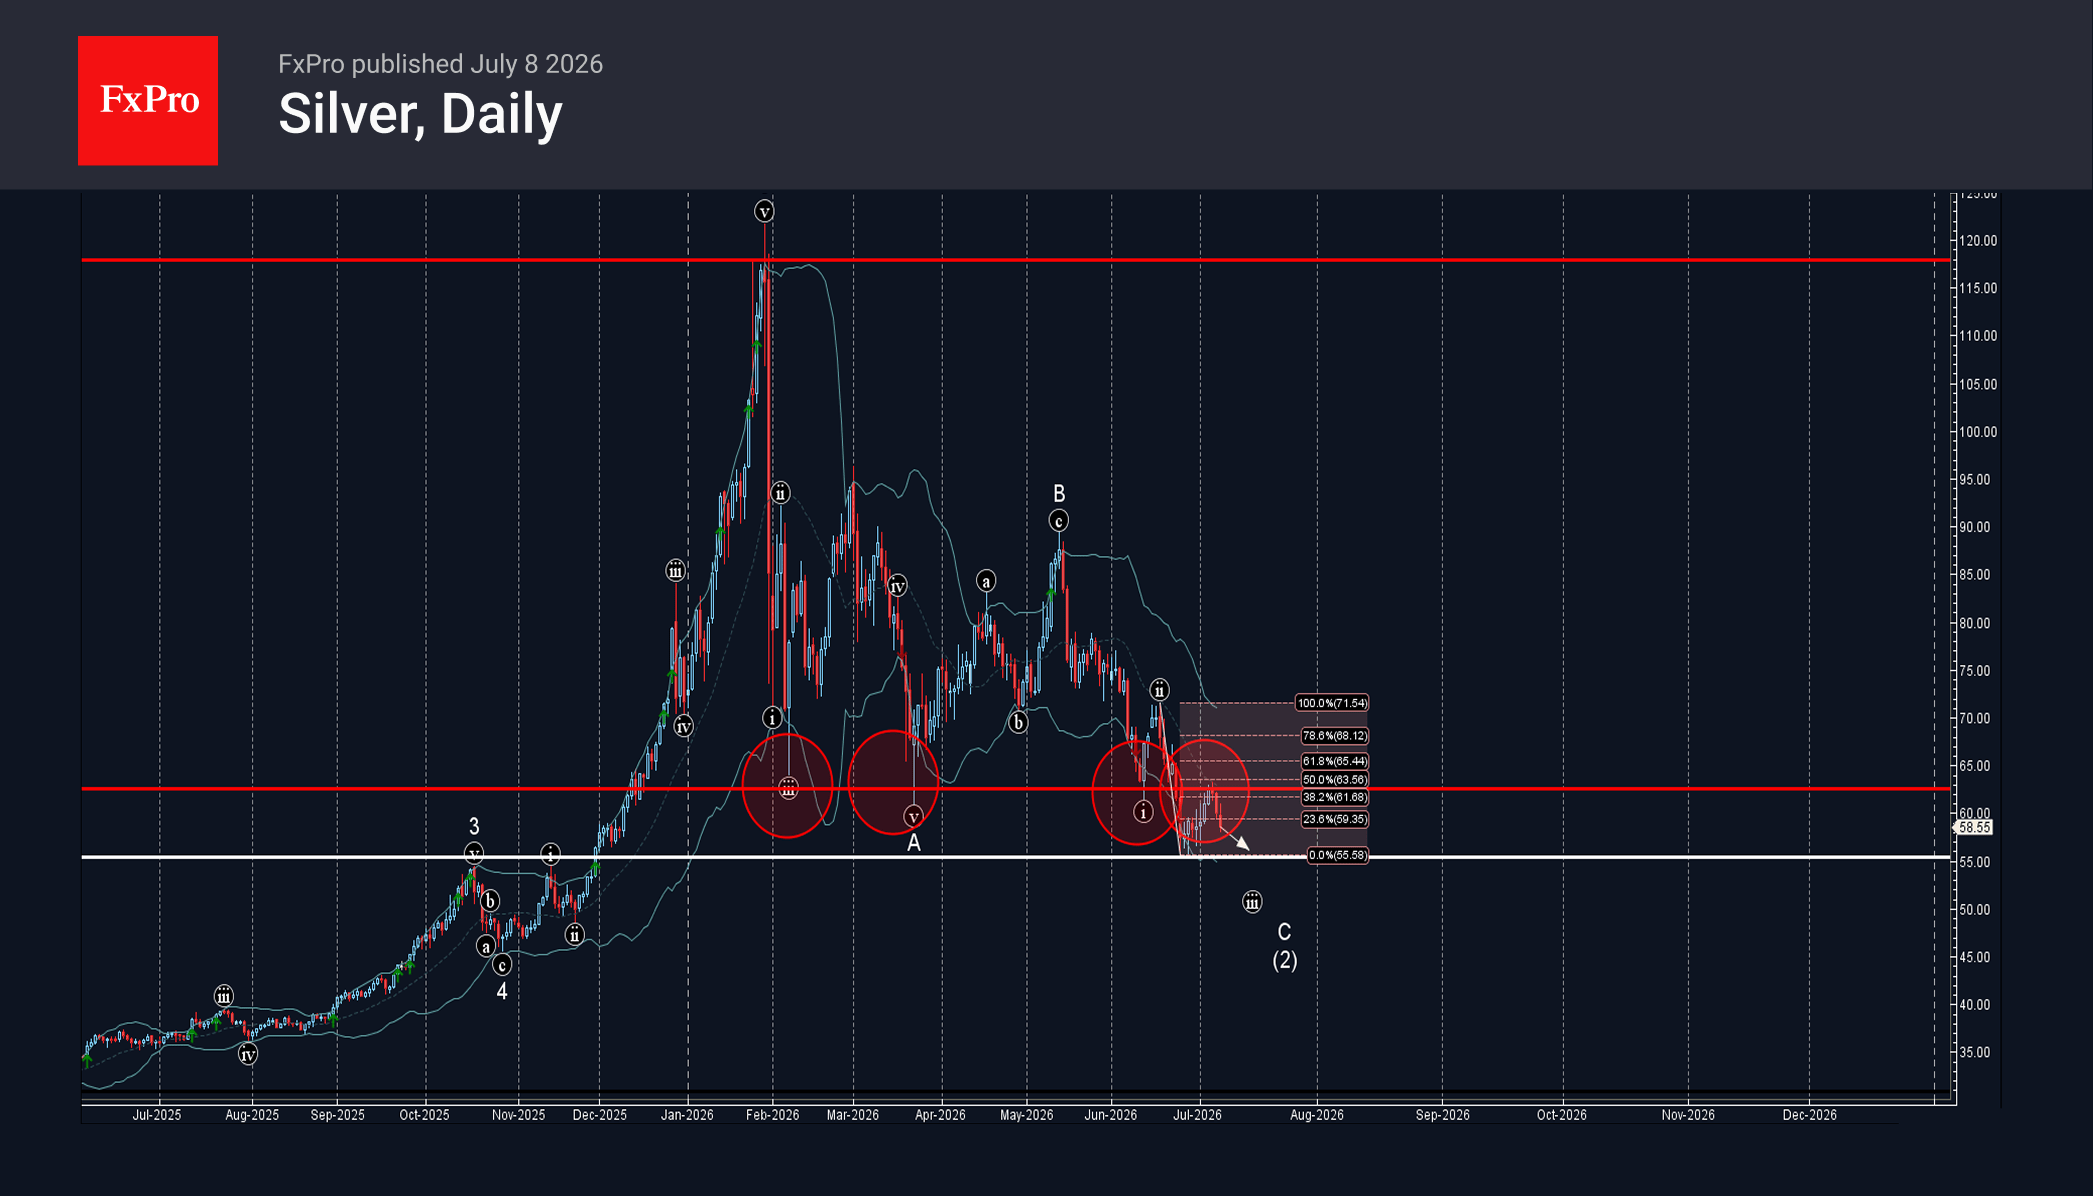
Silver Wave Analysis
Silver: ⬇️ Sell
– Silver reversed from resistance zone
– Likely to fall to support level 55.00
Silver recently reversed from the resistance zone between the key resistance level 62.60 (former strong support from February and June), 20-day moving average and the 50% Fibonacci correction of the downward impulse from June.
The downward reversal from this resistance area continues the active short-term impulse wave C which belongs to the ABC correction (2) from February.
Silver can be expected to fall further to the next support level 55.00 (which stopped earlier downward impulse at the end of June).
Oil Tests a Return of War Premium as Markets Await the Fed’s Hidden Debate
Markets were driven by two competing sources of uncertainty today as Brent crude surged toward the $80 mark while investors awaited the release of the June FOMC minutes for the first real insight into Chair Kevin Warsh's policy thinking. Dollar traded firmer alongside oil, while Kiwi outperformed following the Reserve Bank of New Zealand's rate hike. Yen, meanwhile, gave back recent gains and was the weakest major currency as intervention concerns continued to fade.
Oil dominated market attention after Brent rebounded from around $72 just a day earlier to briefly trade above $79. The initial leg higher followed US strikes against Iranian targets in retaliation for attacks on commercial shipping transiting the Strait of Hormuz. That move appeared largely driven by short covering after Brent had fallen back to pre-war levels on expanding OPEC+ supply and improving shipping conditions through the Gulf.
The rally gathered fresh momentum after President Donald Trump declared at the NATO summit in Ankara that the Iran ceasefire was "over," even as he added that negotiations could still continue. More importantly, the US Treasury withdrew the waiver allowing Iran to continue selling oil, marking the first concrete policy tightening of sanctions since the ceasefire framework was established. That directly challenges expectations that Iranian crude exports would gradually normalize, giving markets a more fundamental reason to rebuild part of the geopolitical risk premium.
Still, traders stopped well short of pricing a return to full-scale conflict. Trump's remarks themselves contained an important contradiction. While describing the ceasefire as effectively finished, he simultaneously left the door open for further negotiations. Likewise, although Tehran condemned the US strikes as a "gross violation" of the June memorandum and vowed to defend its territorial integrity, neither side has formally declared the diplomatic framework abandoned. Markets have now witnessed several similar cycles of military confrontation followed by renewed negotiations since the April ceasefire, making investors reluctant to assume each flare-up represents a lasting escalation.
Whether today's rebound develops into a broader repricing of geopolitical risk may depend on what follows next rather than what has already occurred. Additional sanctions, military deployments or direct disruptions to regional oil exports would point to a genuine breakdown of the ceasefire. In contrast, if recent events once again give way to diplomatic engagement, today's rally may ultimately prove another positioning adjustment rather than the beginning of a sustained return of the war premium. From a technical perspective, a decisive break above the $80 psychological level would be the first stronger indication that markets are beginning to price a more durable deterioration in the geopolitical backdrop.
Away from geopolitics, attention now shifts to the June FOMC minutes. Their significance is greater than usual because they represent the first detailed account of policy discussions under Kevin Warsh's leadership. Unlike previous Fed chairs, Warsh declined to submit an interest-rate projection in the Summary of Economic Projections and deliberately avoided providing meaningful forward guidance after the meeting. As a result, the minutes become the primary source for understanding how policymakers debated the outlook.
Markets will be looking beyond the unanimous decision to hold rates steady and instead focusing on the arguments made by the three emerging camps within the Committee. The June dot plot showed nine participants expecting at least one rate hike this year, eight projecting no further change and one anticipating a cut. Investors will pay particular attention to whether several officials argued that a rate increase was already warranted in June, as such language would reinforce the Fed's hawkish shift despite last week's softer-than-expected payroll report.
Iran Strikes Give Oil Bears a Reason to Cover—Not a Reason to Panic
Fresh US strikes on Iran gave oil bears a reason to cover shorts after Brent's slide to pre-war levels. But the restrained rebound suggests traders are treating the latest Strait of Hormuz flare-up as part of a familiar escalation-and-de-escalation pattern, not the start of another oil shock. Read More.
NZD/USD Recovers After RBNZ, but Higher Bar for Next Hike Caps Rally
NZD/USD initially climbed after the RBNZ raised interest rates, but the rally quickly lost momentum. Find out why investors focused less on the 25bp hike itself and more on the Committee's balanced inflation outlook, which suggests the hurdle for another rate increase has become considerably higher. Read More.
RBNZ Raises OCR, Consensus Masks Diverging Inflation Views
The RBNZ delivered a unanimous 25bp rate hike, but the more revealing story was inside the Committee. While all members agreed to lift the OCR to 2.50%, policymakers differed on the balance of inflation risks, leading to guidance that keeps further tightening likely but leaves the timing firmly data dependent. Read More.
BoJ's Asada: Demand-Driven Inflation Needed Before Another Rate Hike
What matters isn't just how high inflation is, but what's driving it. BOJ board member Toichiro Asada argued that inflation fueled by oil prices and a weaker yen is not enough to justify another rate hike, saying he wants to see stronger wages and domestic demand before supporting further policy tightening. Read More.
RBA's Hunter: Supply Shocks Don't Mean Inflation Can Be Ignored
Should central banks ignore inflation caused by higher oil prices and other supply shocks? RBA Assistant Governor Sarah Hunter says not necessarily. She argues that if supply shocks become persistent and begin influencing inflation expectations, policymakers may still need to tighten policy despite the cost to economic growth. Read More.
AUD/USD Daily Report
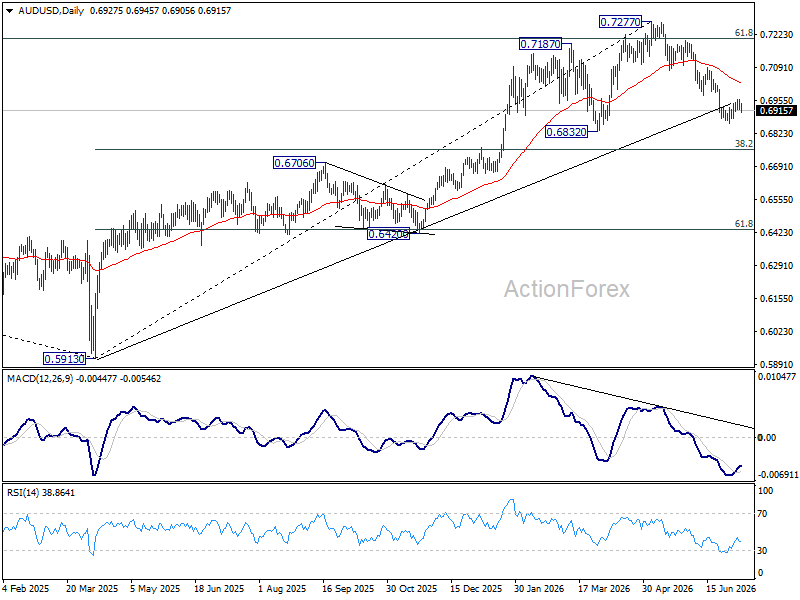
Intraday bias in AUD/USD remains neutral and consolidations could continue above 0.6864. Further fall is expected as long as 0.6977 support turned resistance holds. Below 0.6864 will target 0.6832 support. Firm break there will target 0.6756 fibonacci level. However, sustained break of 0.6977 will bring stronger rebound to 0.7087 resistance instead.
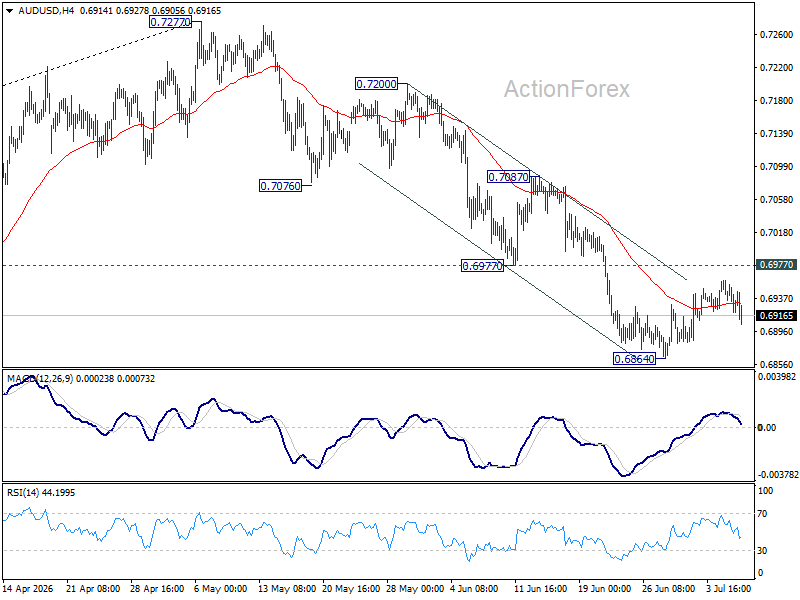
In the bigger picture, considering bearish divergence condition in D MACD, a medium term top could be formed at 0.7277 after failing to sustain above 61.8% retracement of 0.8006 (2021 high) to 0.5913 (2024 low) at 0.7206. Deeper fall could be seen to 38.2% retracement of 0.5913 to 0.7277 at 0.6756 as a correction. But strong support should be seen there to bring rebound. Consolidations would continue below 0.7277 for a while.
EUR/USD Daily Outlook
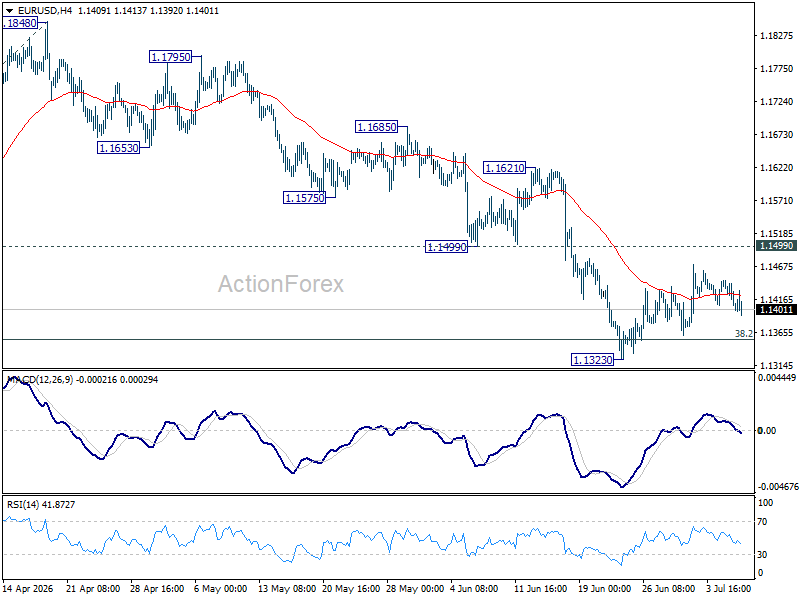
Intraday bias in EUR/USD remains neutral as consolidations continue above 1.1323. With 1.1499 support turned resistance intact, further decline is expected. On the downside, break of 1.1323 will resume the fall from 1.2081 to 100% projection of 1.2081 to 1.1408 from 1.1848 at 1.1175. However, decisive break of 1.1499 will turn bias back to the upside for 55 D EMA (now at 1.1546) and above.
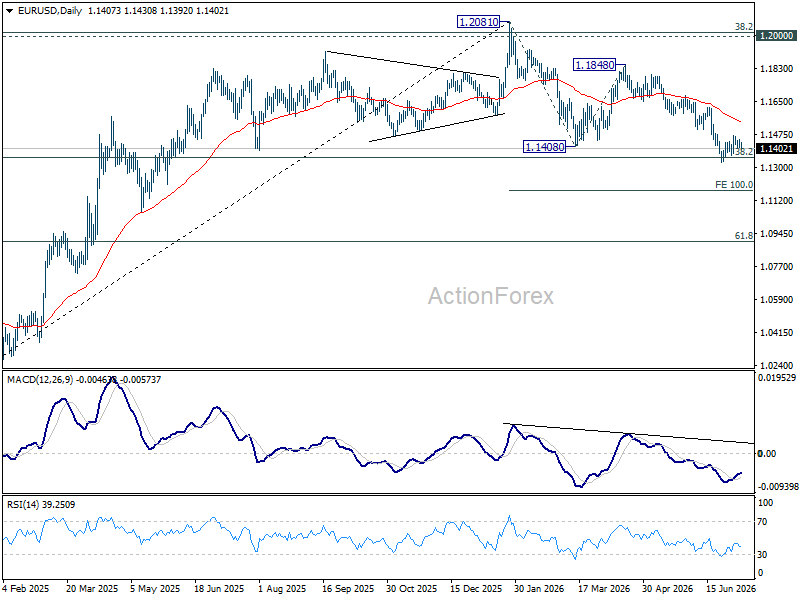
In the bigger picture, focus is back on 38.2% retracement of 1.0176 to 1.2081 at 1.1353. Decisive break there will revive the case of medium term bearish trend reversal after rejection by 1.2 key cluster resistance level. Further fall should be seen to 61.8% retracement at 1.0904. Nevertheless, strong rebound from 1.1353, followed by break of 1.1621 resistance, will retain medium term bullishness.
USD/JPY Daily Outlook
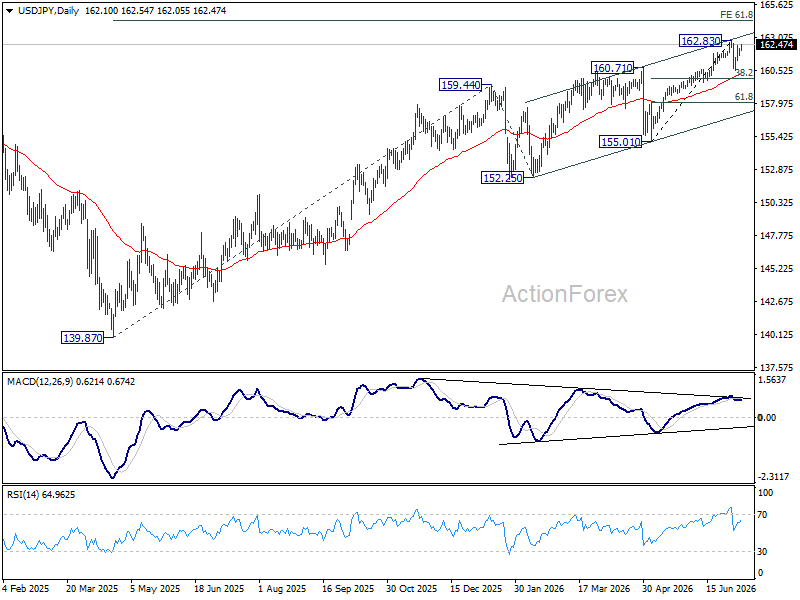
Intraday bias in USD/JPY stays neutral at this point. More consolidations could be seen below 162.83. In case of another fall, downside should be contained by 38.2% retracement of 155.01 to 162.83 at 159.84. On the upside, firm break of 162.83 will resume larger up trend.
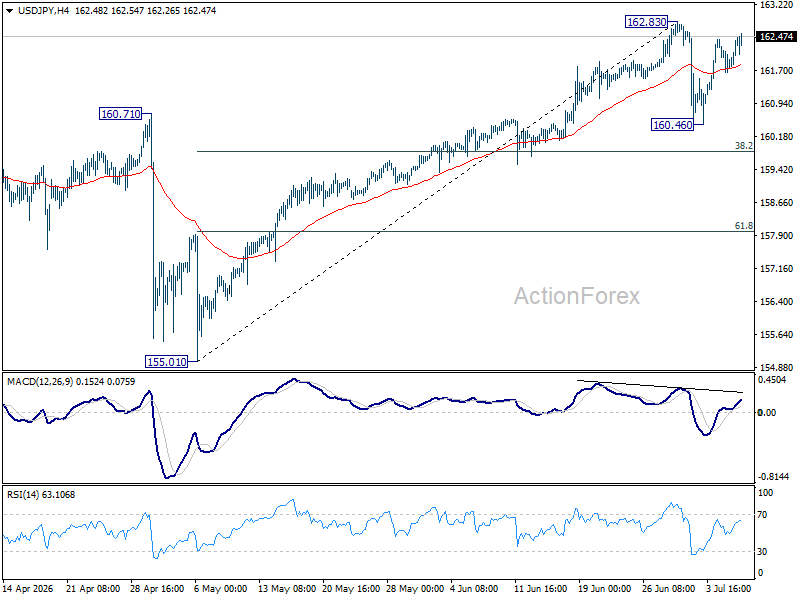
In the bigger picture, rise from 139.87 (2025 low) is seen as another rising leg of the long term up trend. Next target is 61.8% projection of 139.87 to 159.44 from 152.25 at 164.34. For now, outlook will remain bullish as long as 155.01 support holds, even in case of deep pullback.
GBP/USD Daily Outlook
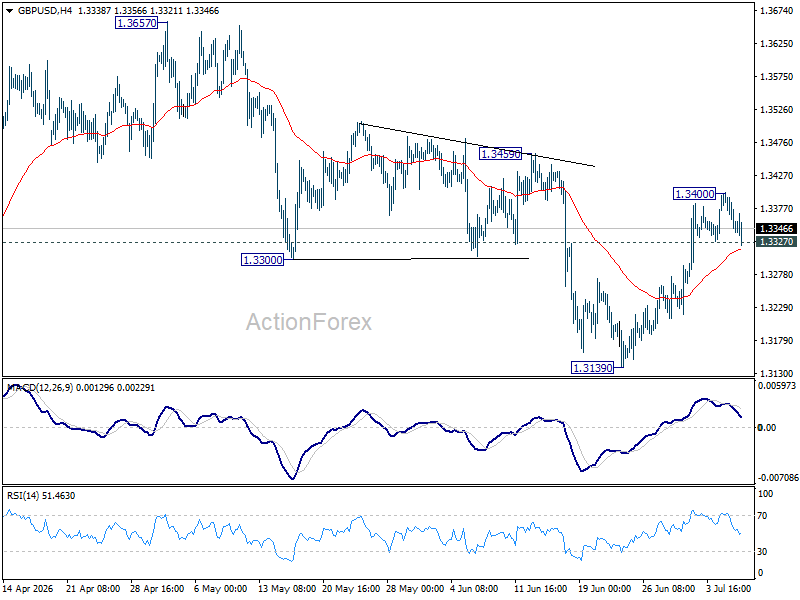
Intraday bias in GBP/USD is turned neutral with current retreat, and some consolidations would be seen first. Above 1.3400 will target 1.3459 resistance. Firm break there will argue that whole correction from 1.3867 has completed, and target 1.3657 resistance for confirmation.
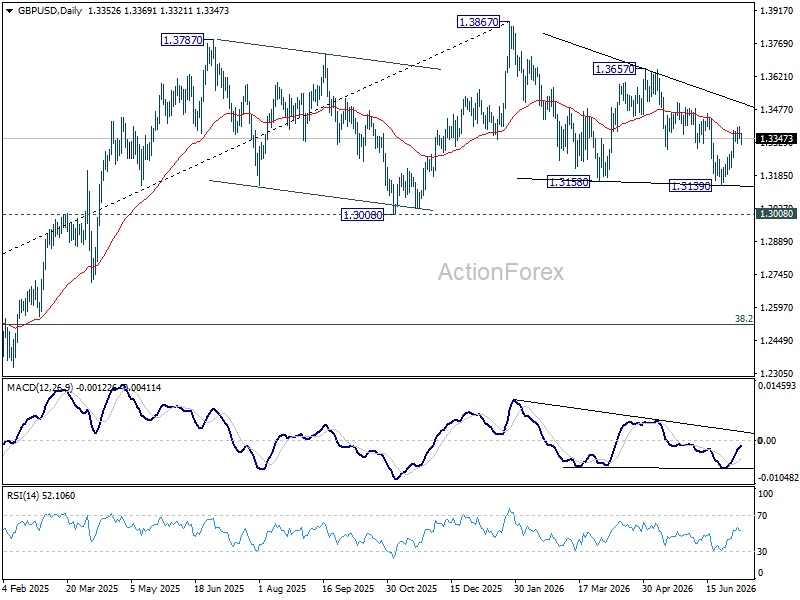
In the bigger picture, price actions from 1.3867 are a corrective pattern within the broader up trend from 1.0351 (2022 low). With 1.3008 support intact, medium term bullishness is maintained and break of 1.3867 is in favor for a later stage, towards 1.4248 key resistance (2021 high). However, firm break of 1.3008 will at least bring deeper fall to 38.2% retracement of 1.0351 to 1.3867 at 1.2524, with increased risk of bearish reversal.
USD/CHF Daily Outlook
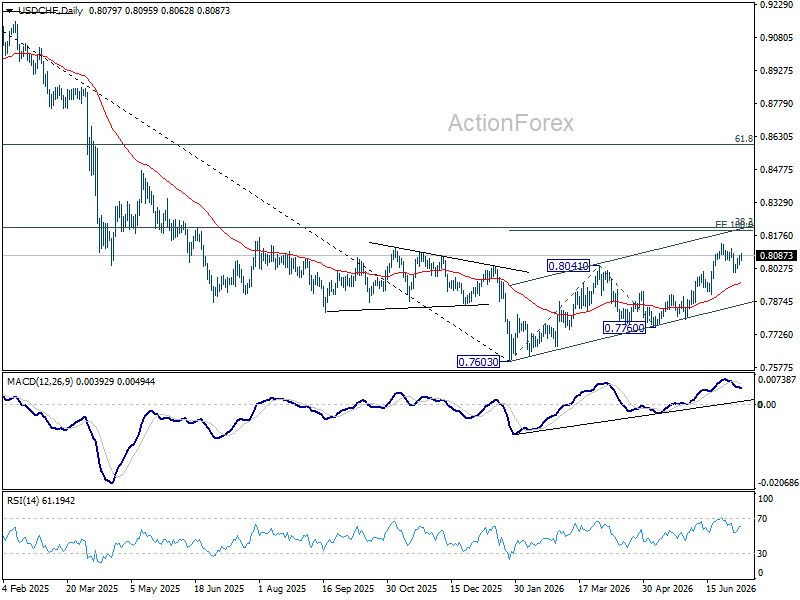
Intraday bias in USD/CHF stays neutral and further rally is expected as long as 0.8009 support holds. Above 0.8139 will extend the rally from 0.7760 to 100% projection 0.7603 to 0.8041 from 0.7600 at 0.8198 next. However, sustained break of 0.8009 support will bring deeper fall to 55 D EMA (now at 0.7960) and below.
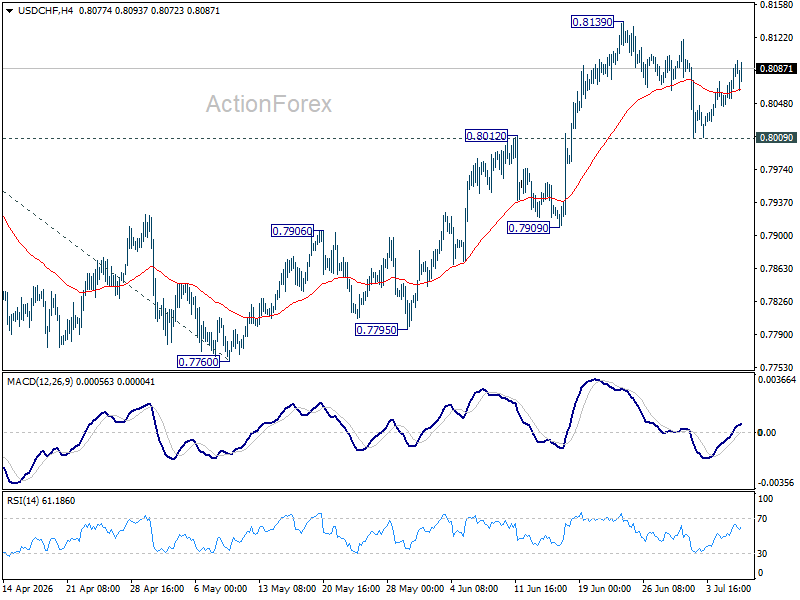
In the bigger picture, while a medium term bottom was formed at 0.7603, it's still early to call for bullish trend reversal. As long as 38.2% retracement of 0.9200 (2025 high) to 0.7603 at 0.8213 holds, the larger down trend could still continue through 0.7603 at a later stage. However, firm break of 0.7603 will argue that the trend has reversed and turn focus to 0.8332 support turned resistance (2023 low) for confirmation.
AUD/USD Daily Report
Intraday bias in AUD/USD remains neutral and consolidations could continue above 0.6864. Further fall is expected as long as 0.6977 support turned resistance holds. Below 0.6864 will target 0.6832 support. Firm break there will target 0.6756 fibonacci level. However, sustained break of 0.6977 will bring stronger rebound to 0.7087 resistance instead.
In the bigger picture, considering bearish divergence condition in D MACD, a medium term top could be formed at 0.7277 after failing to sustain above 61.8% retracement of 0.8006 (2021 high) to 0.5913 (2024 low) at 0.7206. Deeper fall could be seen to 38.2% retracement of 0.5913 to 0.7277 at 0.6756 as a correction. But strong support should be seen there to bring rebound. Consolidations would continue below 0.7277 for a while.
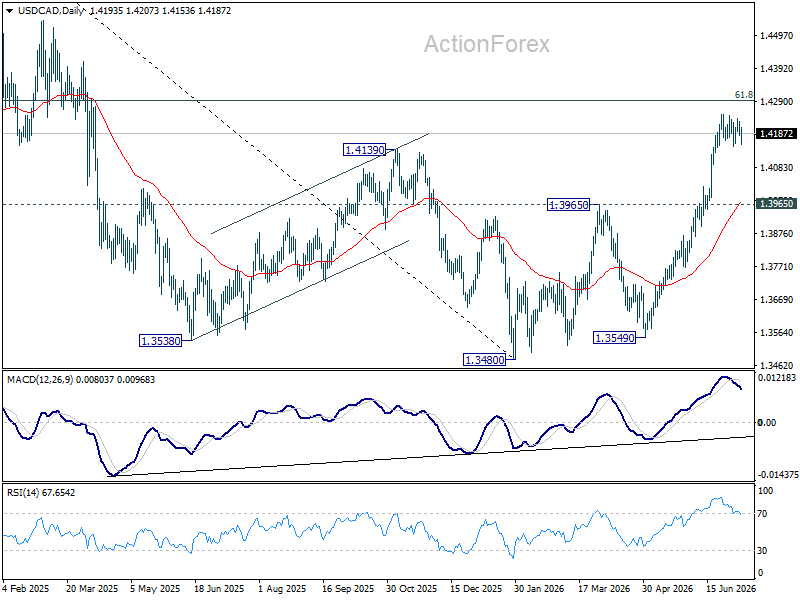
USD/CAD Daily Outlook
USD/CAD is still bounded in consolidations below 1.4247 and intraday bias remains neutral. Deeper pullback cannot be ruled out. But downside should be contained above 1.3965 resistance turned support. Above 1.4247 will resume the rally from 1.3480 to 61.8% retracement of 1.4791 to 1.3480 at 1.4290. Firm break there will pave the way back to 1.4791 high.
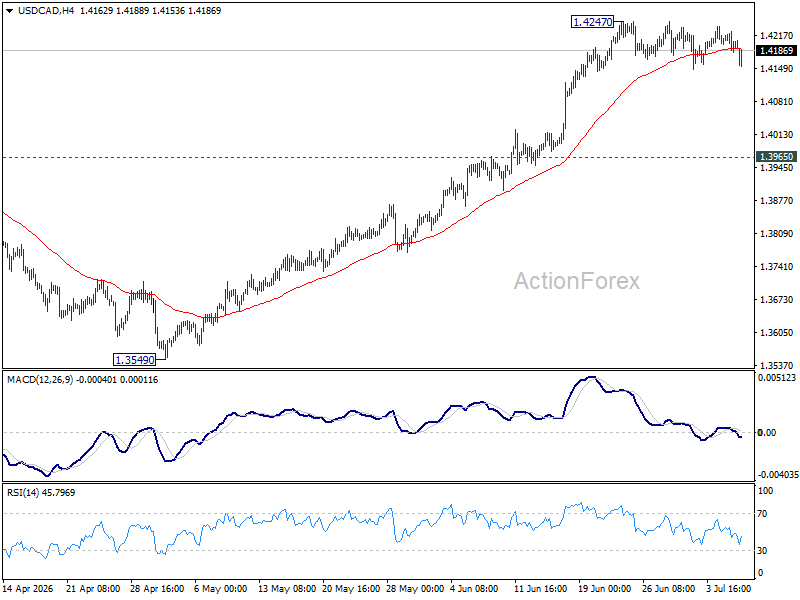
In the bigger picture, current development suggests that fall from 1.4791 has completed as a three wave correction to 1.3480. It's still early to judge if rise from there a corrective bounce, or resumption of the larger up trend from 1.2005 (2021 low). But in either case, retest of 1.4791 high should be seen next.