Sample Category Title
Trump Announces Iran Breakthrough — But Will Oil and Yields Believe It?
Global markets are entering the new week facing an important question: did US President Donald Trump just announce the beginning of real peace in the Middle East, or merely a ceasefire extension in a still-dangerous conflict?
Trump said on Saturday that a major agreement with Iran had been “largely negotiated” and that a formal Memorandum of Understanding would soon be announced. Iranian officials also confirmed that discussions are moving toward a first-stage framework. Optimism centered on the possibility of easing tensions around the Strait of Hormuz, the vital artery for global energy trade that has remained at the center of market anxiety for months.
Yet the deeper details suggest investors may remain cautious about fully embracing the breakthrough narrative. Both Washington and Tehran have indicated that the proposed framework would mainly function as a 30-to-60-day ceasefire extension designed to keep negotiations alive rather than permanently settle the conflict.
More importantly, some of the most explosive disputes remain unresolved. Iran-linked media insist Tehran will retain effective control over transit rules and security management in the Strait of Hormuz, while there still appears to be no meaningful agreement on Iran’s highly enriched uranium stockpile or the broader nuclear issue.
That is why oil prices, Treasury yields, and Dollar may become the real lie detectors for the market this week. If traders truly believe the agreement represents lasting normalization and free reopening of global energy flows, Brent crude should break sharply lower while inflation fears and global yields retreat. But if oil remains elevated and yields continue holding firm, markets would effectively be signaling that they still see the agreement as just another temporary truce rather than a durable peace settlement.
Ceasefire Extension Buys Time, but Permanent Peace Still Far Away
The framework currently under discussion between Washington and Tehran appears designed first and foremost to stop the conflict from reigniting immediately rather than permanently resolve the crisis. While Trump described the agreement as “largely negotiated,” officials on both sides have clarified that the proposed Memorandum of Understanding would effectively function as a 30-to-60-day ceasefire extension intended to create diplomatic space for broader negotiations later this summer.
That distinction is critical for markets. The war that erupted following the February 28 US-Israeli strikes has fundamentally reshaped global energy pricing, inflation expectations, and central bank outlooks. A temporary pause in hostilities may help reduce immediate fears of re-escalation, but it does not automatically remove the structural geopolitical premium embedded in oil prices unless investors believe a durable settlement is genuinely emerging.
In reality, the current framework appears closer to a diplomatic bridge agreement than a comprehensive peace accord. The proposed arrangement would reportedly include limited sanctions relief, partial unfreezing of Iranian overseas assets, and some form of gradual easing of tensions around the Strait of Hormuz. In exchange, Tehran may offer limited concessions, potentially including provisional cooperation on shipping access and a commitment to enter broader nuclear discussions during the next phase of talks.
But the hardest negotiations have effectively been postponed rather than completed. Iranian officials continue signaling that meaningful discussions over the nuclear program and highly enriched uranium stockpile will only begin after hostilities are formally suspended and confidence-building measures are implemented. That means the next 30 to 60 days may prove even more important than the current announcement itself.
For markets, this creates a very different dynamic from a clean peace settlement. Traders are not yet being asked to price a fully normalized Middle East. Instead, they are being asked to price a fragile diplomatic holding pattern where the probability of renewed confrontation has decreased, but where the fundamental drivers of the conflict remain unresolved beneath the surface.
The Real Question Is Not Just Whether Hormuz Reopens — But Who Controls It
Financial markets may ultimately judge Trump’s Iran breakthrough based on one issue above all others: the future of the Strait of Hormuz.
While headlines initially focused on the possibility of reopening the critical energy corridor, the deeper dispute quickly became clear over the weekend. Iranian-linked media strongly pushed back against suggestions that Tehran would surrender operational control over the Strait as part of the proposed agreement. Instead, officials tied to the IRGC emphasized that management of shipping routes, transit procedures, and passage permits would remain entirely under Iranian authority.
That creates a major problem for markets attempting to price a genuine return to normal global energy flows. Washington’s position has consistently centered around restoring unrestricted international access through Hormuz, while Tehran increasingly appears determined to preserve the leverage it gained during the conflict. Iran’s proposed transit system — including vetting mechanisms, controlled routing, and “security fees” for shipping — effectively turns Hormuz into a managed geopolitical pressure point rather than a fully normalized commercial corridor.
For oil traders, this distinction is enormous. As long as Tehran retains the ability to control shipping conditions inside Hormuz, a meaningful geopolitical premium is likely to remain embedded in oil prices. The implications extend far beyond energy markets. Persistently elevated oil prices would continue feeding inflation concerns globally, complicating the outlook for major central banks already struggling with the economic fallout from the conflict.
Iran’s Uranium Stockpile Remains the Unresolved Core of the Conflict
One of the most striking aspects of Trump’s Iran announcement was not what it included — but what it left out.
Despite months of US rhetoric emphasizing Iran’s nuclear program as a central threat, the proposed framework appears to contain little immediate progress on Tehran’s highly enriched uranium stockpile or the broader nuclear dispute. Instead, Iranian officials and hardline media suggest those negotiations are effectively being deferred into the next stage of diplomacy, potentially weeks or months away.
That sequencing matters enormously. Tehran is reportedly insisting that sanctions relief, asset unfreezing, and stabilization measures must come first before it considers substantive concessions on enrichment or international oversight. In effect, Iran appears to be treating the current framework as a mechanism to reduce immediate economic and military pressure while postponing the most politically sensitive elements of the negotiations.
For markets, this reinforces the idea that the current agreement may function more as a diplomatic bridge than a final settlement. The ceasefire framework may reduce the immediate risk of renewed strikes or energy disruptions, but it does not yet resolve the deeper strategic confrontation surrounding Iran’s nuclear capabilities. As long as the uranium issue remains unresolved, traders are unlikely to fully embrace the narrative of lasting geopolitical normalization in the Middle East.
Oil Will Be the First and Most Important Market Verdict
If markets are going to deliver a real-time verdict on Trump’s Iran breakthrough, Brent crude will almost certainly be the most important gauge to watch this week. Oil has been the central transmission channel through which the entire conflict has affected global markets — driving inflation fears, bond yields, central bank expectations, and broad risk sentiment. That means the credibility of the agreement will ultimately be tested first through energy pricing.
Brent crude already retreated sharply from last week’s spike high at 112.72 to close near 104.24 after diplomacy headlines emerged. But importantly, oil has not collapsed. Instead, price action remains trapped firmly inside the large converging triangle pattern that has dominated the market since the March peak at 119.50.
In many ways, that technical structure reflects the evolution of the crisis itself: the initial phase was pure geopolitical panic, while the current phase has transitioned into a slower-moving inventory depletion and supply-risk cycle.
As long as Brent remains elevated above key technical support levels, markets are effectively signaling that geopolitical risk premiums remain intact. Traders may believe the probability of immediate military escalation has decreased, but they are not yet convinced that physical oil flows through the Strait of Hormuz are genuinely returning to normal conditions.
Technically, Brent oil might gyrate lower to 96.03 support and possibly below in the next few days. But the most critical level sits at 100% projection of 115.30 to 96.03 from 112.71 at 93.45. Until Brent decisively breaks below that level on a daily closing basis, current fall is just one of the legs inside the mentioned triangle pattern. That is, the market is likely treating Trump’s announcement as a temporary de-escalation rather than a structural peace settlement.
However, if Brent breaks firmly below 93.45, the market narrative could shift rapidly. That would likely signal growing confidence that physical supply normalization is genuinely underway and that the geopolitical premium embedded since March is finally beginning to unwind. In that scenario, downside acceleration toward 86.09 and even 161.8% projection at 81.54 could become realistic targets.

Bond Markets Still Need Convincing Before Inflation Fears Truly Fade
While oil prices will likely deliver the first verdict on Trump’s Iran breakthrough, Treasury yields may ultimately determine whether markets genuinely believe the inflation shock tied to the conflict is starting to reverse. The global bond selloff accelerated sharply over the past two months as investors increasingly priced the risk that elevated energy prices would feed into broader inflation pressures and force central banks back toward tightening.
That concern remains very much alive. US 10-year Treasury yield surged as high as 4.69% last week before pulling back modestly to close near 4.56. Importantly, yields remain comfortably above the critical 4.48 resistance-turned-support zone. As long as that level holds, markets are effectively signaling that inflation fears tied to oil, shipping disruptions, and second-round price effects have not meaningfully disappeared.
The timing issue is becoming increasingly important for central banks. Institutions such as ECB have largely spent recent weeks in wait-and-see mode, hoping that tensions surrounding the Strait of Hormuz would ease quickly enough to prevent a broader inflation spiral. But with oil prices still elevated and uncertainty surrounding Hormuz unresolved, policymakers are running out of time to simply “look through” the shock. Markets are now increasingly leaning toward another ECB hike in June, while fed fund futures are pricing roughly a 68% chance of a Fed hike by December back to 3.75–4.00%.

That shift also complicates the transition inside the Federal Reserve itself. Kevin Warsh may now be formally installed as Trump’s successor as Fed Chair, but elevated oil prices and sticky inflation risks could sharply limit his room to steer policy toward easier conditions. In fact, Jerome Powell’s decision to remain on the Board of Governors after leaving the Chair role may prove one of the most important underappreciated developments for markets.
Powell staying on the Board is highly unusual historically and creates a powerful hawkish counterweight inside the Fed. As Chair, Powell had to constantly balance internal factions and maintain consensus. But as a regular Governor, he no longer carries the burden of diplomacy. Instead, he becomes a single but extremely influential voting member capable of openly resisting premature easing if inflation risks remain elevated.
Technically, 10-year yields remain one of the clearest market confirmation gauges. A decisive break below 4.48 would suggest investors are beginning to genuinely price disinflation and fading energy risks again, opening room for 38.2% retracement of 3.96 to 4.69 at 4.41 and providing relief for equities.
But if yields remain firmly above that zone, the bond market may effectively be signaling that Trump’s Iran deal has not yet solved the underlying inflation problem at all.

Dollar the Final Confidence Gauge for Global Markets
In many ways, Dollar may become the final and most comprehensive test of whether markets truly trust Trump’s Iran breakthrough.
The greenback has benefited throughout the conflict from a powerful combination of safe-haven demand, elevated Treasury yields, and rising expectations that Fed may need to stay tighter for longer due to oil-driven inflation pressures. For Dollar to reverse meaningfully now, markets would need confidence not only that geopolitical tensions are easing, but also that energy prices and inflation risks are genuinely starting to normalize.
That has not happened yet. Dollar Index’s extended rebound from 97.62 and subsequent break above 99.31 last week indicate that the pullback from 100.64 may already have completed. More importantly, the recovery came after firm defense of 61.8% retracement of 95.55 to 100.64 at 97.49 — a technical development suggesting underlying bullish momentum in Dollar remains intact for now.

If oil prices stay elevated and Treasury yields remain firm, Dollar is unlikely to weaken meaningfully even if diplomatic headlines continue improving. Markets would effectively continue treating the geopolitical shock as unresolved, maintaining demand for Dollar through both safe-haven flows and rising US yield support.
Under that scenario, Dollar Index could extend higher toward 100.64 again and potentially even 38.2% retracement of 110.17 to 95.5 at 101.13. Nevertheless, barring an actual escalation (e.g., direct kinetic actions), Dollar Index will likely struggle to breach 101.13 purely on headline momentum.
However, the opposite scenario is equally important to monitor. If Brent crude breaks decisively lower and US 10-year yields fall through key support levels, Dollar could quickly lose momentum as markets aggressively unwind geopolitical and inflation positioning.
Sustained break below 55 D EMA (now at 98.72) would strongly suggest the fall from 100.64 is resuming through 97.62 towards 95.55 low. That would likely signal investors are finally becoming convinced the Iran agreement represents more than just another temporary ceasefire extension.
EUR/USD Weekly Outlook
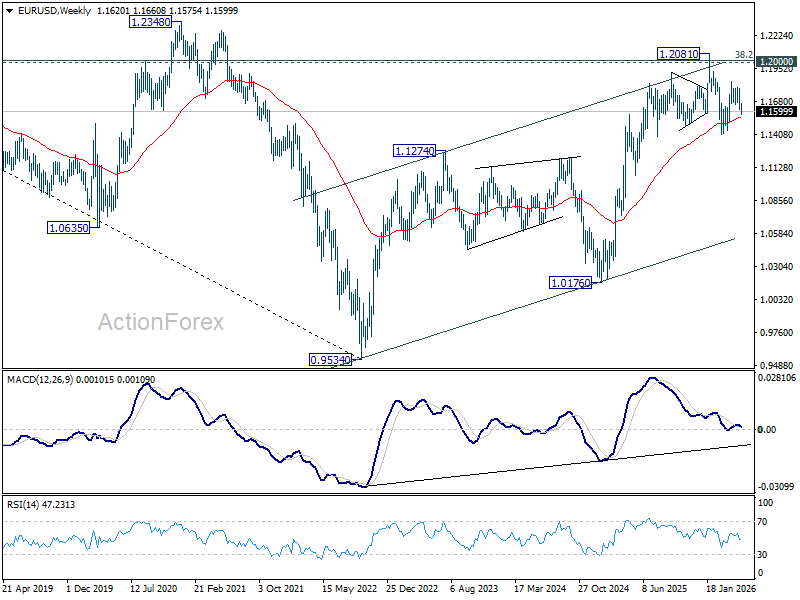
EUR/USD's extended decline suggests that corrective rebound from 1.1408 has completed at 1.1848. But as a temporary low was formed at 1.1575, initial bias remains neutral this week first. On the downside, below 1.1575 will bring deeper fall back to retest 1.1408 low. However, firm break of 1.1660 resistance will dampen this bearish view, and bring stronger rise back to 1.1795 resistance first.
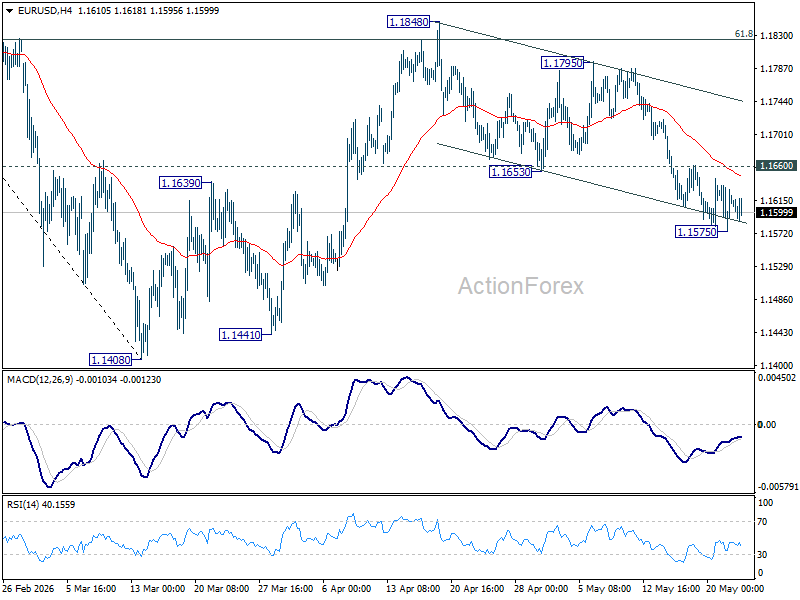
In the bigger picture, the strong support from 38.2% retracement of 1.0176 to 1.2081 at 1.1353 suggests that the pullback from 1.2081 is more likely a corrective move. Strong support was also found in 55 W EMA (now at 1.1542). Focus is back on 1.2 key cluster resistance level. Decisive break there will carry long term bullish implications. Nevertheless, break of 1.1408 support will revive the case of medium term bearish trend reversal.
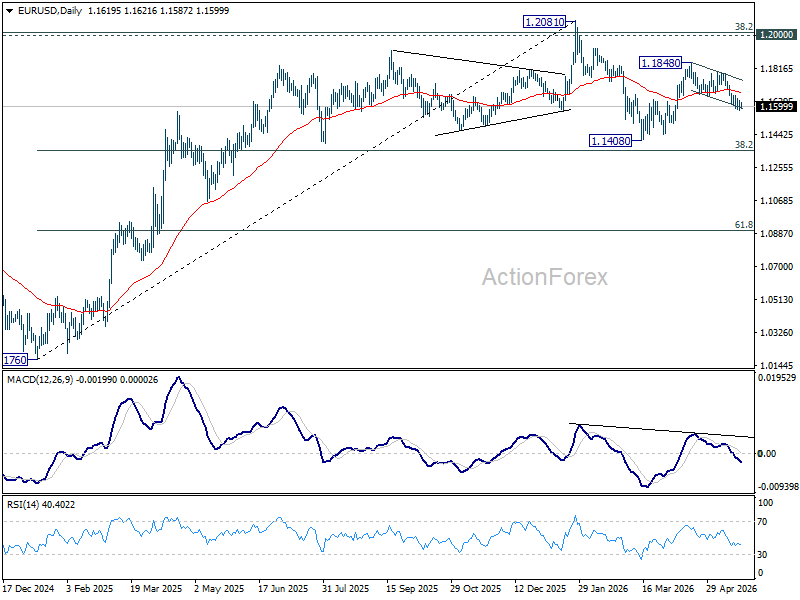
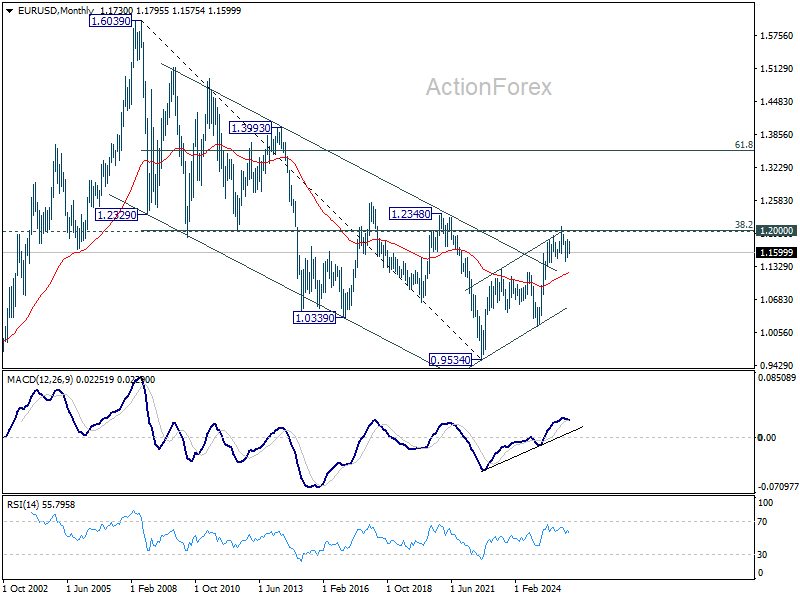
In the long term picture, 38.2% retracement of 1.6039 to 0.9534 at 1.2019, which is close to 1.2000 psychological level is the key for the outlook. Rejection by this level will keep the multi decade down trend from 1.6039 (2008 high) intact, and keep outlook neutral at best. However, decisive break of 1.2000/19, will suggest long term bullish trend reversal, and target 61.8% retracement at 1.3554.
EUR/USD Weekly Outlook
EUR/USD's extended decline suggests that corrective rebound from 1.1408 has completed at 1.1848. But as a temporary low was formed at 1.1575, initial bias remains neutral this week first. On the downside, below 1.1575 will bring deeper fall back to retest 1.1408 low. However, firm break of 1.1660 resistance will dampen this bearish view, and bring stronger rise back to 1.1795 resistance first.
In the bigger picture, the strong support from 38.2% retracement of 1.0176 to 1.2081 at 1.1353 suggests that the pullback from 1.2081 is more likely a corrective move. Strong support was also found in 55 W EMA (now at 1.1542). Focus is back on 1.2 key cluster resistance level. Decisive break there will carry long term bullish implications. Nevertheless, break of 1.1408 support will revive the case of medium term bearish trend reversal.
In the long term picture, 38.2% retracement of 1.6039 to 0.9534 at 1.2019, which is close to 1.2000 psychological level is the key for the outlook. Rejection by this level will keep the multi decade down trend from 1.6039 (2008 high) intact, and keep outlook neutral at best. However, decisive break of 1.2000/19, will suggest long term bullish trend reversal, and target 61.8% retracement at 1.3554.
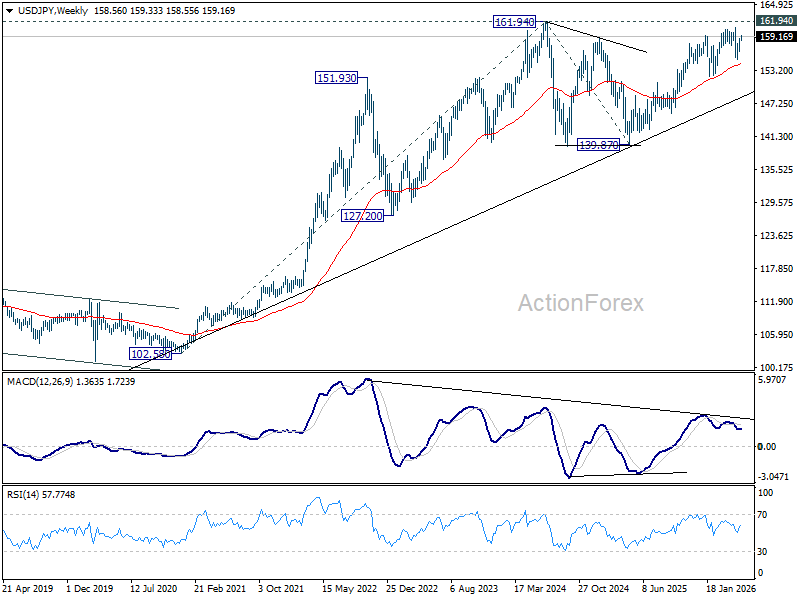
USD/JPY Weekly Outlook
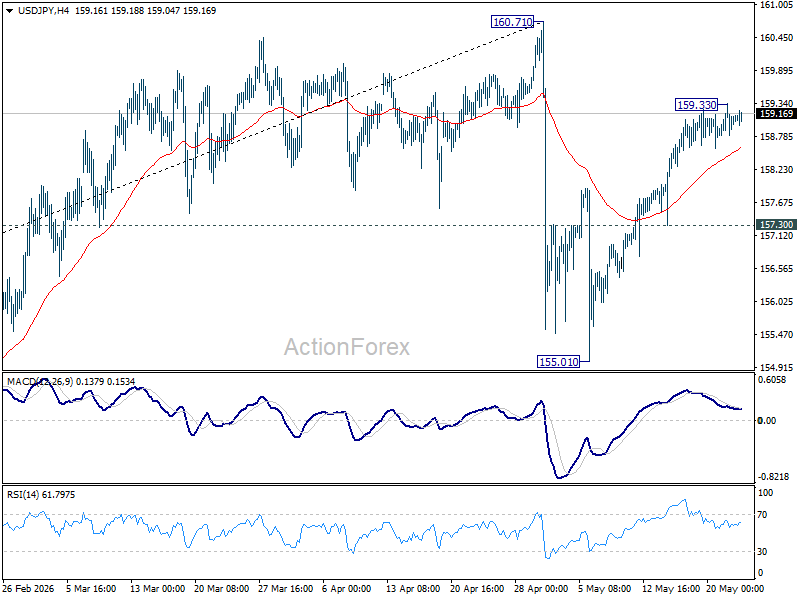
USD/JPY's rebound from 155.01 continued last week but lost momentum after hitting 159.33. Initial bias remains neutral this week first. Above 159.24 will target 160.71 high. Strong resistance is expected from there to start the third leg of the near term corrective pattern. On the downside, break of 157.30 support will turn bias to the downside for retesting 155.01.
In the bigger picture, for now, corrective pattern from 161.94 (2024 high) is still seen as completed at 139.87. Rise from there is seen as resuming the long term up trend. So, break of 161.94 is expected at a later stage to resume the long term up trend. However, sustained break of 55 W EMA (now at 154.36) will dampen this view and bring deeper fall back towards 139.87 to extend the pattern from 161.94.
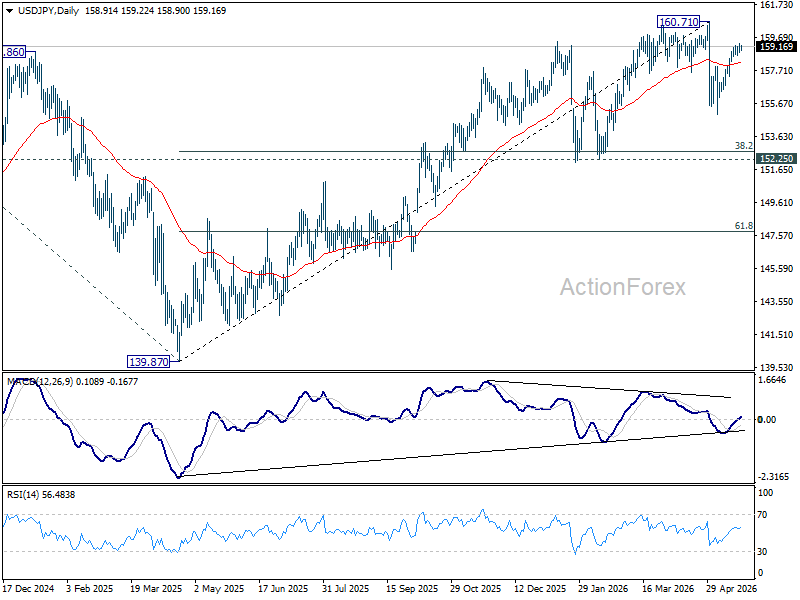
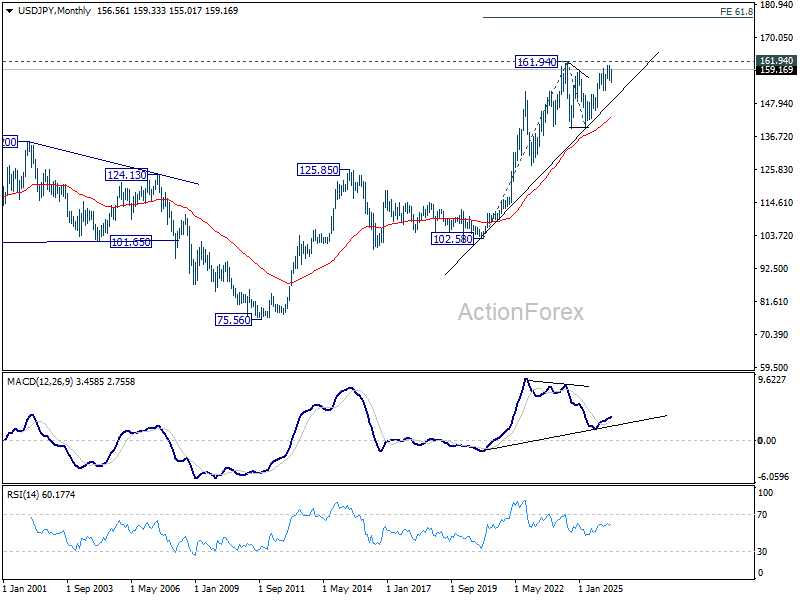
In the long term picture, up trend from 75.56 (2011 low) is still in progress and might be ready to resume. Firm break of 161.94 will target 61.8% projection of 102.58 (2020 low) to 161.94 (2024 high) from 139.87 at 176.55 in the medium term. Long term outlook will stay bullish as long as 139.87 support holds, even in case of deep pullback.
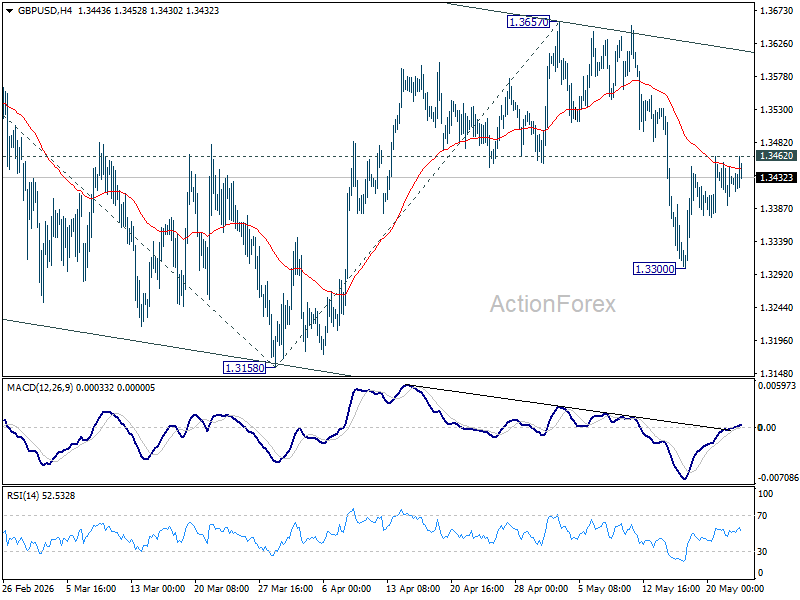
GBP/USD Weekly Outlook
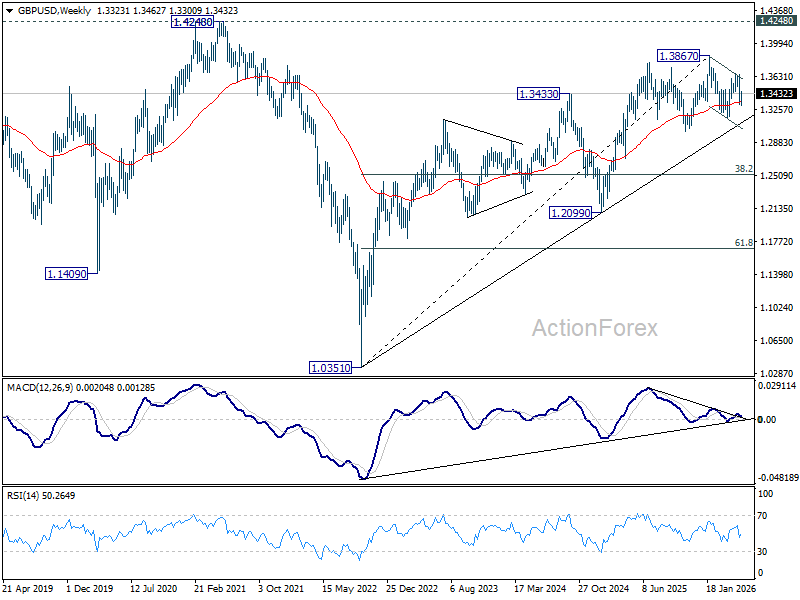
GBP/USD's recovery was capped at 1.3462 last week. Initial bias remains neutral this week first. On the downside, below 1.3300 will target a retest on 1.3158 support first. However, firm break of 1.3462 will bring stronger rebound back to 1.3657 resistance instead.
In the bigger picture, current development suggests that price actions from 1.3867 are merely a corrective pattern within the broader up trend from 1.0351 (2022 low). With 1.3008 support intact, medium term bullishness is maintained and break of 1.3867 is in favor for a later stage, towards 1.4248 key resistance (2021 high). However, firm break of 1.3008 will at least bring deeper fall to 38.2% retracement of 1.0351 to 1.3867 at 1.2524, with increased risk of bearish reversal.
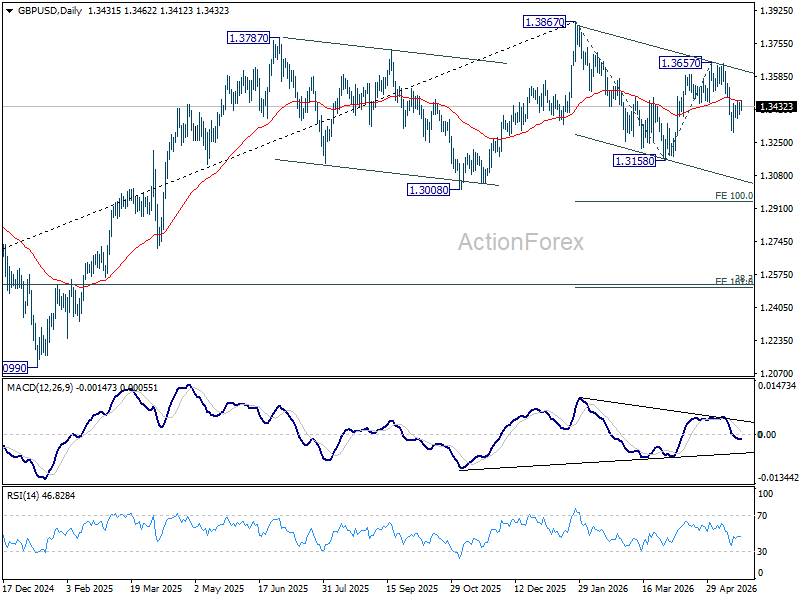
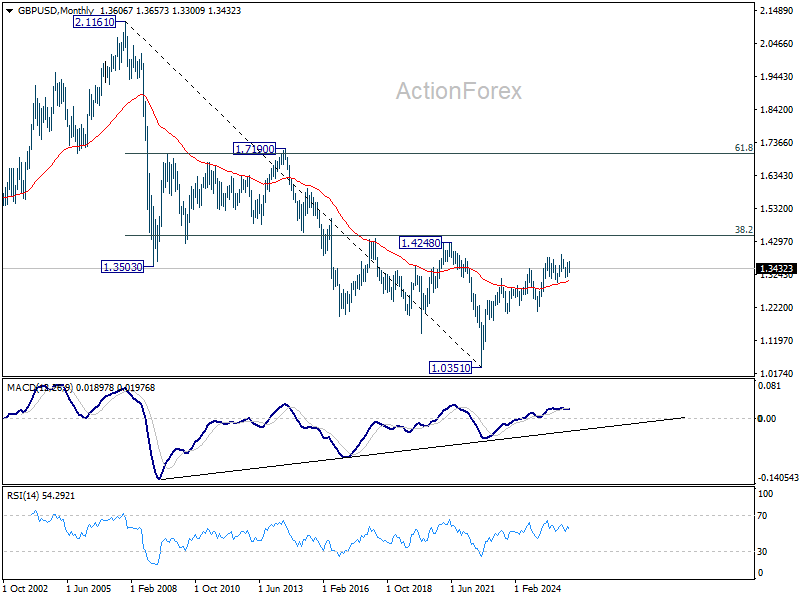
In the long term picture, as long as 1.4248/4480 resistance zone holds (38.2% retracement of 2.1161 to 1.0351 at 1.4480), the long term outlook will remain bearish. That is, price actions from 1.0351 are seen as a corrective pattern to down trend from 2.1161 (2007 high) only. Nevertheless, decisive break of 1.4248/4480 will be a strong sign of long term bullish reversal.
USD/CHF Weekly Outlook
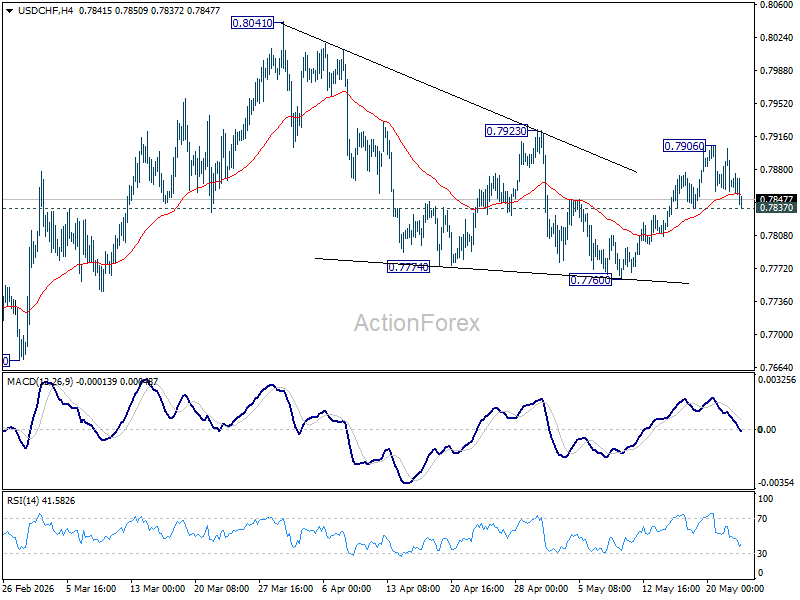
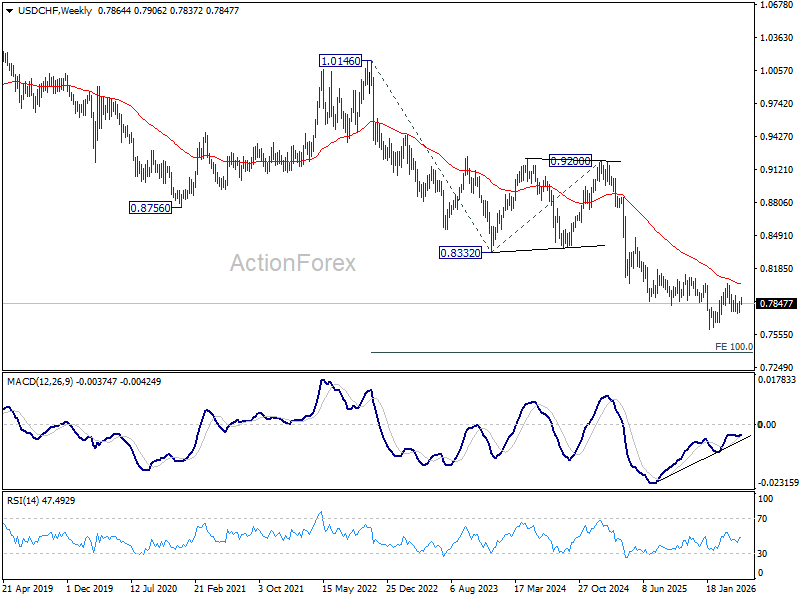
USD/CHF rebounded to 0.7906 last week but failed to break through 0.7923 resistance and retreated. Initial bias remains neutral this week first. On the downside, firm break of 0.7837 will suggest that the rebound has completed, and bring deeper fall back to 0.7760. Nevertheless, decisive break of 0.7923 will argue that that correction from 0.8741 has completed and bring stronger rally back to this resistance.
In the bigger picture, as long as 55 W EMA (now at 0.8035) holds, fall from 0.9200 is expected to continue, as part of the larger down trend. Firm break of 0.7603 will target 100% projection of 1.0146 (2022 high) to 0.8332 from 0.9200 at 0.7382.
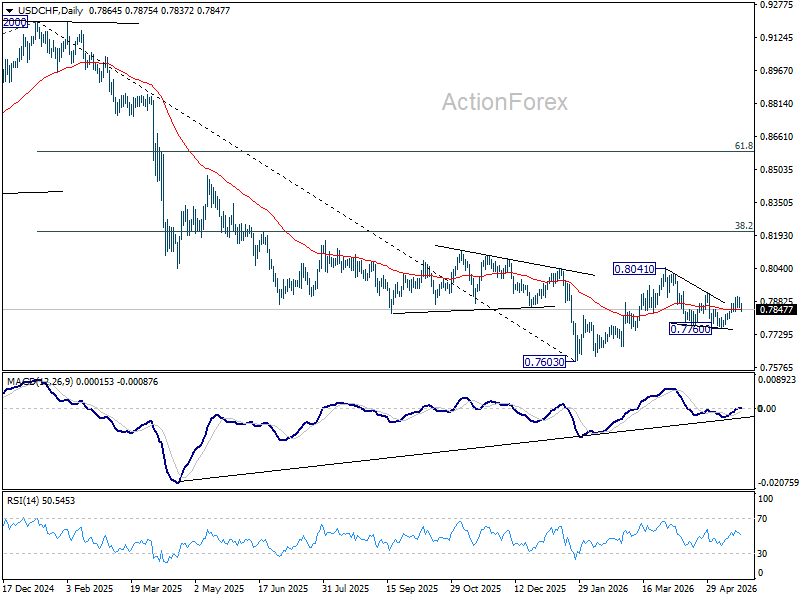
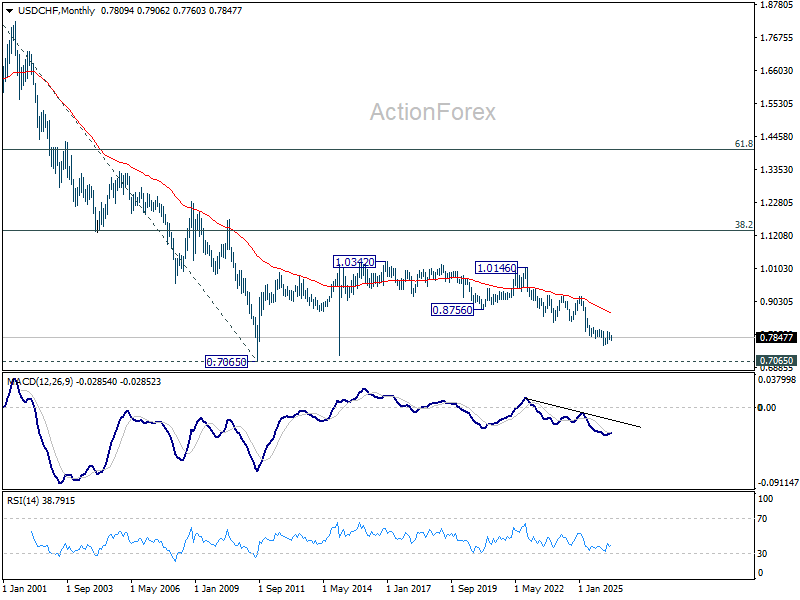
In the long term picture, price action from 0.7065 (2011 low) are seen as a corrective pattern to the multi-decade down trend from 1.8305 (2000 high). It's uncertain if the fall from 1.0342 is the second leg of the pattern, or resumption of the downtrend. But in either case, outlook will stay bearish as long as 0.8756 support turned resistance holds (2021 low). Retest of 0.7065 should be seen next.
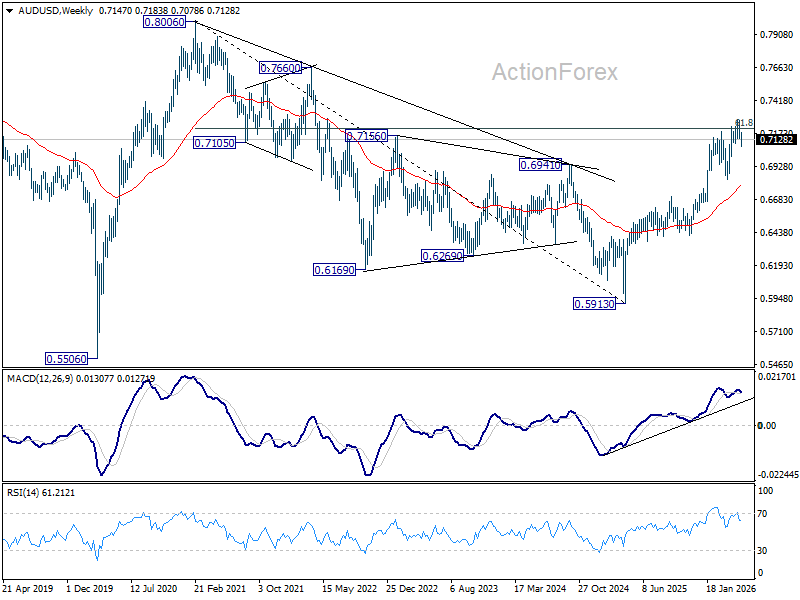
AUD/USD Weekly Report
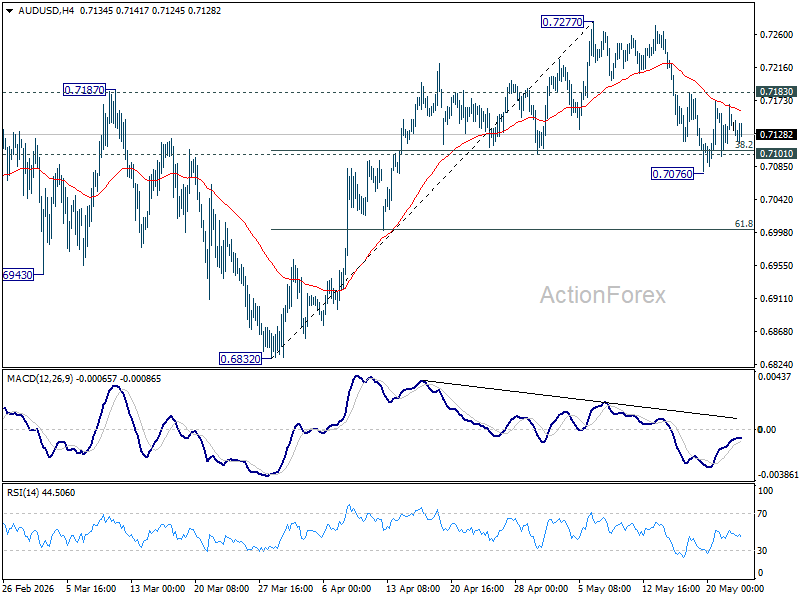
AUD/USD fell to 0.7076 last week but quickly recovered after drawing support from 0.7101. Initial bias stays neutral this week first. On the upside, firm break of 0.7183 resistance will bring stronger rebound to retest 0.7277 high. However, decisive break of 0.7076 will indicate that larger scale correction is underway and target 0.6832 support instead.
In the bigger picture, rise from 0.5913 (2024 low) is still in progress. Decisive break of 61.8% retracement of 0.8006 to 0.5913 at 0.7206 will solidify the case that it's already reversing the down trend from 0.8006 (2021 high). Further rally should then be seen to retest 0.8006. For now, outlook will remain bullish as long as 0.6832 support holds, in case of pullback.
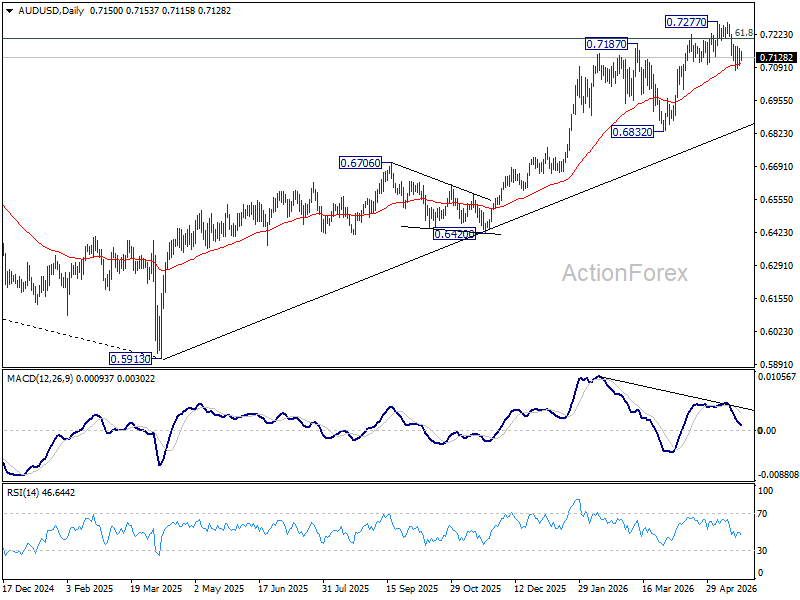
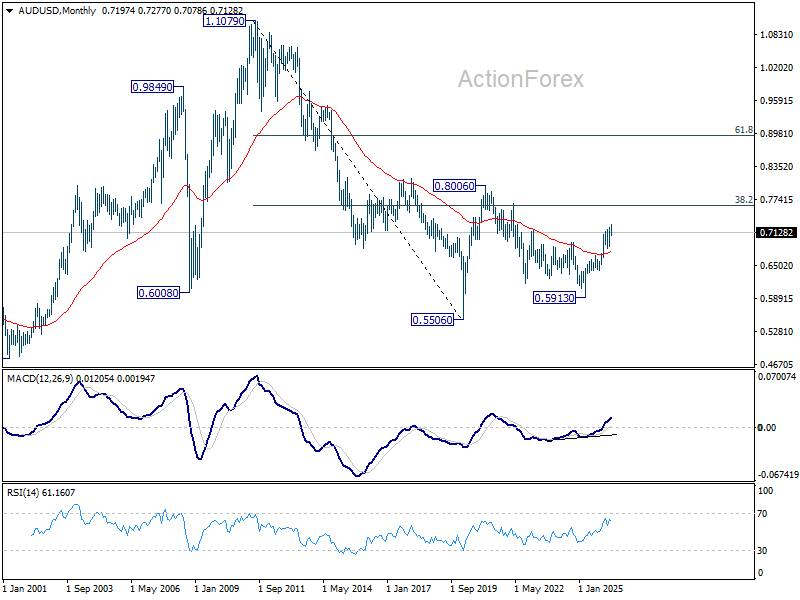
In the long term picture, rise from 0.5913 is seen as the third leg of the whole pattern from 0.5506 (2020 low). It's still early to judge if this is an impulsive or corrective pattern. But in either case, further rise should be seen back to 0.8006 and possibly above. This will remain the favored case as long as 55 W EMA (now at 0.6790) holds.
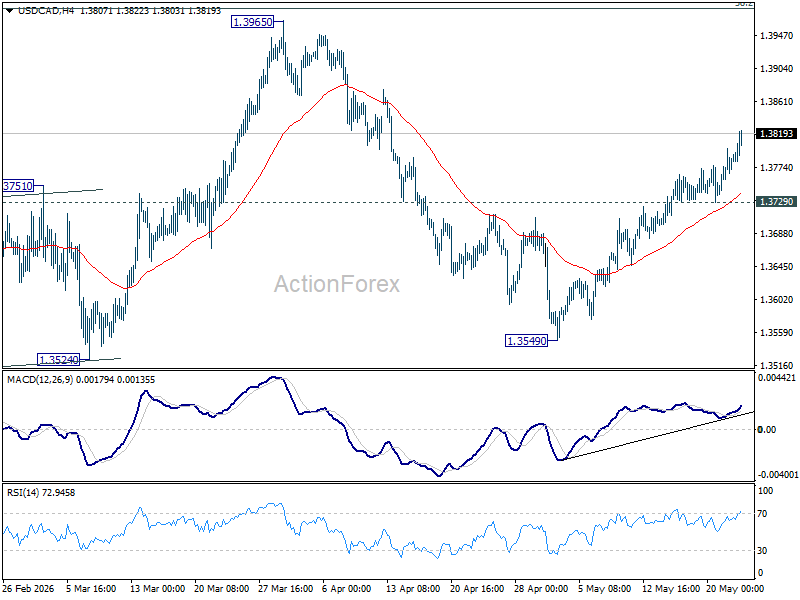
USD/CAD Weekly Outlook
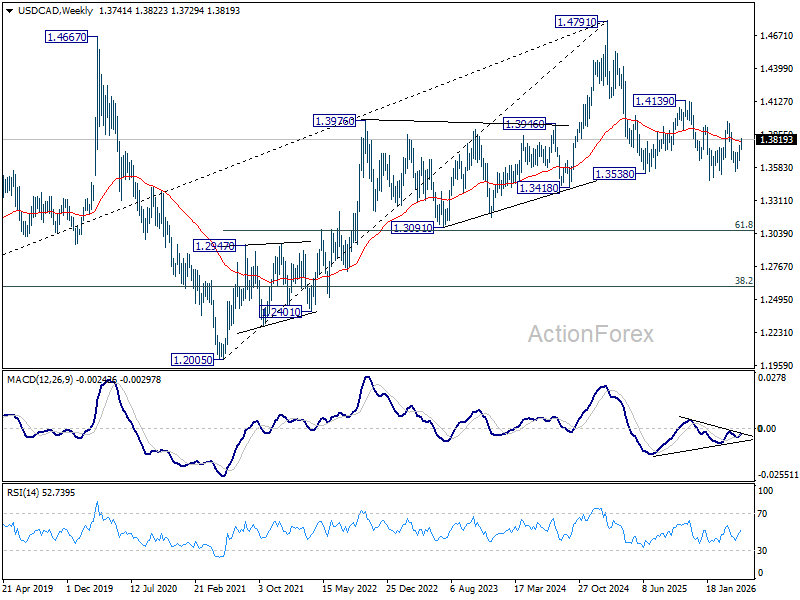
USD/CAD's rebound from 1.3549 extended higher last week. The rise is seen as the third leg of the pattern from 1.3480. Initial bias stays on the upside for 1.3965 resistance next. On the downside, below 1.3729 support will turn intraday bias neutral first.
In the bigger picture, price actions from 1.4791 are seen as a corrective pattern to the whole up trend from 1.2005 (2021 low). Deeper fall could be seen, as the pattern extends, to 61.8% retracement of 1.2005 to 1.4791 at 1.3069. However, decisive break of 38.2% retracement of 1.4791 to 1.3480 at 1.3981 will argue that the correction has completed with three waves down to 1.3480 already.
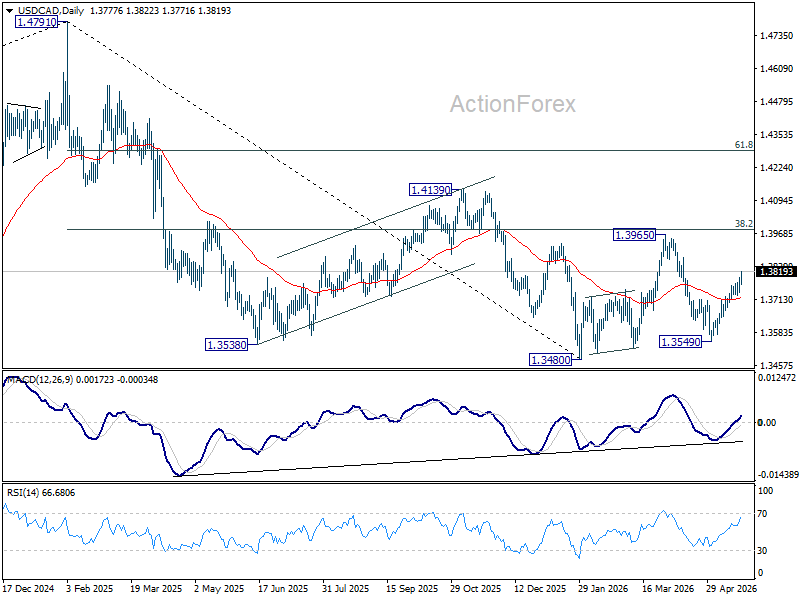
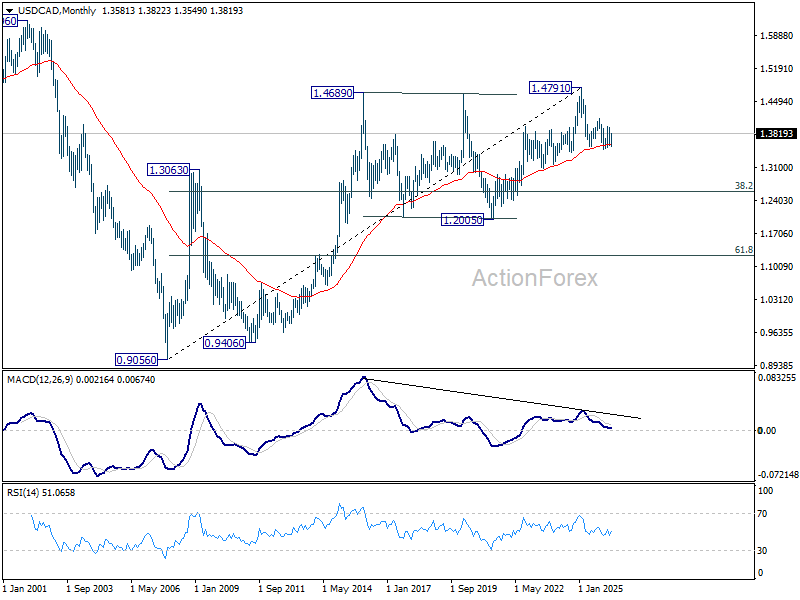
In the long term picture, rising 55 M EMA (now at 1.3581) remains intact. Thus, up trend from 0.9056 (2007 low) could still be in progress. However, considering bearish divergence condition M MACD, sustained trading below 55 M EMA will argue that the up trend has completed with five waves up to 1.4791, and turn medium term outlook bearish for correction to 38.2% retracement of 0.9056 to 1.4791 at 1.2600.
GBP/JPY Weekly Outlook
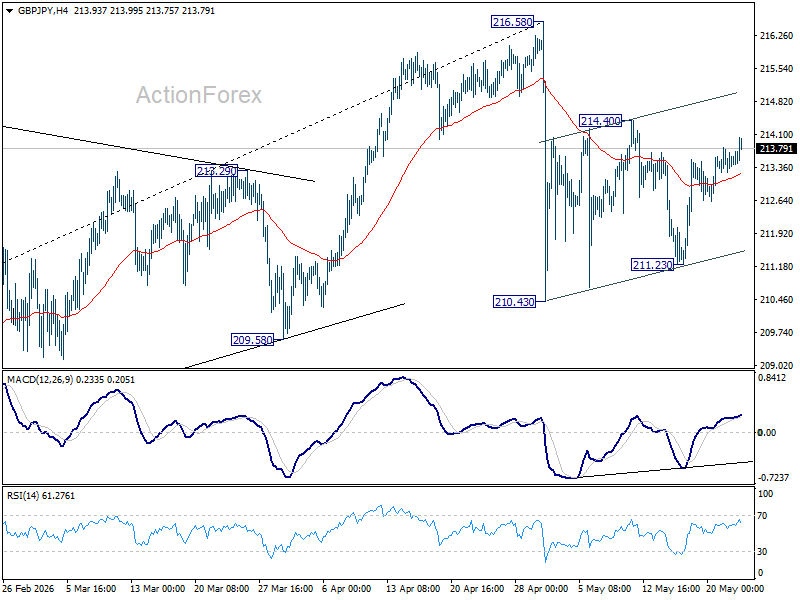
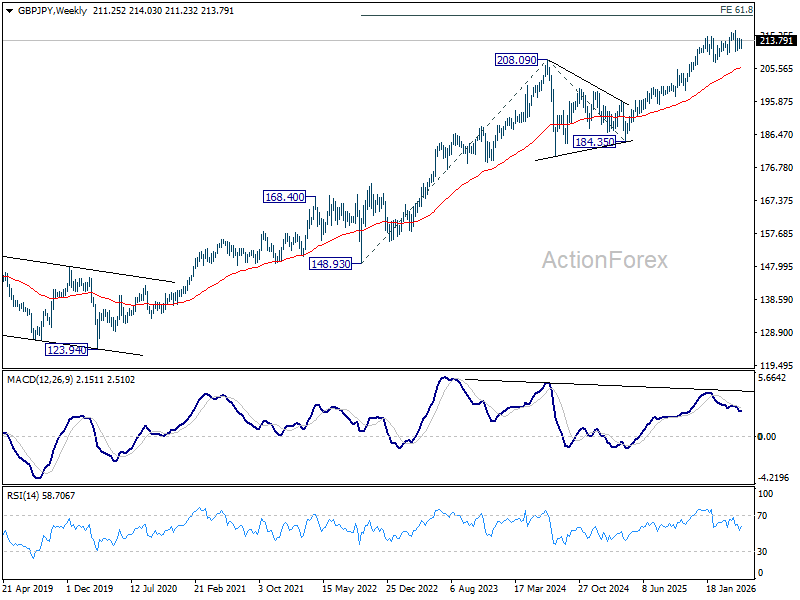
Range trading continued in GBP/JPY last week and outlook is unchanged. Corrective pattern from 216.58 is still extending. Above 214.40 will extend the rebound from 210.43 to retest 216.58. On the downside, break of 211.23 will bring deeper fall through 210.43 instead.
In the bigger picture, while the fall from 216.58 is steep, there is no clear sign of trend reversal yet. The long term up trend could still extend to 61.8% projection of 148.93 (2022 low) to 208.09 (2024 high) from 184.35 at 220.90 on resumption. However, sustained break of 55 W EMA (now at 205.91) will argue that it's already in medium term down trend for 184.35 support.
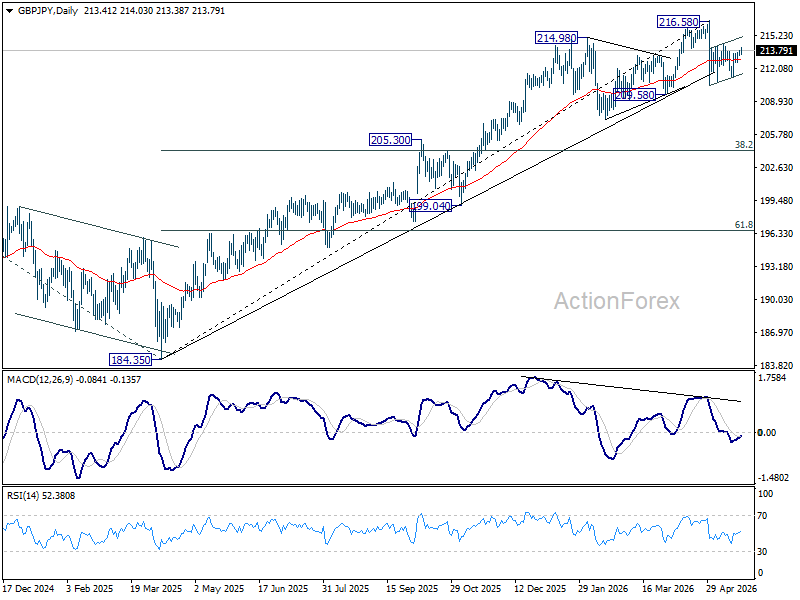
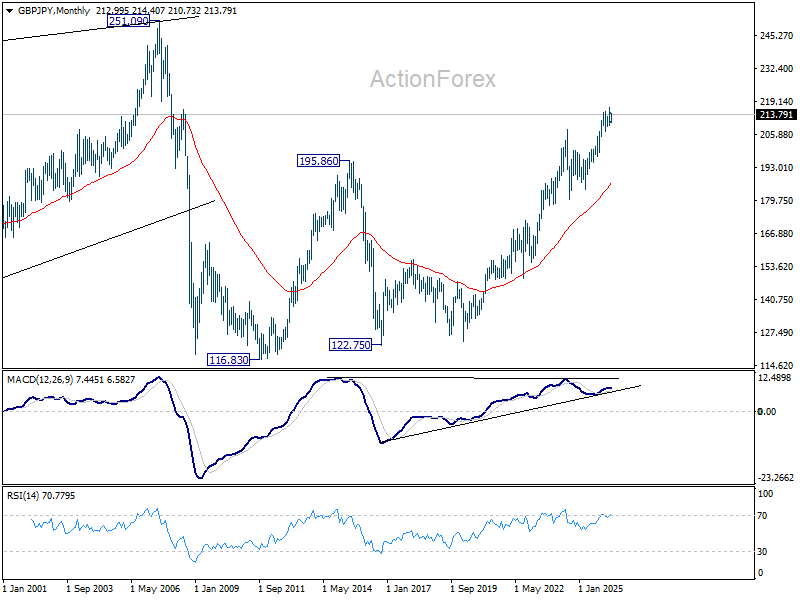
In the long term picture, up trend from 116.83 (2011 low) is in progress. Next target is 251.09 (2007 high). This will remain the favored case as long as 55 M EMA (now at 186.82) holds.
EUR/JPY Weekly Outlook
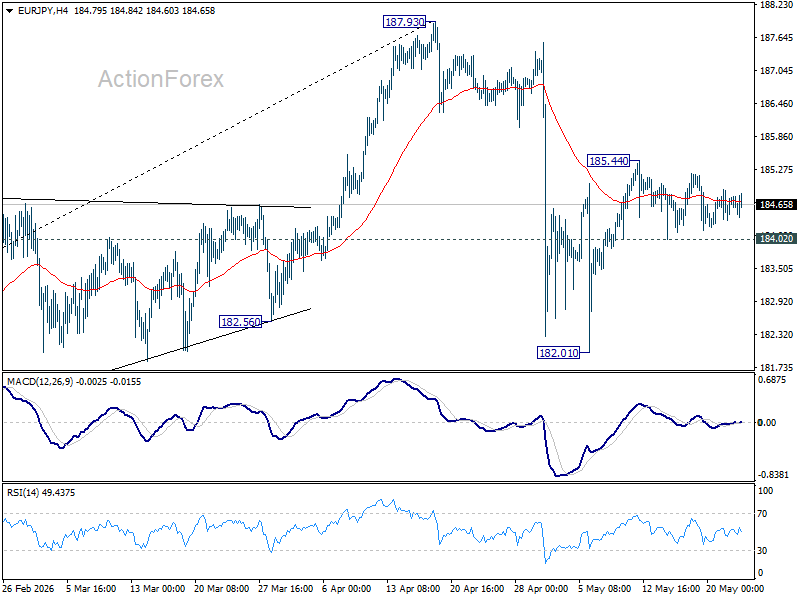
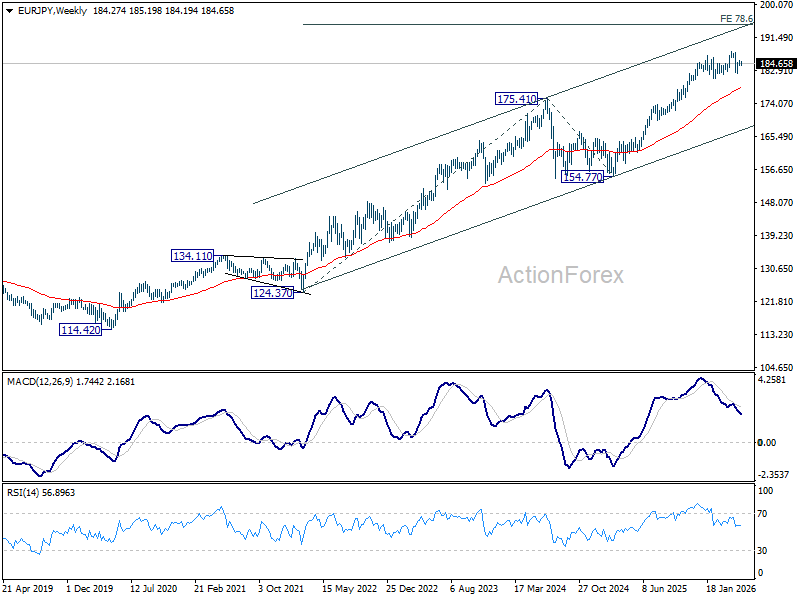
EUR/JPY was bounded in range below 185.44 last week and outlook is unchanged. Initial bias remains neutral this week first. Fall from 187.93 should have completed at 182.01. Above 185.44 will extend the rebound from there to retest 187.93. However, firm break of 184.02 support will bring deeper decline back to 182.01.
In the bigger picture, the pullback from 187.93 is steep, there is no sign of reversal yet. Uptrend from 114.42 (2020 low) is still expected to resume at a later stage to 78.6% projection of 124.37 (2022 low) to 175.41 (2025 high) from 154.77 at 194.88. However, sustained break of 55 W EMA (now at 178.27) will argue that it's already in a medium term down trend to 175.41 resistance turned support and below.
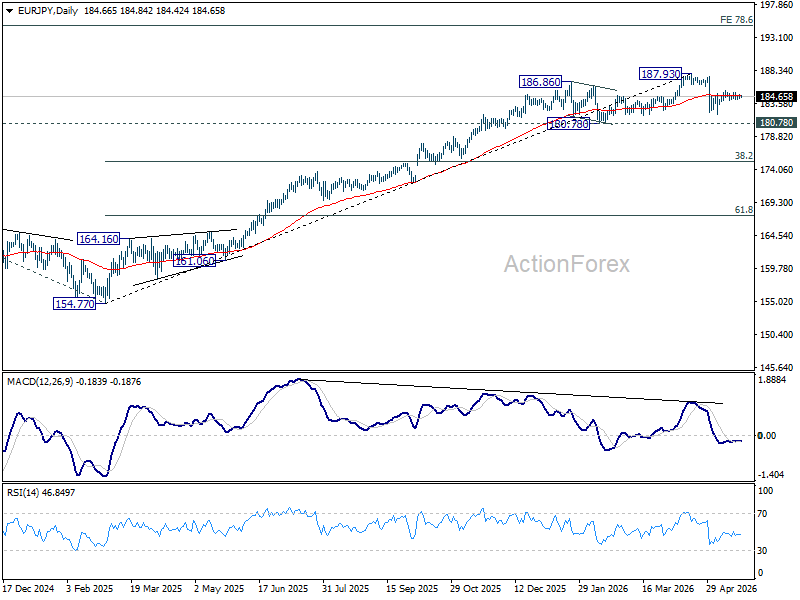
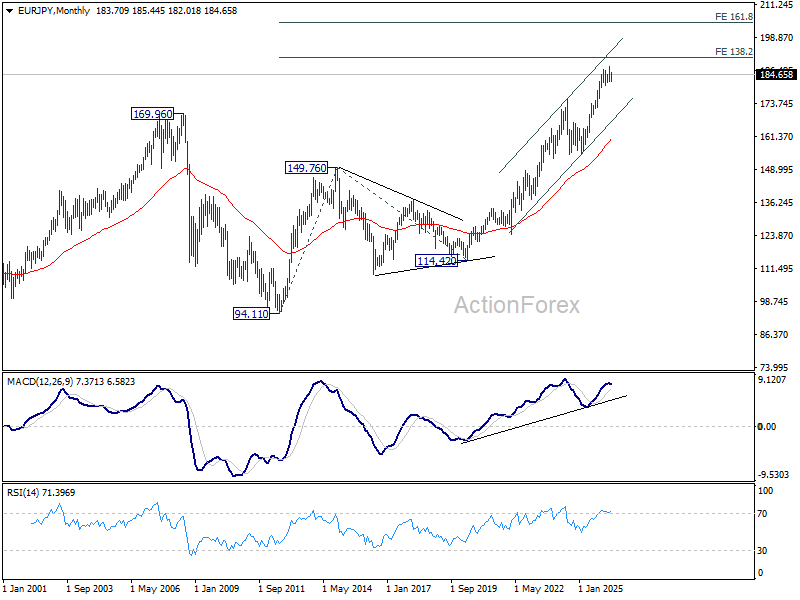
In the long term picture, up trend from 94.11 (2021 low) is in progress. Next target is 138.2% projection of 94.11 to 149.76 (2014 high) from 114.42 (2020 low) at 191.32. This will remain the favored case as long 55 W EMA (now at 178.27) holds.
EUR/GBP Weekly Outlook
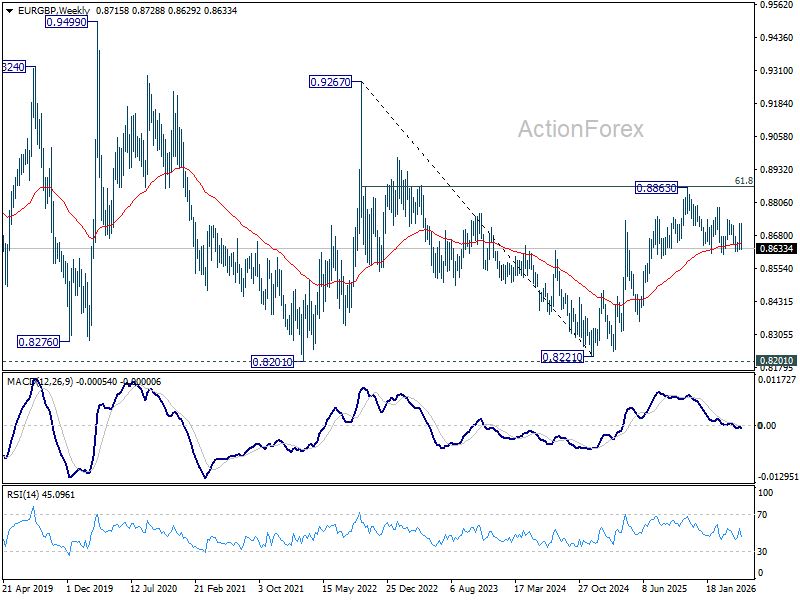
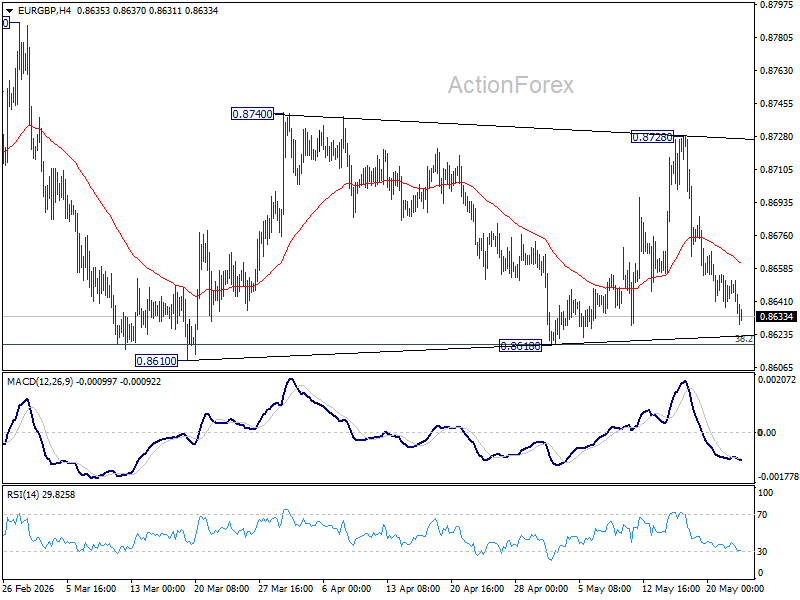
EUR/GBP stayed in range trading last week. Initial bias remains neutral first. On the downside, decisive break of 0.8610 support will revive the case of bearish trend reversal. On the upside, break of 0.8728 resistance will bring stronger rally back towards 0.8740 resistance.
In the bigger picture, focus is staying on 38.2% retracement of 0.8821 to 0.8863 at 0.8618. Strong rebound from there will retain medium term bullishness. Rise from 0.8221 should resume through 0.8863 at a later stage. Nevertheless, sustained break of 0.8618 will confirm that whole rise from 0.8221 has completed at 0.8863. Deeper decline should then be seen to 61.8% retracement at 0.8466 at least.
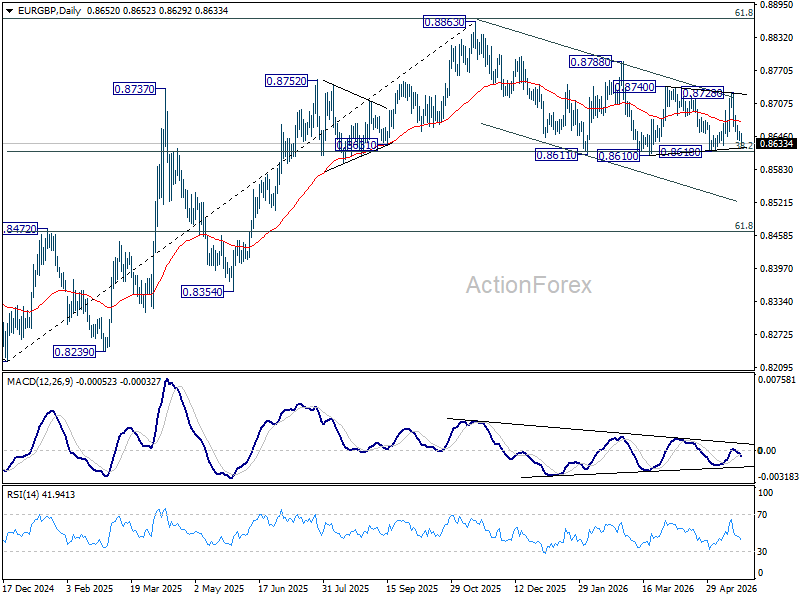
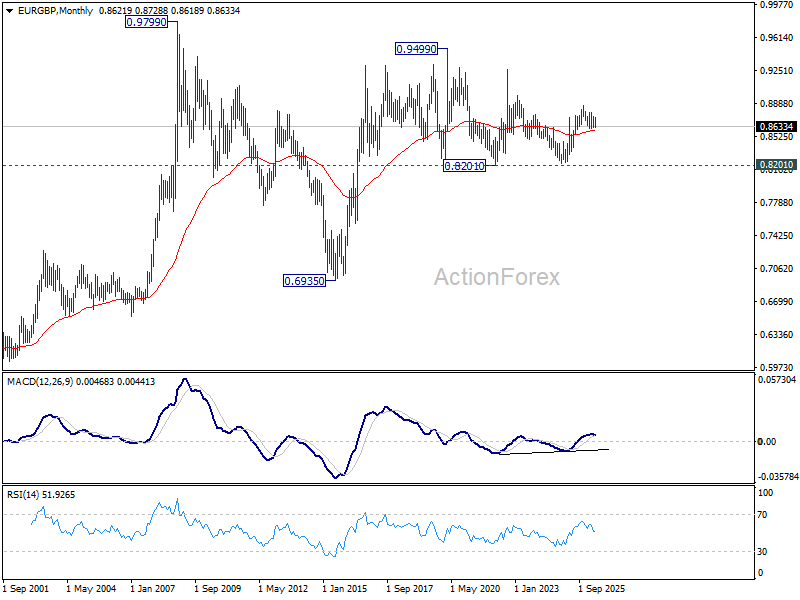
In the long term picture, price action from 0.9499 (2020 high) is seen as part of the long term range pattern from 0.9799 (2008 high). Range trading should continue between 0.8201 and 0.9499, until there is clear signal of imminent breakout.