Sample Category Title
US Dollar Consolidates Ahead of FOMC Minutes Release
The US dollar has entered a period of consolidation following last week's sharp price swings, as market participants turn their attention to the release of the Federal Reserve's latest meeting minutes. Investors are looking for additional guidance on the future path of interest rates and whether support for a hawkish monetary policy stance remains widespread within the Fed.
Further uncertainty was created by last week's mixed US labour market data, which raised concerns about the resilience of the US economy but did not trigger a significant reassessment of Federal Reserve policy expectations. Attention has now shifted to the FOMC minutes, with traders focusing on the Fed's assessment of inflation risks and its outlook for future interest rate decisions. Confirmation of a hawkish stance could provide fresh support for the US dollar, while a more cautious assessment of economic conditions may strengthen expectations of future policy easing.
USD/JPY
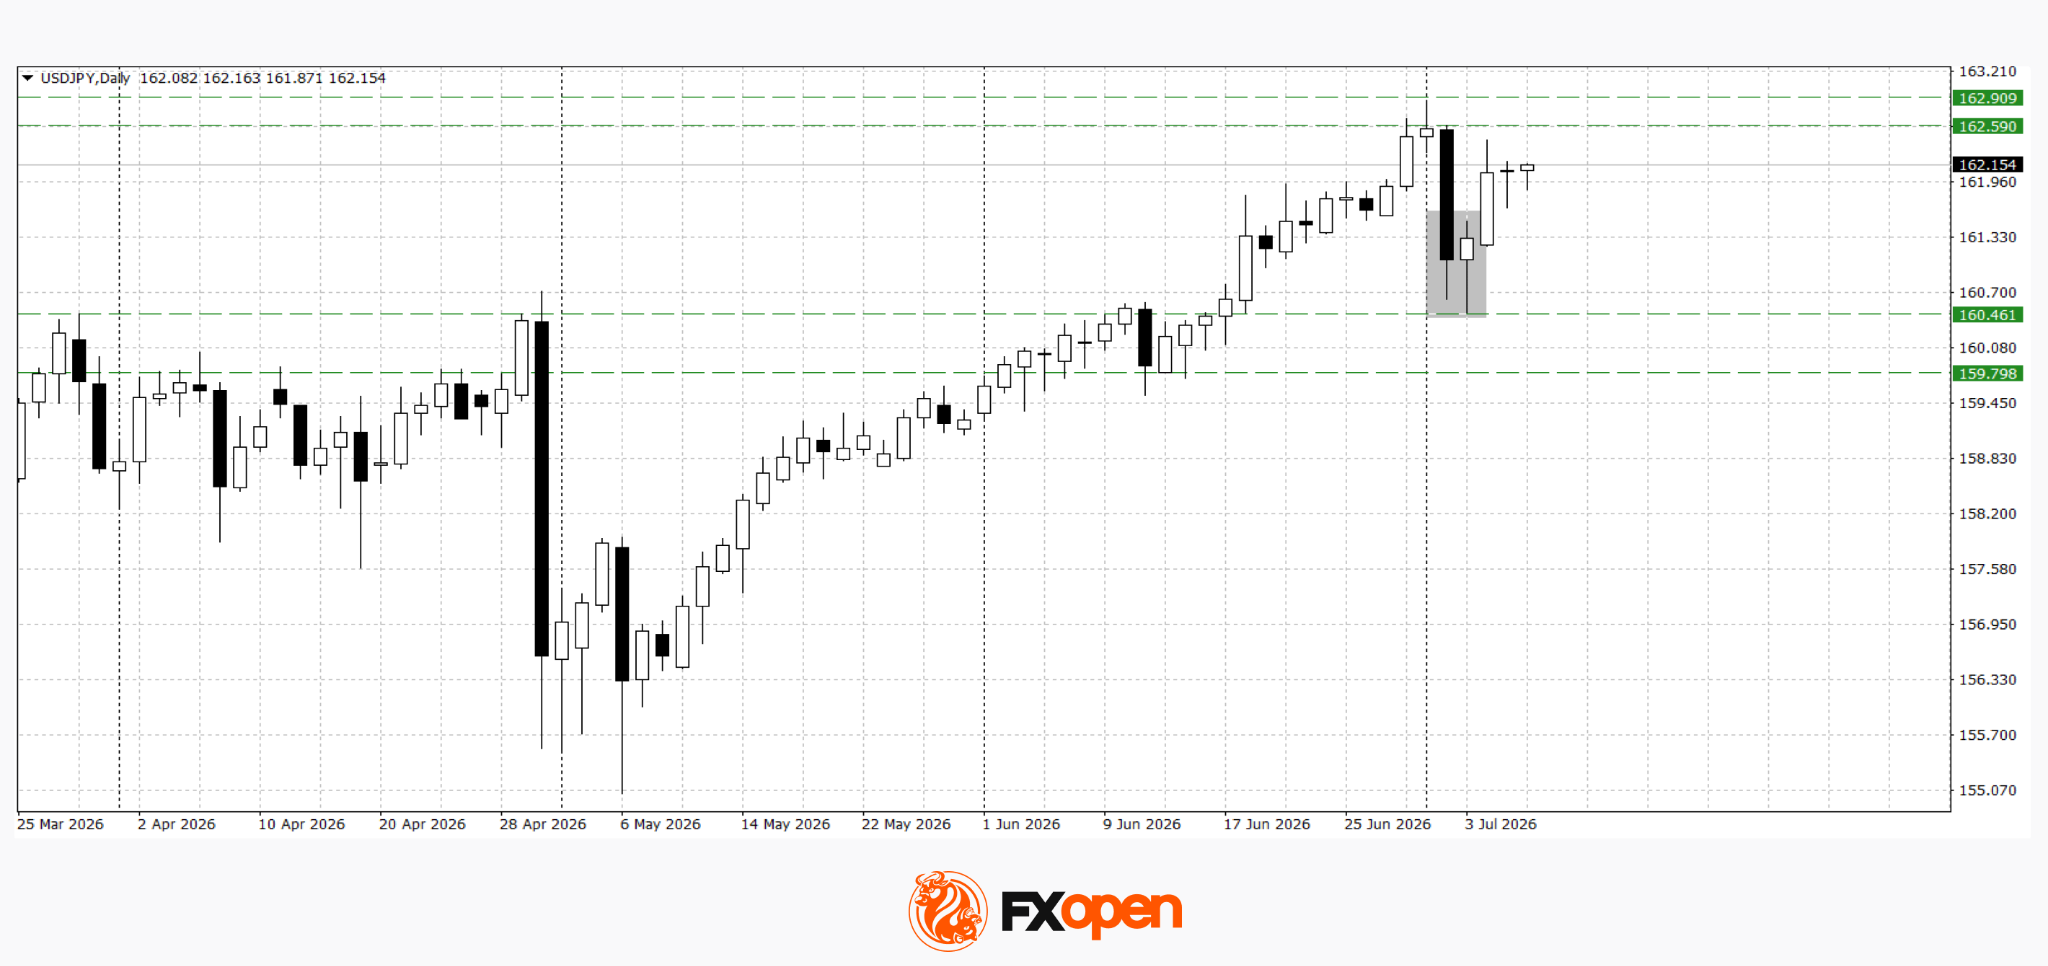
Against this backdrop, USD/JPY is consolidating after retreating sharply from multi-year highs. The yen remains under pressure due to the wide interest rate differential between the United States and Japan. However, with the pair trading close to multi-year highs, concerns over possible intervention by the Japanese authorities continue to limit further upside.
From a technical perspective, USD/JPY may retest the 162.60–162.90 area after forming a Piercing Line candlestick pattern on the daily chart following the recent pullback. A deeper correction would become more likely if the pair closes decisively below 160.50.
Key events for USD/JPY:
- Today, 14:00 (GMT+3): MBA Weekly Mortgage Applications (US)
- Today, 21:00 (GMT+3): FOMC meeting minutes
- Tomorrow, 02:50 (GMT+3): Japan Foreign Bond Investment
USD/CAD
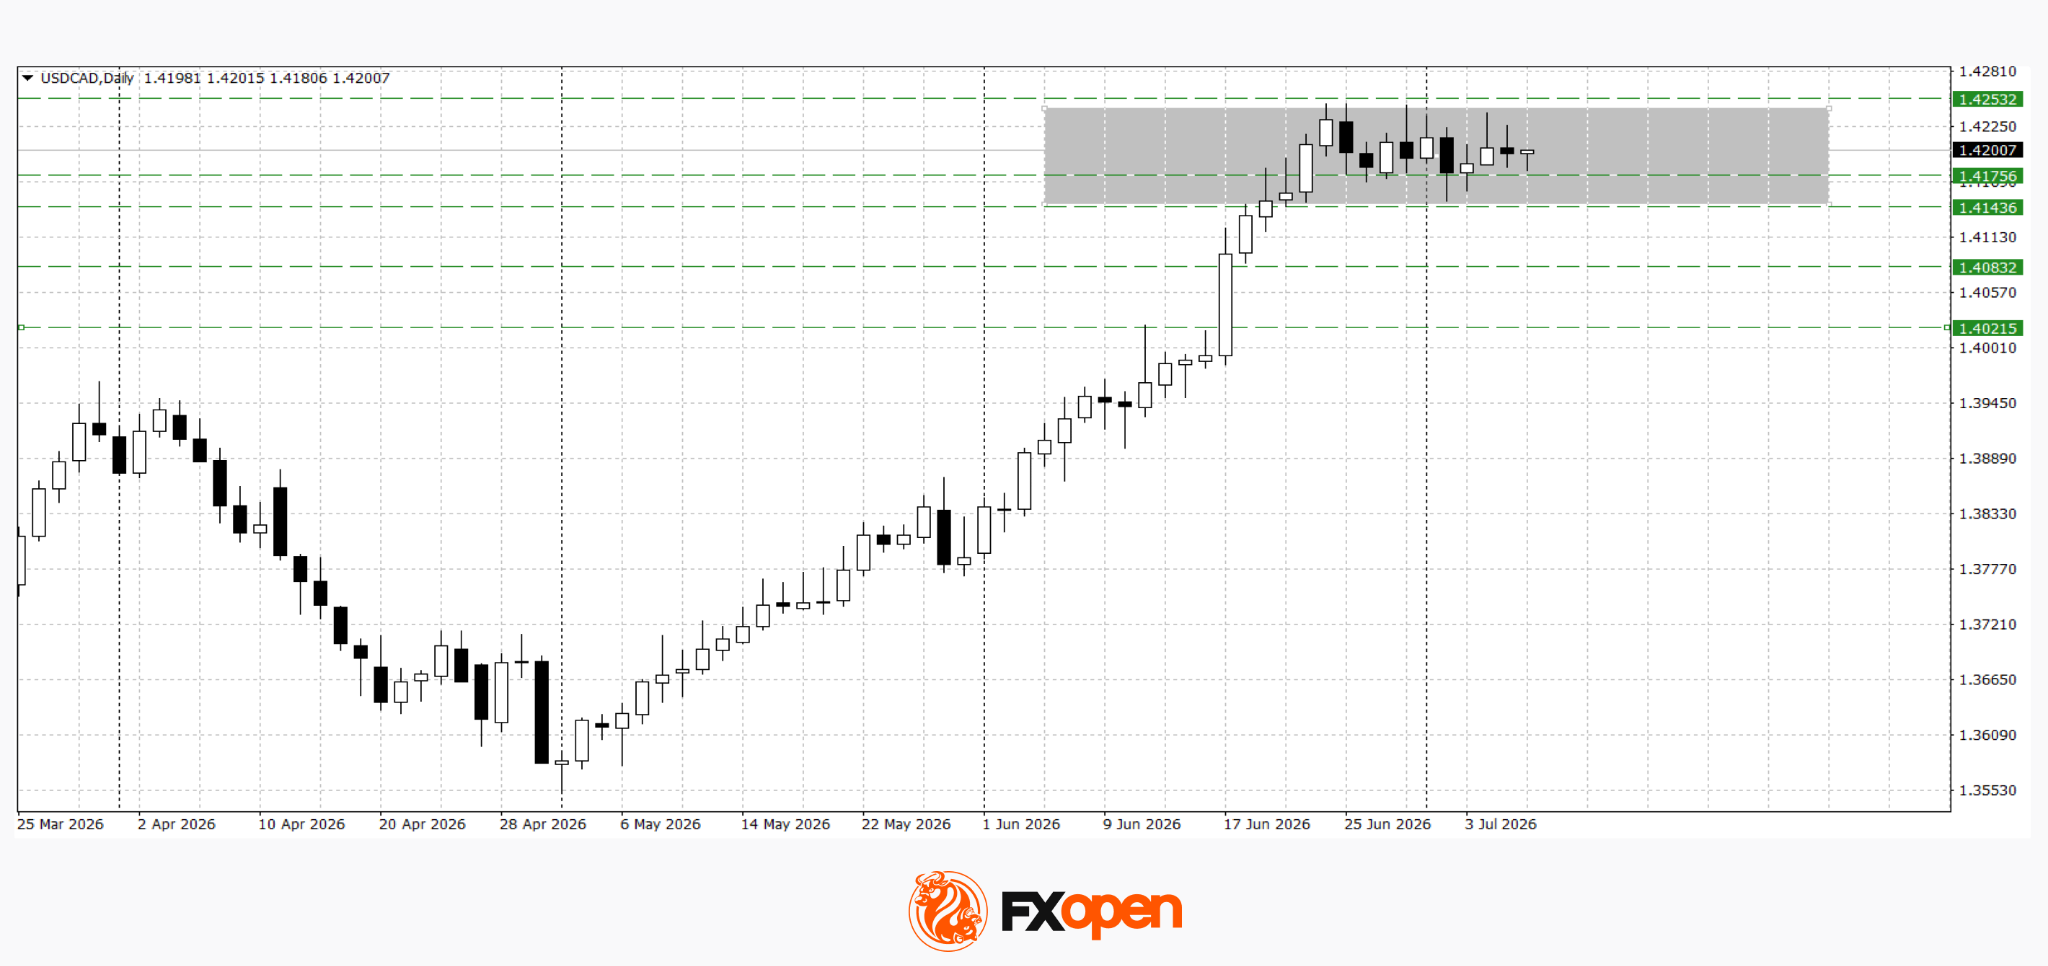
USD/CAD continues to trade sideways within the 1.4140–1.4250 range, suggesting the market is building momentum for a potential breakout. A sustained move above 1.4250 would open the door for further gains towards 1.4300–1.4400. Conversely, a break below 1.4140 could trigger a deeper correction towards the 1.4020–1.4080 region.
Key events for USD/CAD:
- Today, 17:30 (GMT+3): US Crude Oil Inventories
- Tomorrow, 15:30 (GMT+3): US Initial Jobless Claims
- Tomorrow, 17:00 (GMT+3): US Existing Home Sales
The US dollar remains in a holding pattern ahead of the release of the FOMC minutes, which could become the key catalyst for its next move. If the document confirms that Fed officials remain concerned about persistent inflation and continue to favour a hawkish policy stance, the dollar could receive renewed support. On the other hand, a more cautious assessment of the economy and the monetary policy outlook may encourage profit-taking on long dollar positions and lead to a broader corrective move.
Trade over 50 forex markets 24 hours a day with FXOpen. Take advantage of low commissions, deep liquidity, and spreads from 0.0 pips (additional fees may apply). Open your FXOpen account now or learn more about trading forex with FXOpen.
This article represents the opinion of the Companies operating under the FXOpen brand only. It is not to be construed as an offer, solicitation, or recommendation with respect to products and services provided by the Companies operating under the FXOpen brand, nor is it to be considered financial advice.
Sunrise Market Commentary
Markets
The ceasefire and by extension the interim agreement between the US and Iran is under renewed pressure. Iran yesterday attacked three ships that were following an Omani coastline route through the Strait of Hormuz. Tehran, however, said repeatedly it would only allow transit through designated Iranian routes in its attempt to control as much of the waterway as possible. The US responded by revoking the June 21 Iranian oil waiver that allowed the country to sell the product free of sanctions. The US military shortly after conducted a series of strikes targeting 80+ sites, prompting an Iranian tit-for-tat reaction. It serves as a reminder of the fragility of the talks as well as underscores how deep the divide between the parties still is. With the decline in oil prices beginning to look a bit stretched, the recent developments are now triggering a correction higher. Brent is currently trading around $76.5/b compared to $70 levels earlier this month. It also means the likes of the ECB can't lower their guard just yet. Several policymakers including Lagarde have warned for the risk of a re-escalation of the conflict. Others, including Lane and Schnabel, are worried about price pressures that are still in the pipeline while oil prices and futures have not yet normalized to pre-war levels, even when they were at their lowest. US Treasury yields were already inching higher and drew additional support from the increased oil price. Net daily changes varied between 7.1 and 8.8 bps. European yields added 4–5 bps across the curve and have yet to respond to the geopolitical news flow. Bund futures in any case suggest a higher open for German rates. The US dollar traded with a slight edge compared to global peers, be it in technically insignificant trading. EUR/USD dipped to 1.1412. USD/JPY stabilized around 162.1, just shy of the 40-year lows (for the yen) seen a few days ago. DXY recovered to north of 101. Sterling's strong rally met with resistance around 0.8544 (50% EUR/GBP retracement on the 2024–2025 rally) and is currently trending lower. The jury's out whether the honeymoon period has ended. We do pick up yesterday's warning from the UK's budget watchdog (Office for Budget Responsibility) in a latest indication that fiscal sustainability is returning as a market-relevant theme. It said the UK's debt trajectory would move onto "an unsustainable and ever-rising path" in almost all scenarios. Stabilizing debt at 95% of GDP (current OBR baseline) from the end of the forecast horizon (2030–2031) onwards would require spending cuts or tax increases equivalent to more than £100bn a year. Gilts, for that matter, did underperform slightly yesterday (up to +5.5 bps).
News & Views
The Reserve Bank of New Zealand (RBNZ) raised its policy rate by 25 bps to 2.5%. The hike was expected and in some way it was also already flagged in the May policy statement. Inflation risks have eased, and some removal of policy accommodation is warranted as the effects of the price shock will linger for some time and the outlook for medium-term inflation pressures remains uncertain. The RBNZ expects economic activity growth to resume after the Middle East conflict weighed during the April–June quarter. The outlook for medium-term inflation depends on the extent to which recent cost increases will feed through to prices. Some might look to rebuild margins. Especially non-tradable goods inflation was and remains a source of concern. The RBNZ now expects inflation to peak at 3.9% in the June quarter before easing to 3.3% in Q3. In May it forecasted inflation to peak at 4.3% in Q3. The RBNZ guides that some further reduction in monetary stimulus is likely to be required to return inflation to the 2% mid-point target. The market sees a second rate hike by October and an additional step in spring next year. The kiwi dollar rebounds from the 0.5675 area at the start of trading this morning to currently 0.571.
(Geo)political uncertainty both at home and overseas continued shaping higher trends in the June KPMG and REC UK report on Jobs. Subdued business confidence caused firms to prefer short-term staff, with temp billings rising at the steepest rate in over three years. At the same time, permanent staff appointments continued to decline. Overall demand for staff weakened at a quicker rate due to a steeper reduction in permanent job vacancies. Job losses contributed to a further increase in candidate availability. Pay trends improved, with employers raising starting salaries and wages at quicker rates as they sought to attract and secure candidates with sought-after skills. Overall KPMG & REC assessed the report as encouraging, containing some hopeful signs as temporary hiring reacts to demand even as firms are not confident enough yet to commit to larger-scale permanent hiring.
RBNZ July 2026 Monetary Policy Review: Dovish Hike?
- The RBNZ raised the OCR by 25bps to 2.5%. The decision was reached by consensus.
- The balance of the Committee seems unchanged: Gai, Gourley and Hansen remain hawkish while Breman, Conway and Silk remain more dovish.
- A key argument for the hike is a concern that financial conditions would have eased further if the OCR was left unchanged.
- The MPC seems to be comfortable with an end 2026 level of the OCR in the 2.75%-3% range - not very different from that shown in the May forecasts.
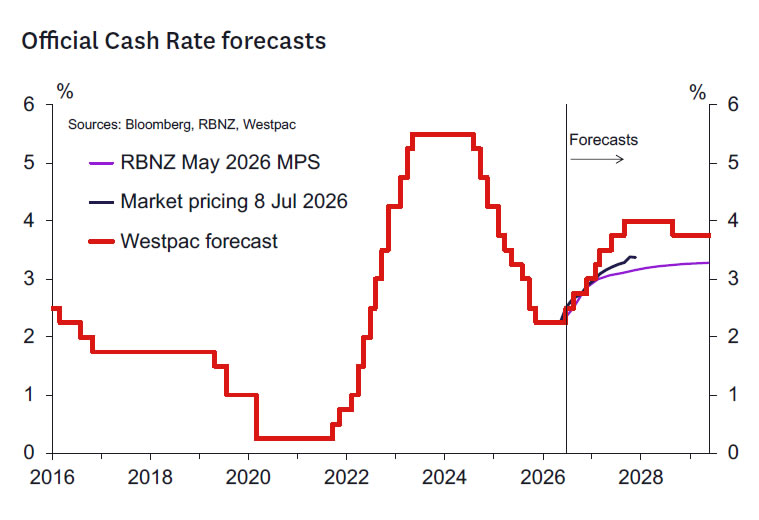
- Westpac expects follow-up 25bp hikes in September and December and an unchanged sequence of 25bp increases through 2027. Hence the peak OCR of 4% is reached in September, instead of December 2027.
OCR Raised by 25bps to 2.50%
Today the RBNZ raised the OCR by 25bps to 2.50%, in contrast to our expectations for an 'on hold' decision. The decision was reached by consensus and hence no vote was required.
A comparison of key quotes from the July MPR statement and Record of Meeting with that from the May MPS meeting is provided at the end of this document.
The RBNZ has recognised the fall in oil prices and inflation risks that has been seen since May. Their forecasts for inflation have been revised down such that annual inflation is expected to be 3.9% in Q2 and 3.3% in Q3. These forecasts are a bit lower than our own (3.7% for Q3 in our case) but still demand OCR increases in 2026 by the MPC's thinking.
The RBNZ recognizes that the risks around the global growth outlook are better balanced relative to those seen back in May when energy prices were much higher.
A key argument cited as supporting the case for an OCR hike today was the risk that an unchanged OCR might have prompted a further easing in financial conditions. This could have occurred through some combination of expectations of a lower end 2026 OCR and a weaker exchange rate. This suggests the RBNZ remain comfortable with the end 2026 OCR in the 2.75-3% range given where market pricing has sat in the last week or so.
The RBNZ indicates some further tightening is likely over coming meetings but notes the timing of these interest rate increases remains uncertain. The strategy seems to be to bring the OCR back to the neutral zone. For now, an OCR in the low 3% area seems to be viewed as consistent with that objective. However, there is uncertainty around where the neutral OCR is. Prasanna Gai noted a risk the neutral rate is rising in this less certain geopolitical environment. Paul Conway noted in the press conference that short-term estimates of the neutral OCR are being boosted by the higher short term inflation profile and the resultant impact on short term inflation expectations.
The balance of the MPC appears unchanged: the hawks remain Gai, Gourley and Hansen while the more dovish group includes Breman, Silk and Conway. Gai and Gourley see upside risks to the inflation outlook while the rest see the inflation risks as better balanced.
The RBNZ's rhetoric on the key factors driving future OCR increases has shifted a little. In May the Governor emphasized the importance of indicators of second round pricing pressures, rising inflation expectations and wage pressures. No evidence has accumulated since May on these risks. Nevertheless, these factors are still seen as important, but now signs of strengthening domestic and global growth are being added to the list of relevant factors. Trends in financial conditions seem also to be on the list of relevant factors. The potential inflationary impact of the exchange rate is playing a role here.
The RBNZ also decided to bring forward slightly the time at which the LSAP portfolio will be fully extinguished to June 2027. This does not have any monetary policy implications and is portrayed as being largely technical in nature.
Westpac Outlook - 4% Peak in the OCR Reached a Little Earlier in 2027
Looking ahead, we continue to expect the 25bp increases in the OCR that we forecast prior to today's meeting - at the September and December meetings - although these will now leave the OCR 25bps higher at year end (at 3.0%) than we had forecast previously. Thereafter, we continue to forecast a peak OCR of 4.0% next year, although our central expectation is that this will now be reached three months earlier at the September 2027 MPS meeting. In the current uncertain environment, it goes without saying that the evolution of monetary policy will depend on how both global events and key data evolve (we summarise the near-term economic diary below). Therefore, as the RBNZ noted itself today, the exact timing of the tightening profile is highly uncertain and even the tightening we forecast at the September 2026 meeting should not be regarded as a "done deal".
Things to Watch Ahead of the 2 September Meeting
The RBNZ's next policy review is on 2 September, when it will also publish a full Monetary Policy Statement (MPS) and refreshed economic forecasts. How the RBNZ's policy stance evolves between now and then will depend on the path the Middle East conflict takes and what indicators and anecdotes continue to suggest about the impact of the conflict on New Zealand's economic recovery and inflation.
In contrast to the period ahead of today's meeting, there are many important domestic economic indicators scheduled for release ahead of the 2 September meeting. We think the following are the key ones to watch.
- Q2 CPI (21 July) and July Selected Prices (17 August): These pricing indicators will reveal whether the earlier surge in fuel prices has generated upward pressure across a broader range of goods and services.
- Q3 RBNZ surveys (13 August, 14 August, 21 August): Inflation expectations measures from the RBNZ's surveys of professional forecasters, households and businesses will be analysed closely to see whether there has been a reversal of the energy-induced increase in inflation expectations observed in Q2.
- Q2 QSBO (14 July) and July/August ANZ Business Outlook (30 July/31 August): The data-rich QSBO survey was likely in the field before Middle East tensions eased so it will be interesting to see where the NZIER provide a breakdown of early and late responses. The ANZ surveys may provide a timelier account of how businesses are responding to the easing of the conflict and the resulting decline in oil prices.
- July/August PMI and PSI surveys (mid-July/mid-August): These may provide some early insight as to whether GDP growth has resumed in Q3.
- Q2 labour market surveys (5 August): Employment and hours worked data from the HLFS and QES surveys will cast light on the performance of the economy in Q2, while the LCI will cast light on underlying inflation pressures.
In addition to the above, we will monitor a range of other high-frequency indicators, such as monthly data on filled jobs, consumer spending, building consents, housing market activity and prices, job ads and consumer confidence. We will also be paying close attention to developments in prices for New Zealand's key export commodities.
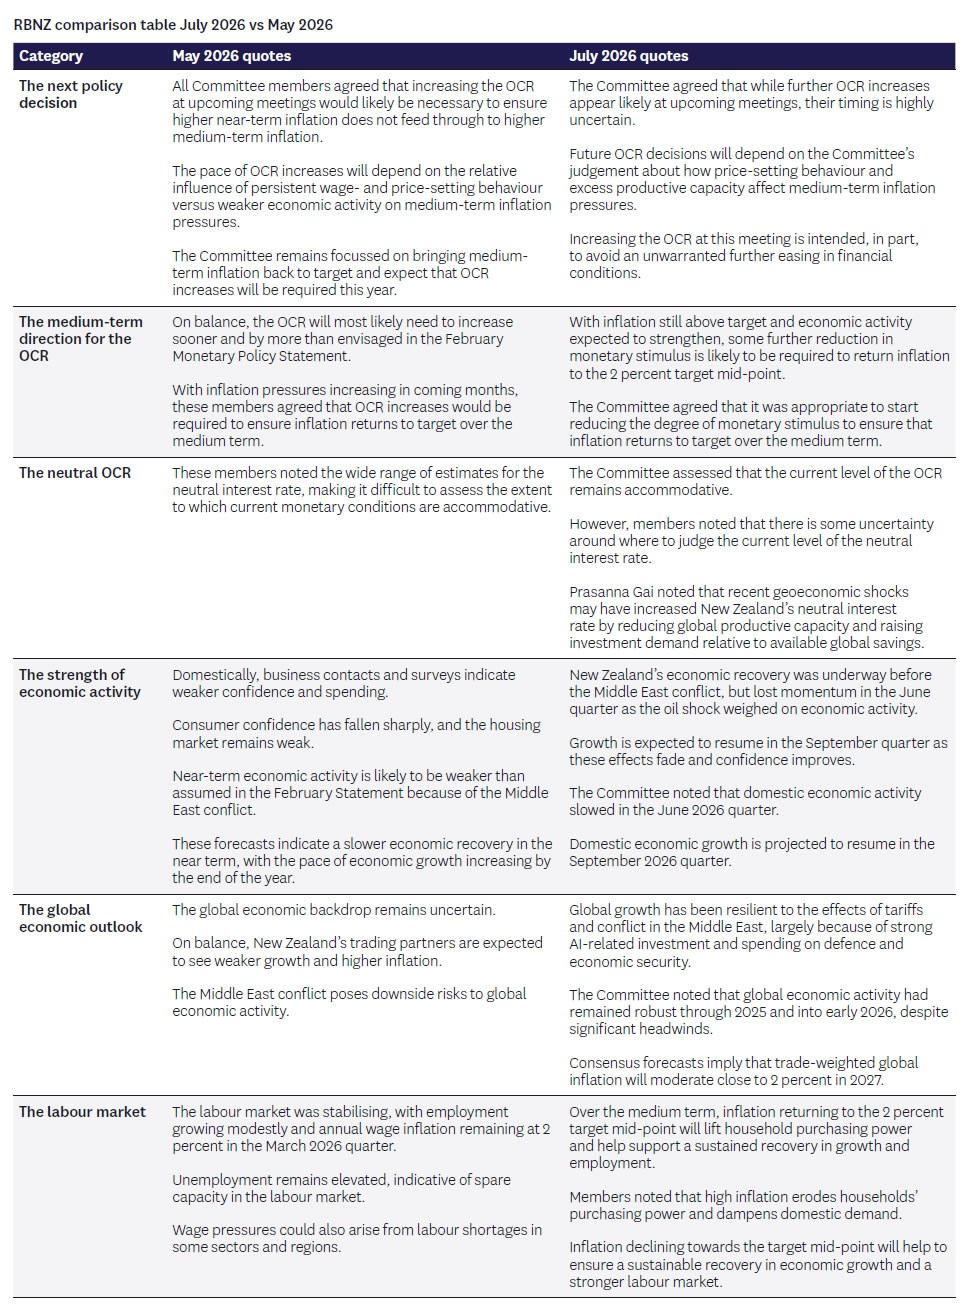
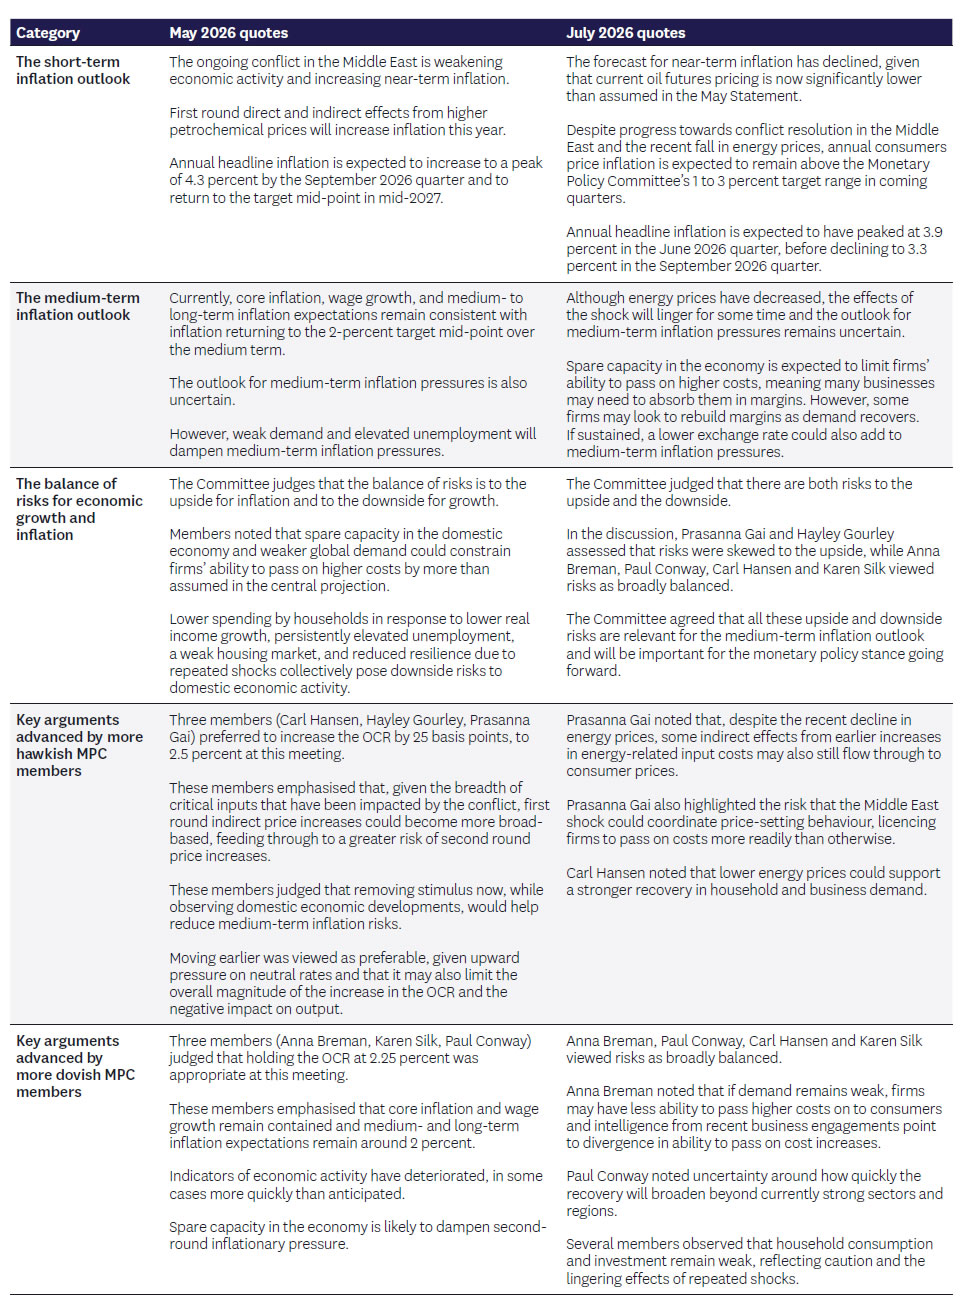
NZD/USD Recovers After RBNZ, but Higher Bar for Next Hike Caps Rally
The New Zealand dollar received the boost that normally accompanies a rate hike, but the rally quickly lost momentum. The Reserve Bank of New Zealand delivered a widely anticipated 25 basis point increase in the Official Cash Rate to 2.50%, yet investors stopped short of pricing a more aggressive tightening cycle. Instead, the market came away with the impression that while another hike is still likely, policymakers have set a considerably higher hurdle before taking the next step.
At first glance, the statement appeared hawkish. The Committee said "some further reduction in monetary stimulus is likely to be required" and that "further OCR increases appear likely at upcoming meetings." But those remarks were balanced by equally strong caveats. The RBNZ repeatedly emphasized that medium-term inflation remains uncertain and that future decisions will depend on incoming data, firms' price-setting behaviour and the strength of the recovery, adding that the timing of future hikes is "highly uncertain."
That balance was reflected in the Record of Meeting. While all six members agreed to raise the OCR, they were not fully aligned on the inflation outlook. Prasanna Gai and Hayley Gourley believed risks remained tilted to the upside. However, Governor Anna Breman, Chief Economist Paul Conway, Assistant Governor (Money) Karen Silk and external member Carl Hansen judged the risks to be broadly balanced instead.
Those differences matter because the balanced camp included the Governor and two of the Bank's most senior policy officials. Breman argued that weak demand could continue limiting businesses' ability to pass higher costs on to consumers. Conway questioned how quickly the recovery would spread beyond stronger parts of the economy even while acknowledging firms might eventually rebuild margins. Silk pointed to two-way risks, noting that a weaker exchange rate could add to imported inflation, but slower immigration could simultaneously restrain growth, housing and inflationary pressure. Together, their comments suggest the Committee is looking for clearer evidence that inflation is becoming genuinely persistent before tightening again.
That explains the Kiwi's muted reaction. The RBNZ reinforced its inflation-fighting credentials with another rate hike, but it deliberately avoided creating expectations of an automatic follow-up move. Investors appear to have concluded that policymakers are comfortable pausing at 2.50% until the data justify another increase, rather than feeling compelled to keep tightening simply because the cycle has begun.
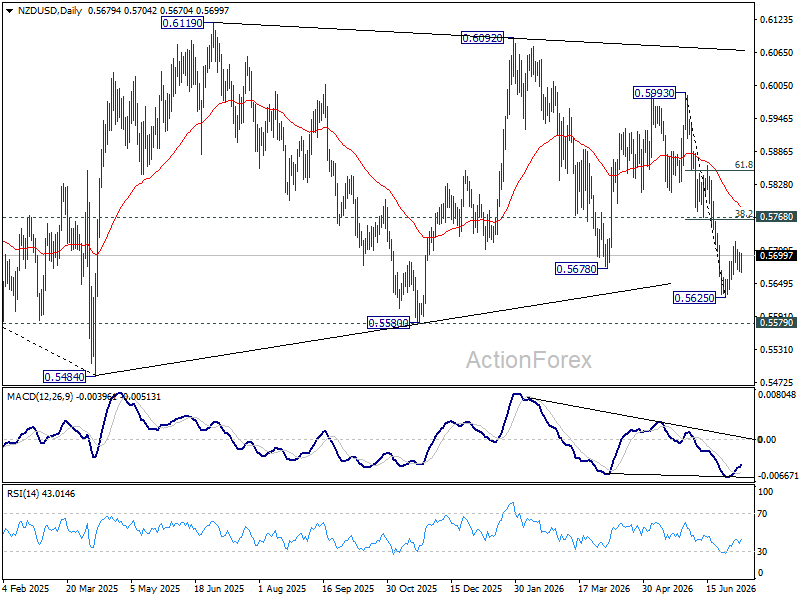
The charts tell a similar story. NZD/USD recovered after the decision but remained comfortably below last week's high at 0.5726, suggesting buyers have yet to seize full control. The rebound from 0.5625 may still extend in the near term, but it continues to resemble a corrective recovery within a broader downtrend.
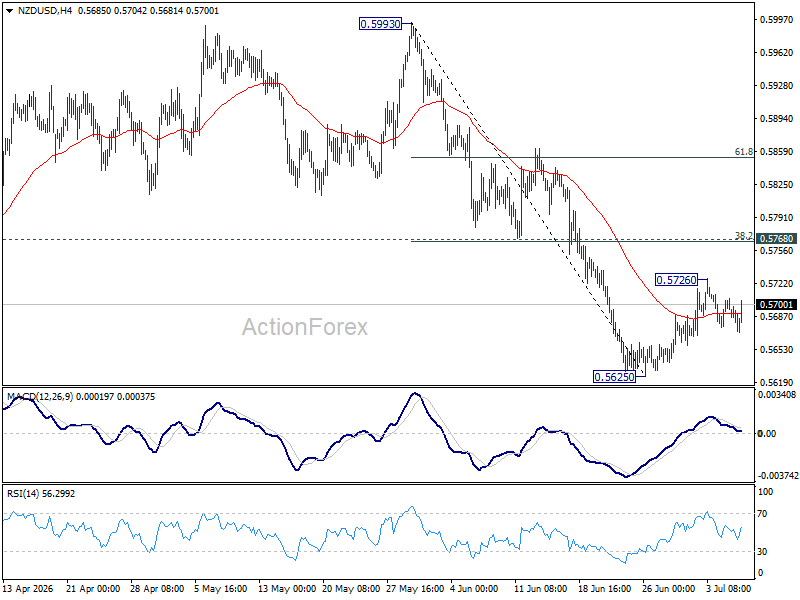
Even if another leg higher develops, upside should be capped by the 0.5768 resistance cluster, including the 38.2% retracement of 0.5993 to 0.5625 at 0.5766. Once the corrective rebound is complete, a break below 0.5625 remains the preferred scenario. A subsequent move through 0.5580 would shift focus back to the 2025 low at 0.5484.
Gold Recovery Faces a Reality Check Ahead of FOMC Minutes
Key Highlights
- Gold started a recovery wave from the $3,950 region.
- A major bearish trend line is forming with resistance at $4,180 on the 4-hour chart.
- WTI Crude Oil started a consolidation phase below the $72.50 resistance.
- Bitcoin recovered some losses and tested the $65,000 resistance.
Gold Price Technical Analysis
Gold found bids near $3,940 and $3,950 against the US Dollar. The price started a correction wave and climbed above the $4,000 resistance.
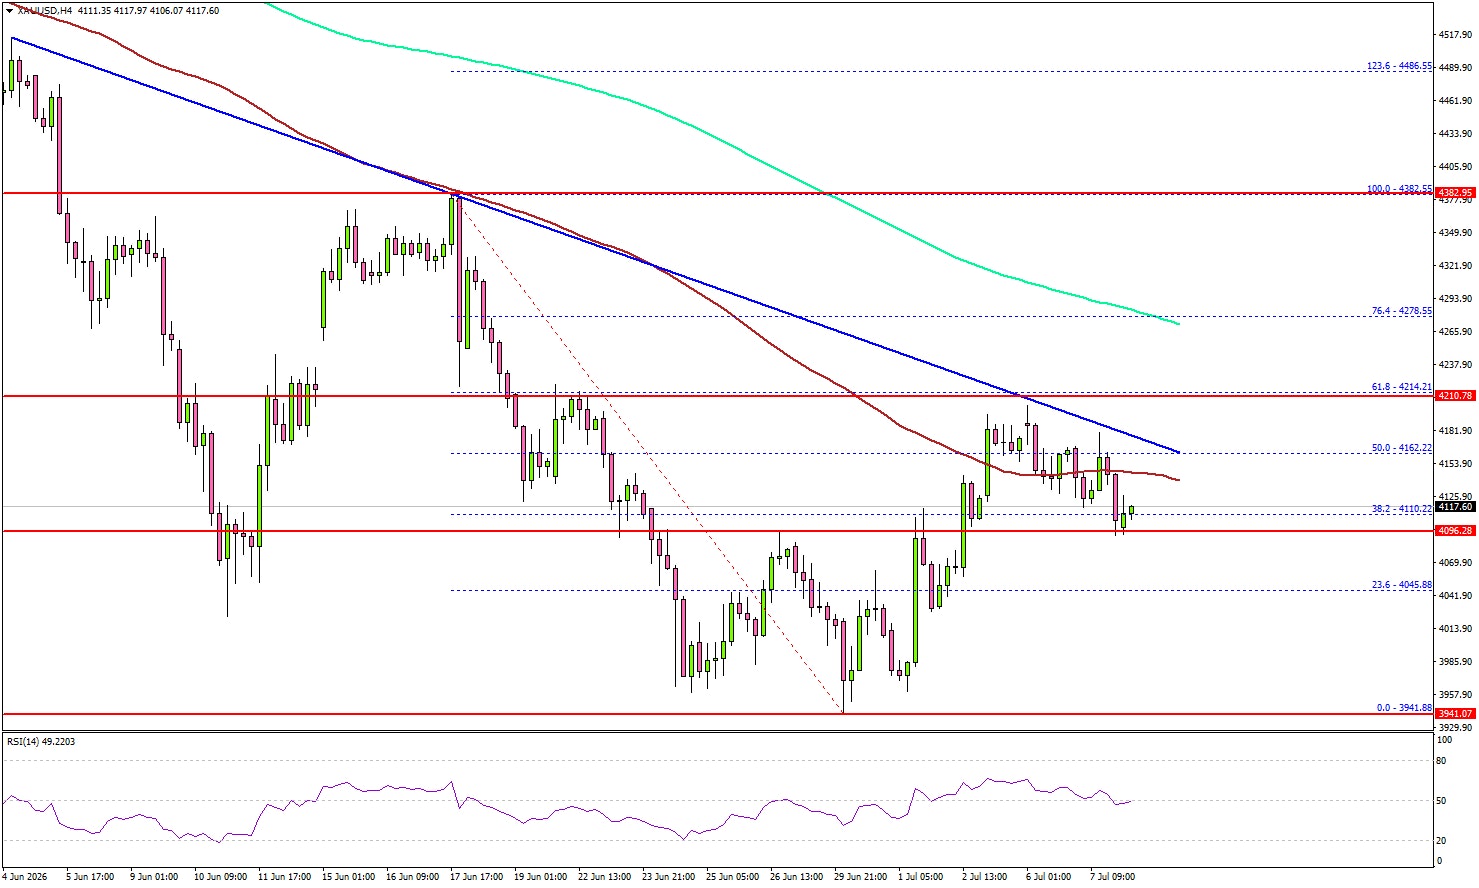
The 4-hour chart of XAU/USD indicates that the price surpassed $4,080, $4,120, and the 50% Fibonacci retracement level of the downward move from the $4,382 swing high to the $3,941 swing low. It even cleared the 100 Simple Moving Average (red, 4 hours) but stayed below the 200 Simple Moving Average (green, 4 hours).
The bears seem to be active below $4,200. There is also a major bearish trend line forming with resistance at $4,180 and the 61.8% Fibonacci retracement.
If the bears remain in action, the price could revisit the $4,095 support. The first major support sits at $4,045. The next support could be $4,000, below which the price might slide to $3,940.
The main support sits at $3,880. Any more losses might call for a test of $3,650 or even $3,500 in the coming days. On the upside, immediate resistance could be $4,185. The next major resistance might be near a trend line at $4,200.
A clear move above $4,200 could open the doors for more upside. In the stated case, the bulls could aim for a move toward $4,275 or even $4,300. Any more gains might send the price toward the $4,350 level.
Looking at WTI Crude Oil, the price started a minor recovery wave, but it might face resistance near $72.50 and $73.20.
Economic Releases to Watch Today
- FOMC Meeting Minutes.
RBNZ Raises OCR, Consensus Masks Diverging Inflation Views
The Reserve Bank of New Zealand raised the Official Cash Rate by 25 basis points to 2.50%, with the Monetary Policy Committee reaching the decision by consensus despite differing assessments of the inflation outlook. Policymakers agreed that a further withdrawal of monetary stimulus was warranted to return inflation to the 2% midpoint, even though the partial reopening of the Strait of Hormuz has sharply reduced oil prices and eased near-term inflation pressures. The Committee cautioned, however, that "the effects of the shock will linger for some time" and that "the outlook for medium-term inflation pressures remains uncertain."
The Record of Meeting revealed a more nuanced discussion beneath that consensus. Prasanna Gai and Hayley Gourley judged risks to inflation as still skewed to the upside. Meanwhile, Governor Anna Breman, Director of Economics and Chief Economist Paul Conway, Assistant Governor (Money) Karen Silk, and external MPC member Carl Hansen, viewed risks as broadly balanced, arguing that spare capacity and still-soft demand should limit firms' ability to pass higher costs on to consumers, even as the economy is expected to regain momentum in the second half of the year.
The result was a statement that preserved a tightening bias without locking the Committee into a predetermined path. The RBNZ said "some further reduction in monetary stimulus is likely to be required," while adding that "further OCR increases appear likely at upcoming meetings," but stressed that "their timing is highly uncertain." Future decisions will therefore hinge on incoming data, firms' price-setting behavior and the pace at which spare capacity is absorbed, reinforcing the RBNZ's preference for flexibility over explicit forward guidance.
(RBNZ) OCR increased to 2.50% to return inflation to 2%
Media release
The Monetary Policy Committee today reached consensus to increase the OCR by 25 basis points to 2.50 percent.
Following the partial reopening of the Strait of Hormuz, global oil prices have fallen markedly. Other petrochemical prices have also moved lower. As a result, near-term inflation pressures have eased.
Although energy prices have decreased, the effects of the shock will linger for some time and the outlook for medium-term inflation pressures remains uncertain. The stance of monetary policy is calibrated to bring inflation back to target without causing unnecessary economic instability.
Global growth has been resilient to the effects of tariffs and conflict in the Middle East, largely because of strong AI-related investment and spending on defence and economic security. Headline inflation in New Zealand’s trading partners has increased but is expected to ease to close to 2 percent in 2027. Markets expect global policy rates to increase above pre-conflict levels, as central banks may need to respond to persistent energy-driven inflation pressures.
New Zealand’s economic recovery was underway before the Middle East conflict, but lost momentum in the June quarter as the oil shock weighed on economic activity. Growth is expected to resume in the September quarter as these effects fade and confidence improves. Over the medium term, inflation returning to the 2 percent target mid-point will lift household purchasing power and help support a sustained recovery in growth and employment.
The outlook for medium-term inflation pressures depends on the extent to which recent cost increases feed through into higher prices. Spare capacity in the economy is expected to limit firms’ ability to pass on higher costs, meaning many businesses may need to absorb them in margins. However, some firms may look to rebuild margins as demand recovers. If sustained, a lower exchange rate could also add to medium-term inflation pressures.
With inflation still above target and economic activity expected to strengthen, some further reduction in monetary stimulus is likely to be required to return inflation to the 2 percent target mid-point. Future OCR decisions will depend on how incoming data, price-setting behaviour, and the strength of economic activity affect medium-term inflation pressures.
Summary record of meeting – July 2026 MPR
The Monetary Policy Committee remains committed to returning inflation to the 2 percent mid-point of its medium-term target. Despite progress towards conflict resolution in the Middle East and the recent fall in energy prices, annual consumers price inflation is expected to remain above the Monetary Policy Committee’s 1 to 3 percent target range in coming quarters.
The monetary policy stance is calibrated to bring inflation back to target without causing unnecessary economic instability. Inflation is expected to fall to around 2 percent over the next 12 months. The economic recovery is expected to resume over the second half of this year and spare capacity is expected to gradually decline.
The near-term inflation outlook has improved but inflation remains elevated
Since the easing of tensions in the Middle East, global oil, gas and fertiliser prices have declined. The Committee noted that supply chains were likely to take time to adjust and that considerable geopolitical uncertainty remained. As a result, energy and petrochemical prices are likely to be volatile and cost pressures elevated for some time.
The forecast for near-term inflation has declined, given that current oil futures pricing is now significantly lower than assumed in the May Statement. Annual headline inflation is expected to have peaked at 3.9 percent in the June 2026 quarter, before declining to 3.3 percent in the September 2026 quarter. The lower forecast relative to the May Statement largely reflects smaller direct price effects due to lower oil prices, as well as reduced pass-through to other consumer prices.
The Committee noted that, prior to the start of the Middle East conflict, inflation was above the target band and non-tradables inflation has been persistent despite spare capacity in the economy. Annual headline inflation is expected to return to the target mid-point in mid-2027. Inflationary pressures in the medium term will depend on price-setting behaviour and the speed at which spare capacity in the economy is absorbed.
The global economy has been resilient
The Committee noted that global economic activity had remained robust through 2025 and into early 2026, despite significant headwinds. High-frequency indicators of economic activity and business and consumer sentiment declined across many economies in the June 2026 quarter. The Committee discussed the recent decline in energy prices, alongside continued strong investment in artificial intelligence (AI) technology, that could support stronger global economic activity than previously assumed.
The Committee noted that headline inflation has increased across many of New Zealand’s trading partners, although the extent of this varies across economies. To date, inflation data suggest that indirect pass-through from higher energy prices has been limited in most major economies. This may change going forward and differ across economies. Consensus forecasts imply that trade-weighted global inflation will moderate close to 2 percent in 2027.
The domestic economic recovery is expected to resume in the September quarter
The Committee discussed how recent economic data continued to support the assessment that the New Zealand economy was recovering prior to the start of the Middle East conflict. While GDP growth of 0.8 percent in the March 2026 quarter was slightly lower than expected, the level of GDP was slightly higher than assumed in the May Statement, reflecting revisions to prior quarters.
The Committee noted that domestic economic activity slowed in the June 2026 quarter. High-frequency indicators, including electronic card transactions and the performance of services and manufacturing indices, pointed to weaker demand. Housing market activity remained subdued, with house prices down 0.4 percent on an annual basis in May. Residential investment also contracted in the March 2026 quarter despite strong growth in new dwelling consents over the last 12 months.
Intelligence from business engagements conducted in early June, prior to the US-Iran Memorandum of Understanding, indicated that economic conditions remain highly uneven across sectors and regions. Exporting sectors, such as agriculture and tourism, remain strong, while discretionary retail spending and construction remain weak.
Domestic economic growth is projected to resume in the September 2026 quarter. Lower fuel prices would support a recovery in spending. Business confidence and some activity indicators increased in June, while cost and price expectations decreased. The Reserve Bank’s GDP nowcasting model, Kiwi-GDP, currently predicts 0.6 percent growth in the September 2026 quarter.
Financial conditions have eased
The Committee noted that domestic financial conditions have eased, reflecting lower wholesale interest rates and a depreciation in the exchange rate. Declines in the expected rate of near-term inflation have contributed to lower market pricing for the OCR. Expectations for policy rates have also declined relative to our key trading partners, most notably the US, contributing to a depreciation in the trade-weighted New Zealand dollar exchange rate.
The Committee noted that, since the May Statement, short-term mortgage rates continued to increase, while longer-term mortgage rates have declined. Mortgage rates increased through the first half of this year in response to higher wholesale rates, which reflected higher near-term expectations for the OCR. More recent declines in wholesale rates have widened spreads between mortgage and wholesale rates, reducing pressure for further increases in mortgage rates at some terms.
The Committee agreed that financial system stability continues to pose no material trade-off to meeting its inflation objective.
The Committee approved full divestment of the LSAP holdings by June 2027
It was noted that under the current Large Scale Asset Purchase (LSAP) sales approach almost all holdings would be unwound by 30 June 2027, although a small residual position, mostly in Local Government Funding Agency (LGFA) securities, would remain on the RBNZ’s balance sheet until 2037. Staff proposed that, in the interests of operational efficiency, securities maturing or due to be sold after 30 June 2027 should be divested sooner. This would conclude the programme by 30 June 2027.
This proposal involved bringing forward the final sale of $141m of New Zealand Government Bonds from July 2027 to June 2027 and divesting the LGFA securities due to mature after June 2027, totalling $392m, noting that LGFA provides a regular repurchase tender.
The Committee approved the proposal noting it had no impact on monetary stimulus given the relatively small quantity of holdings impacted. The Committee instructed staff to provide further details via a Domestic Markets Media release after liaison with LGFA and New Zealand Debt Management.
The Committee discussed the risks to the global outlook
The Committee discussed upside risks to global activity. Members noted that a reduction in energy prices could support a stronger recovery in business and consumer sentiment. An easing to global financial conditions this year, via lower short-term real interest rates and higher global equity prices, could also support aggregate demand. The Committee emphasised that stronger investment in economic and military security may also provide a tailwind to the global economy. Stronger global activity would support demand for New Zealand’s exports.
The Committee also discussed downside risks to global activity. A re-escalation of the Middle East conflict could disrupt energy markets, increasing near-term inflation while weighing on global growth. Members also noted the risk of a correction in AI-related asset prices, with implications for financial conditions, financial stability and global demand. In addition, high and increasing global government debt ratios, alongside greater geopolitical fragmentation, could push up long-term bond yields and weigh on global growth.
The Committee noted the risks around the global inflation outlook. Given inflation has been above target across many economies for several years, the recent shock in the Middle East may generate greater inflation persistence due to changes in firms’ price setting behaviour. Inflation has been low in China for several years and this has placed downward pressure on inflation in several of our Asian trading partners and tradables inflation in New Zealand. However, higher energy prices and increased economic activity due to strong demand for technology exports is increasing inflationary pressure in several Asian economies outside of China.
The Committee discussed the risks to the medium-term inflation outlook
The Committee judged that there are both risks to the upside and the downside. In the discussion, Prasanna Gai and Hayley Gourley assessed that risks were skewed to the upside, while Anna Breman, Paul Conway, Carl Hansen and Karen Silk viewed risks as broadly balanced.
The Committee discussed risks to the domestic inflation outlook arising from recent global developments. Prasanna Gai noted that, despite the recent decline in energy prices, some indirect effects from earlier increases in energy-related input costs may also still flow through to consumer prices. Karen Silk added that the recent depreciation of the exchange rate could, if sustained, increase imported inflation.
The Committee discussed risks around domestic price-setting behaviour. All Committee members agreed that this will be a key determinant for the medium-term inflation outlook. Carl Hansen commented that non-tradables inflation remains elevated and that administered price inflation could remain persistently high. Paul Conway observed that firms’ price-setting behaviour could also prove more sensitive to further cost increases, particularly after an extended period of elevated inflation. Some businesses may also seek to rebuild margins as demand recovers. Prasanna Gai also highlighted the risk that the Middle East shock could coordinate price-setting behaviour, licencing firms to pass on costs more readily than otherwise. Anna Breman noted that if demand remains weak, firms may have less ability to pass higher costs on to consumers and intelligence from recent business engagements point to divergence in ability to pass on cost increases.
The Committee discussed risks to the strength and breadth of the domestic recovery. On the upside, Carl Hansen noted that lower energy prices could support a stronger recovery in household and business demand. Hayley Gourley emphasised that a sustained exchange rate depreciation could also support returns in export and tourism sectors.
On the downside, Paul Conway noted uncertainty around how quickly the recovery will broaden beyond currently strong sectors and regions. Several members observed that household consumption and investment remain weak, reflecting caution and the lingering effects of repeated shocks. Anna Breman highlighted the risk that persistently high inflation would erode purchasing power and delay a recovery in consumption. Karen Silk noted that slower-than-expected net immigration could weigh on activity, rental inflation and house prices. Hayley Gourley also highlighted that the El Niño climate pattern could increase the risk of extreme weather events, disrupting agricultural production.
The Committee assessed that the current level of the OCR remains accommodative. However, members noted that there is some uncertainty around where to judge the current level of the neutral interest rate. Prasanna Gai noted that recent geoeconomic shocks may have increased New Zealand’s neutral interest rate by reducing global productive capacity and raising investment demand relative to available global savings.
The Committee agreed that all these upside and downside risks are relevant for the medium-term inflation outlook and will be important for the monetary policy stance going forward.
The Committee decided to increase the OCR to 2.50 percent
The Committee agreed that it was appropriate to start reducing the degree of monetary stimulus to ensure that inflation returns to target over the medium term. A 25 basis point OCR increase was considered consistent with the mandate of ensuring low and stable inflation, while avoiding unnecessary instability in output, employment, interest rates and the exchange rate.
Members noted that high inflation erodes households’ purchasing power and dampens domestic demand. Inflation declining towards the target mid-point will help to ensure a sustainable recovery in economic growth and a stronger labour market.
The Committee noted that financial conditions had eased in recent weeks. This follows a material tightening in financial conditions earlier this year. Increasing the OCR at this meeting is intended, in part, to avoid an unwarranted further easing in financial conditions.
The Committee agreed that while further OCR increases appear likely at upcoming meetings, their timing is highly uncertain. Future OCR decisions will depend on the Committee’s judgement about how price-setting behaviour and excess productive capacity affect medium-term inflation pressures.
On Wednesday 8 July, the Committee reached consensus to increase the OCR by 25 basis points to 2.50 percent.
Attendees:
MPC members: Anna Breman (chairperson), Carl Hansen, Hayley Gourley, Karen Silk, Paul Conway, Prasanna Gai
Treasury Observer: James Beard
MPC Secretary: Elliot Jones
RBA’s Hunter: Supply Shocks Don’t Mean Inflation Can Be Ignored
Reserve Bank of Australia Assistant Governor Sarah Hunter said central banks cannot automatically dismiss inflation caused by supply shocks, arguing that persistent disruptions may still require a monetary policy response. "While supply shocks create difficult trade-offs, they do not lessen the importance of maintaining low and stable inflation," she said, emphasizing that the RBA remains committed to returning inflation to target while supporting sustainable full employment.
Hunter noted that policymakers must distinguish between temporary and persistent supply shocks. If a shock has "a persistent upward effect on inflation," she said, "some tightening might be called for" to prevent inflation expectations from becoming unanchored. At the same time, she acknowledged the difficult trade-off facing central banks, adding that policymakers would also need to weigh the impact on economic activity and the labour market. Should growth weaken materially, "the bias towards tightening might be more limited."
Her remarks reinforce the RBA's message that further policy tightening has not been ruled out despite the recent pause in rate increases. Rather than adopting a mechanical response to higher oil prices or other supply disruptions, Hunter argued for a flexible, data-dependent approach. She reiterated that "the Board will continue to act as needed to ensure inflation returns to target and the labour market to sustainable full employment," signaling that the persistence of inflation, rather than the origin of the shock alone, will determine future policy decisions.
BoJ’s Asada: Demand-Driven Inflation Needed Before Another Rate Hike
Bank of Japan board member Toichiro Asada said he would only support another interest rate hike once inflation is clearly being driven by stronger domestic demand rather than temporary cost pressures. Speaking after dissenting against the BoJ's June rate increase, Asada said, "I would support another rate hike only after confirming demand-driven inflation," signaling that current price gains have yet to meet his threshold for further policy normalization.
Asada argued that inflation generated by higher oil prices and a weaker yen should not be treated the same as inflation supported by rising wages and household spending. While acknowledging that energy prices have passed through to consumer inflation more quickly than expected, he indicated that the BoJ should wait for clearer evidence that wage growth is translating into stronger consumption and sustainably higher prices. He also stressed that monetary policy should respond to evolving economic conditions rather than follow a predetermined tightening path.
The remarks reinforce Asada's position as the most cautious voice on the BoJ board following last month's decision to raise the policy rate to 1.00%. He also argued that Japan's neutral interest rate remains low and supported a gradual normalization of the BoJ's balance sheet through a measured reduction in bond purchases. His comments highlight that, despite the BoJ's ongoing normalization process, policymakers remain divided over when inflation can truly be considered durable enough to justify additional rate hikes.
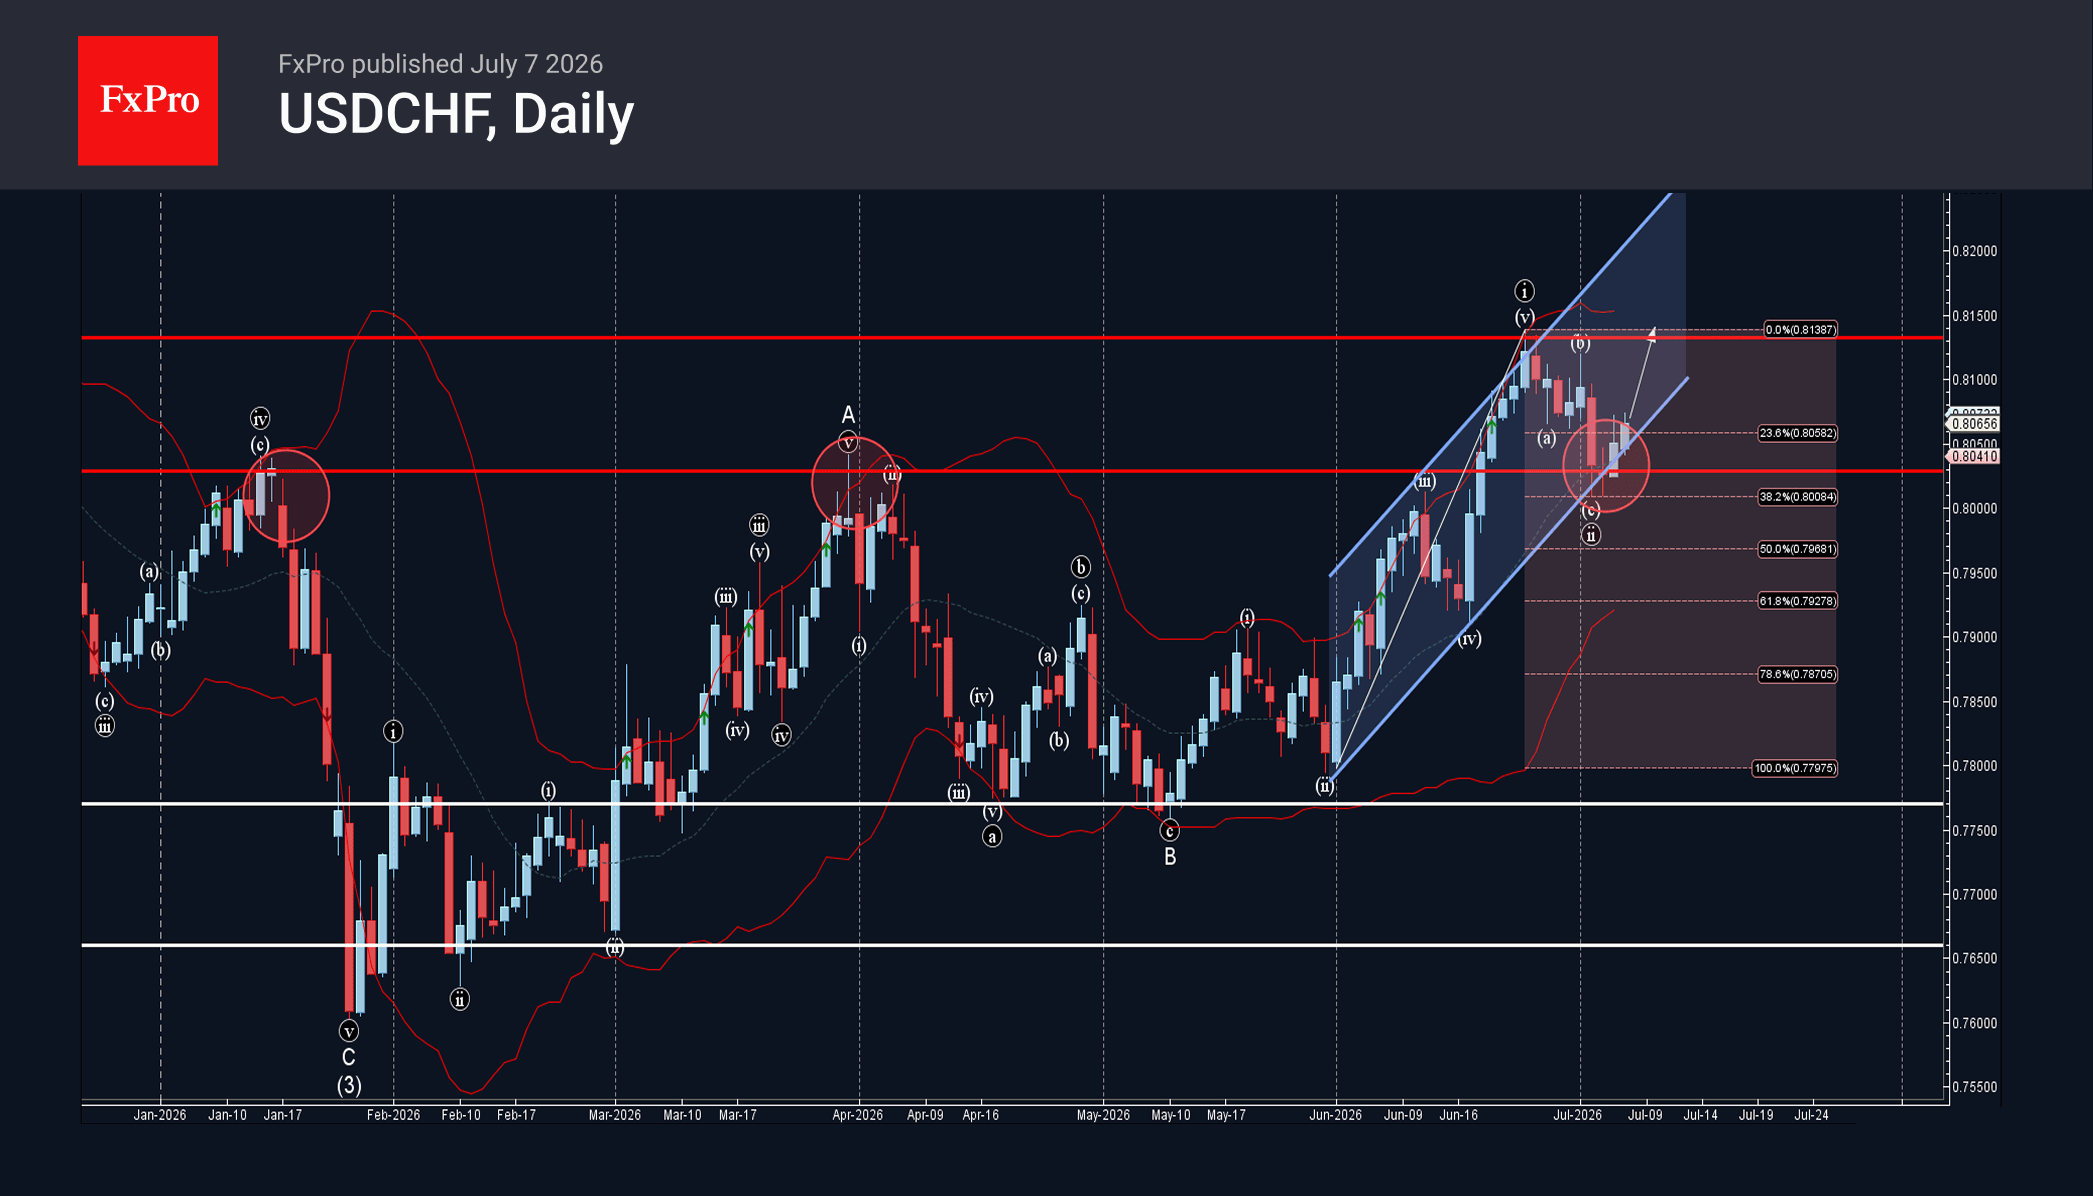
USDCHF Wave Analysis
USDCHF: ⬆️ Buy
– USDCHF reversed from support zone
– Likely to rise to resistance level 0.8130
USDCHF currency pair reversed from the support zone between the pivotal support level 0.8030 (former strong resistance from January and March), 38.2% Fibonacci correction of the upward impulse from May and the support trendline of the daily up channel from May.
The upward reversal from this support area started the active short-term impulse wave iii from the start of July.
Given the bullish US dollar sentiment seen across the FX markets today, USDCHF currency pair can be expected to rise to the next resistance level 0.8130 (which stopped earlier impulse wave i).