

Sample Category Title
AUD/USD Daily Report
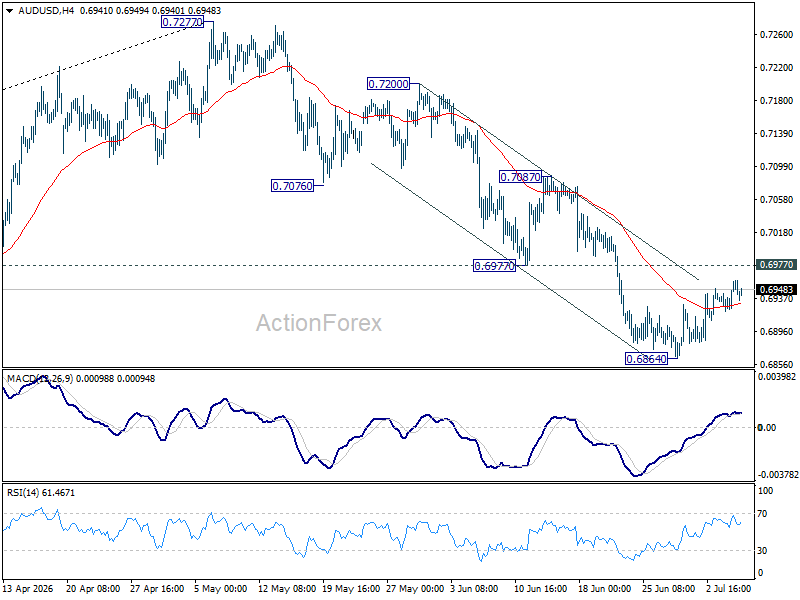
Intraday bias in AUD/USD remains neutral for the moment. More consolidations could be seen above 0.6864. Further fall is expected as long as 0.6977 support turned resistance holds. Below 0.6864 will target 0.6832 support. Firm break there will target 0.6756 fibonacci level. However, sustained break of 0.6977 will bring stronger rebound to 0.7087 resistance instead.
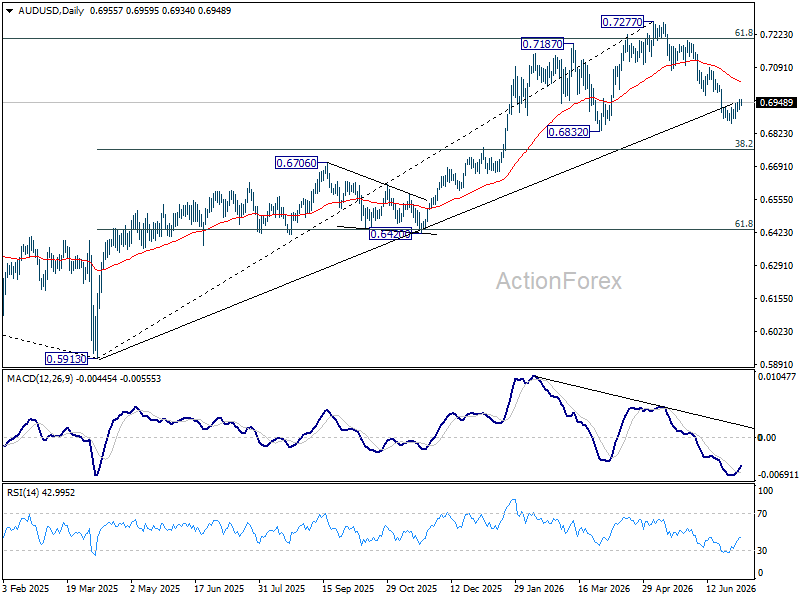
In the bigger picture, considering bearish divergence condition in D MACD, a medium term top could be formed at 0.7277 after failing to sustain above 61.8% retracement of 0.8006 (2021 high) to 0.5913 (2024 low) at 0.7206. Deeper fall could be seen to 38.2% retracement of 0.5913 to 0.7277 at 0.6756 as a correction. But strong support should be seen there to bring rebound. Consolidations would continue below 0.7277 for a while.
USD/CAD Daily Outlook
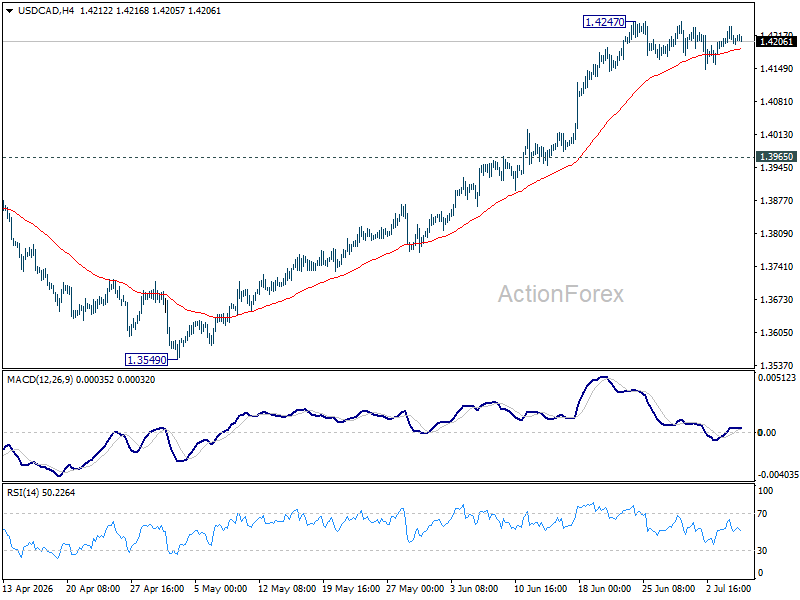
USD/CAD is staying in consolidations below 1.4247 and intraday bias remains neutral. Deeper pullback cannot be ruled out. But downside should be contained above 1.3965 resistance turned support. Above 1.4247 will resume the rally from 1.3480 to 61.8% retracement of 1.4791 to 1.3480 at 1.4290. Firm break there will pave the way back to 1.4791 high.
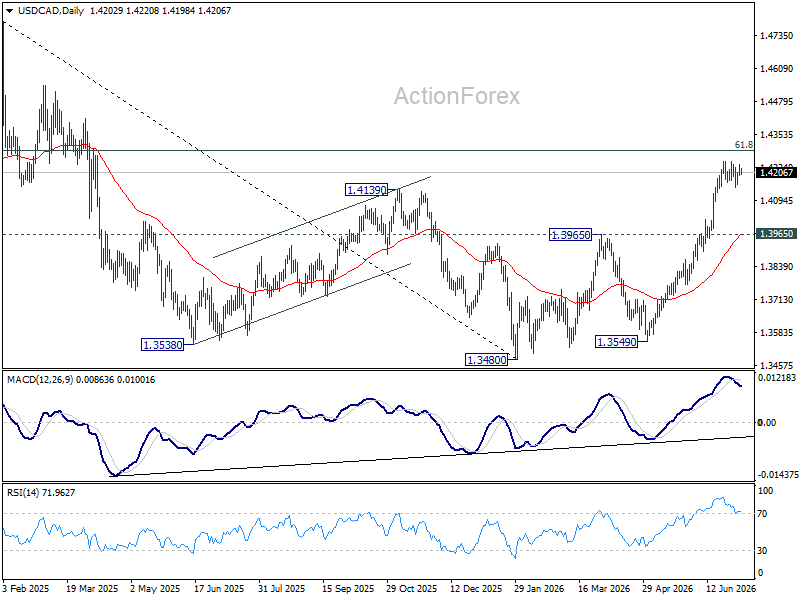
In the bigger picture, current development suggests that fall from 1.4791 has completed as a three wave correction to 1.3480. It's still early to judge if rise from there a corrective bounce, or resumption of the larger up trend from 1.2005 (2021 low). But in either case, retest of 1.4791 high should be seen next.
GBP/JPY Daily Outlook
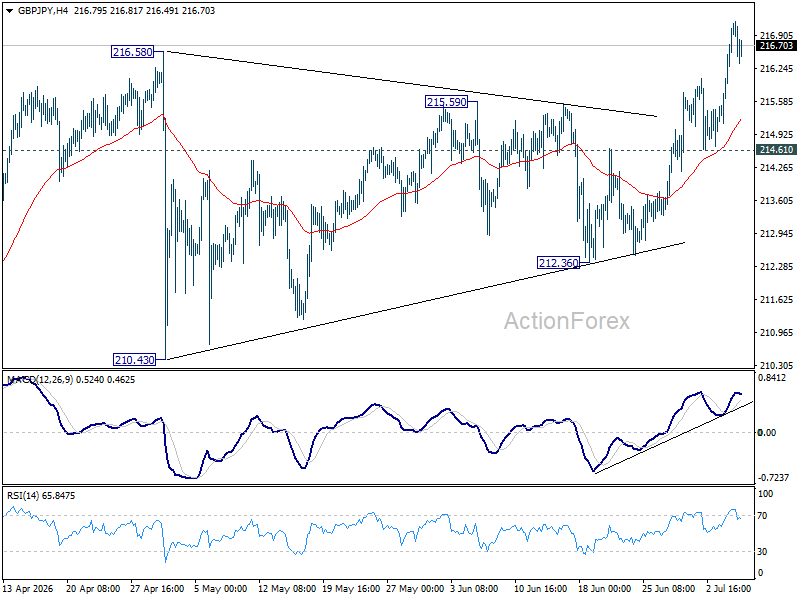
Intraday bias in GBP/JPY remains on the upside as this point. Sustained trading above 216.58 will extend larger up trend and target 220.90 fibonacci projection. For now, risk will stay on the upside as long as 214.61 support holds, in case of retreat.
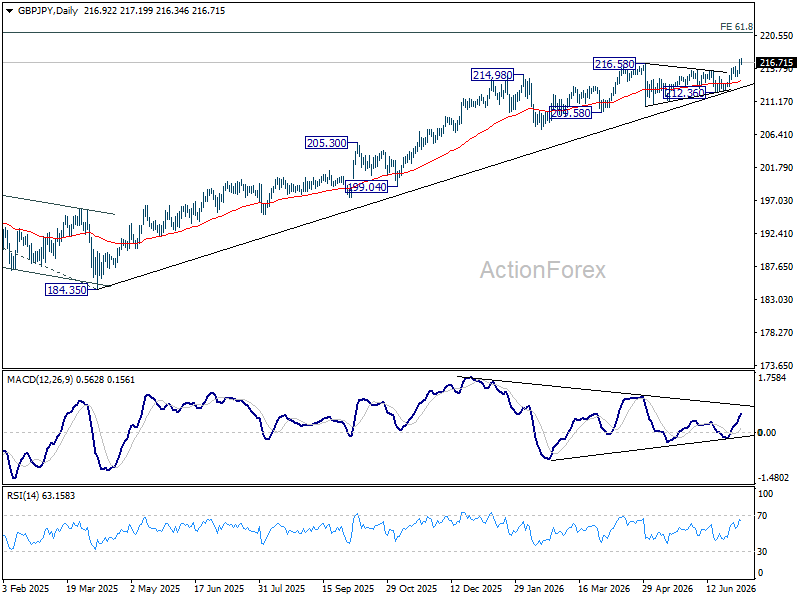
In the bigger picture, there is no clear sign of trend reversal yet. The long term up trend could still extend to 61.8% projection of 148.93 (2022 low) to 208.09 (2024 high) from 184.35 at 220.90 on resumption. However, sustained break of 55 W EMA (now at 207.89) will argue that it's already in medium term down trend for 184.35 support.
EUR/JPY Daily Outlook
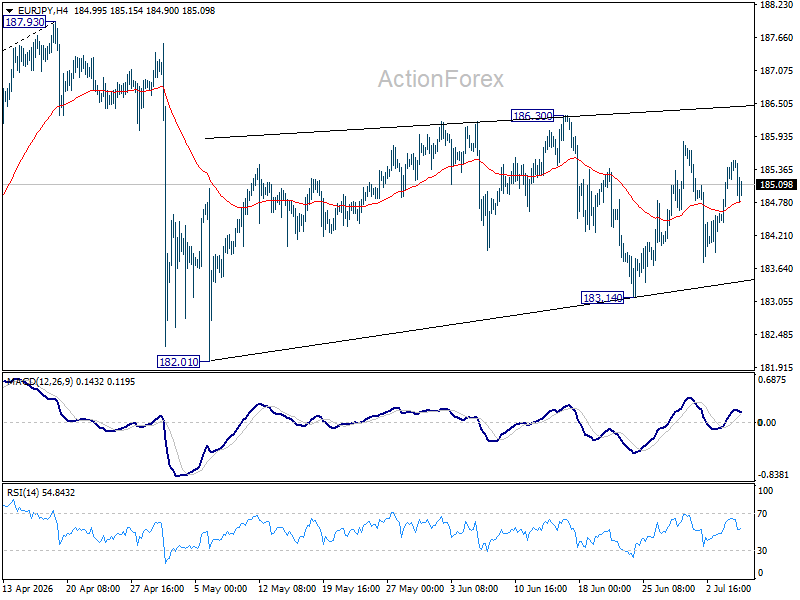
Range trading continues in EUR/JPY and intraday bias remains neutral. On the upside, break of 186.30 will resume the rebound from 182.01 to retest 187.93 high. On the downside, break of 183.14 will target 182.10 support next.
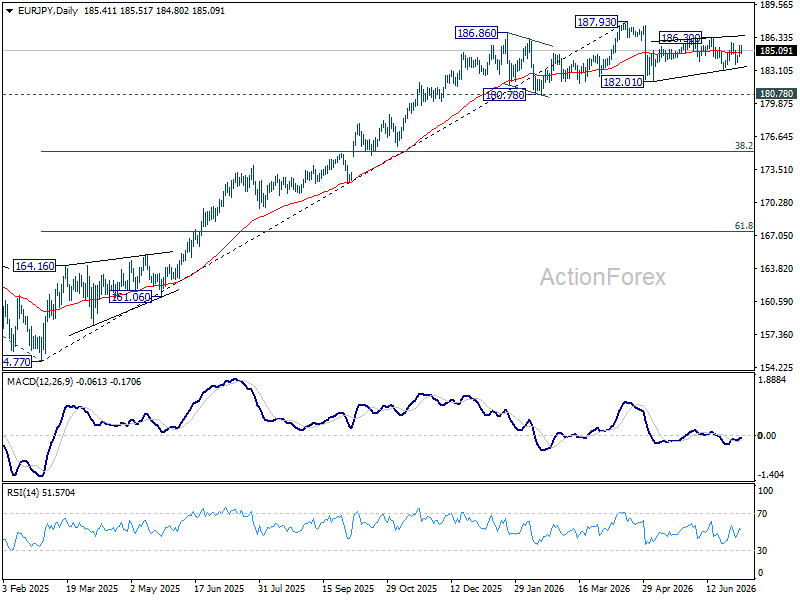
In the bigger picture, there is no sign of reversal yet. Uptrend from 114.42 (2020 low) is still expected to resume at a later stage to 78.6% projection of 124.37 (2022 low) to 175.41 (2025 high) from 154.77 at 194.88. However, sustained break of 55 W EMA (now at 179.76) will argue that it's already in a medium term down trend to 175.41 resistance turned support and below.
EUR/GBP Daily Outlook
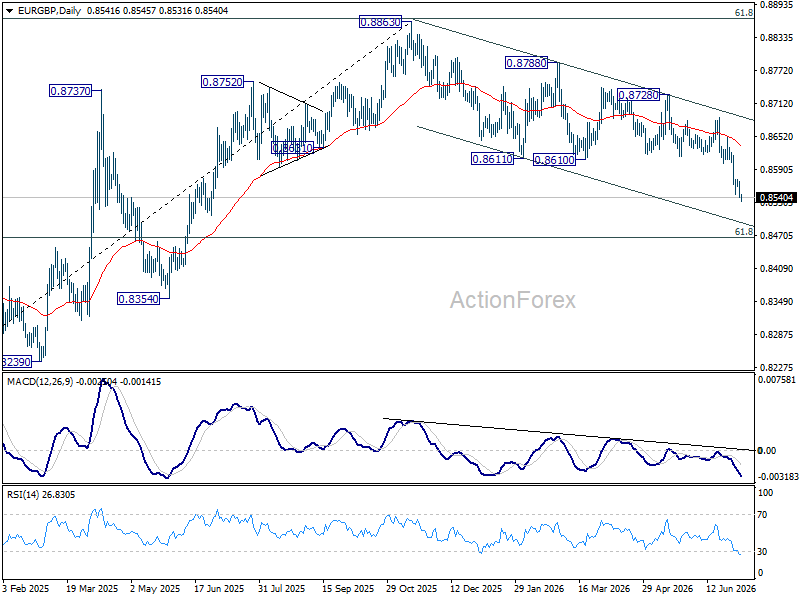
Intraday bias in EUR/GBP remains on the downside for 61.8% retracement of 0.8221 to 0.8863 at 0.8466. On the upside, above 0.8573 minor resistance will turn bias neutral first. But risk will stay on the downside as long as 0.8686 resistance holds, in case of recovery.
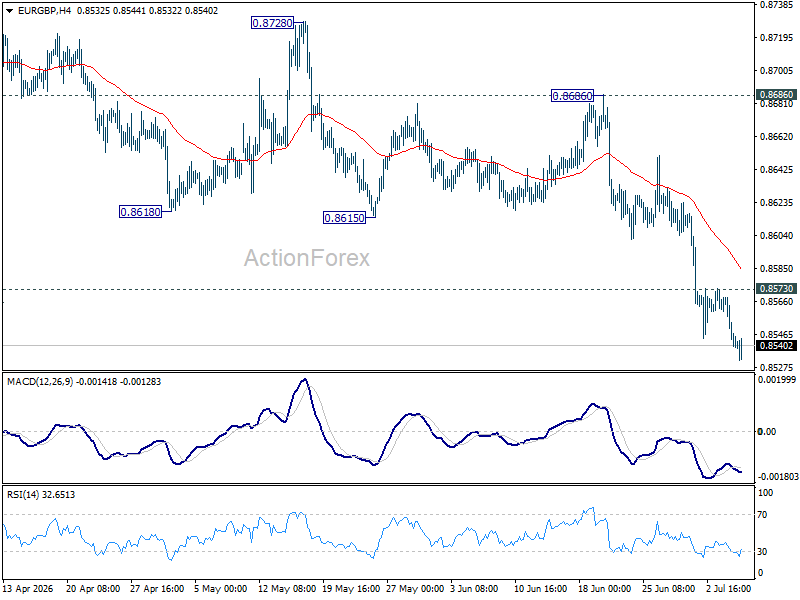
In the bigger picture, current development suggests that rise from 0.8221 (2024 low) has completed at 0.8863, just ahead of 38.2% retracement of 0.8221 (2024 low) to 0.8863 (2025 high) at 0.8618. Deeper fall would be seen back to 0.8201 (2022 low). For now, outlook will be neutral at best as long as 0.8863 hold.
EUR/AUD Daily Outlook
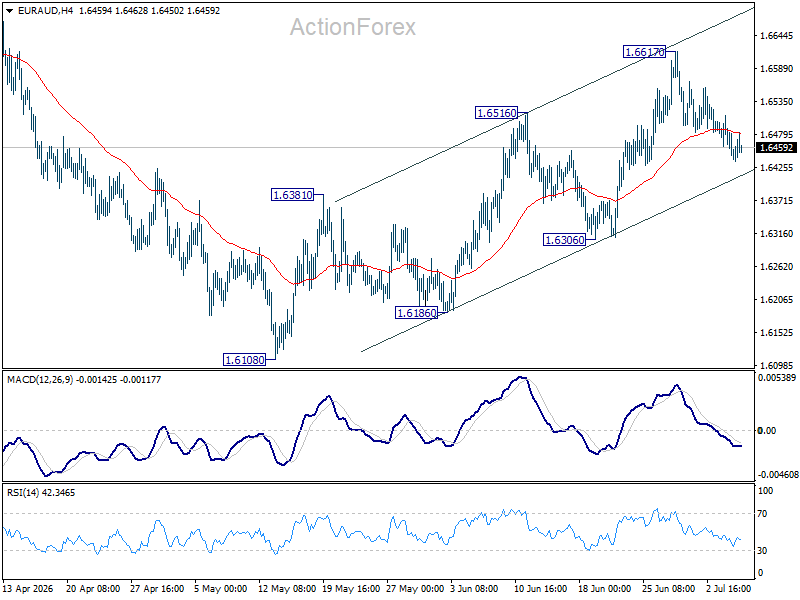
Intraday bias in EUR/AUD remains neutral and outlook is unchanged. Further rise is in favor as long as 1.6306 support holds. Above 1.6617 will extend the rebound from 1.6108 towards 1.6842 key structural resistance. However, firm break of 1.6306 will turn bias back to the downside for retesting 1.6108.
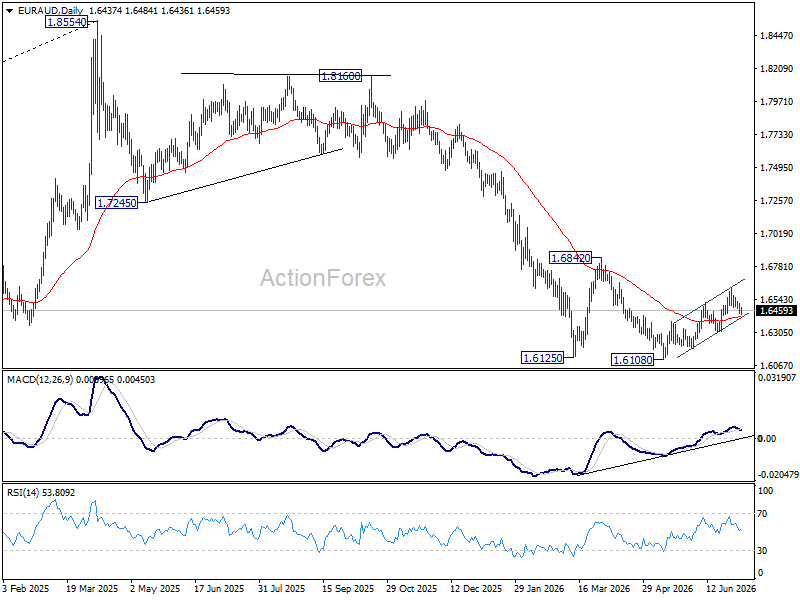
In the bigger picture, outlook will stay bearish as long as 1.6842 resistance holds. Fall from 1.8554 (2025 high) is expected to continue to 61.8% retracement of 1.4281 to 1.8554 at 1.5913. Decisive break there will pave the way back to 1.4281 (2022 low). However, firm break of 1.6842 should confirm medium term bottoming, and bring stronger rally.
EUR/CHF Daily Outlook
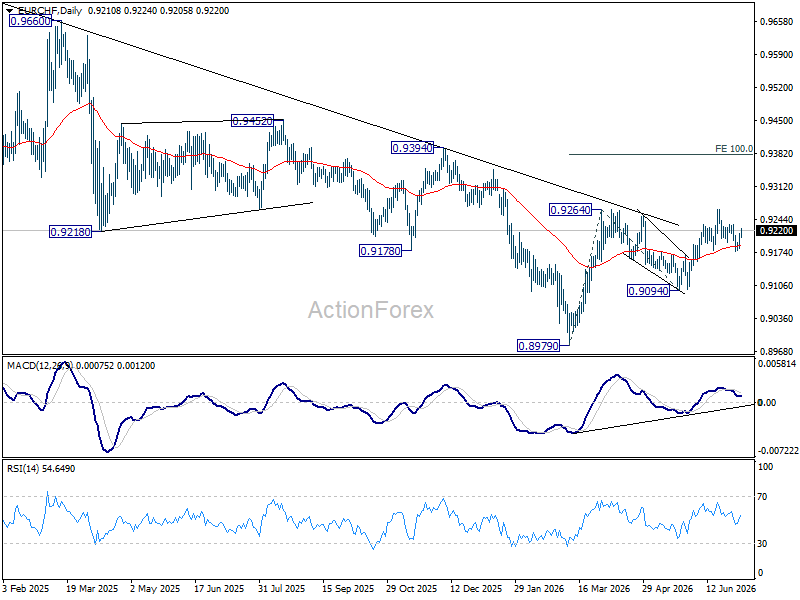
EUR/CHF recovered further today but stays below 0.9234 resistance. Intraday bias remains neutral first. With 0.9176 support intact, further rise remains in favor. On the upside,a above 0.9234 will bring retest of 0.9265 resistance first. Firm break there will resume the rally from 0.8979 to 100% projection of 0.8979 to 0.9264 from 0.9094 at 0.9379. However, decisive break of 0.9176 will dampen this bullish view, and bring deeper fall back to 0.9094 support.
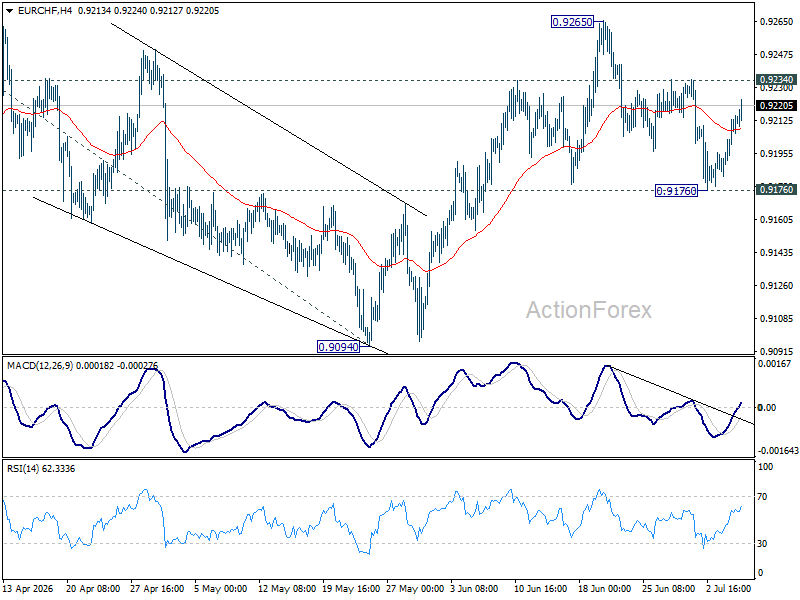
In the bigger picture, the break of medium term falling trend line resistance indicates that 0.8979 is already a medium term bottom. Considering bullish convergence condition in W MACD, rise from there should at least be reversing the fall from 0.9928, with prospect of developing into a medium term up trend. Firm break of 0.9394 resistance will add more credence to this case. For now risk will remain on the upside as long as 0.9094 support holds, in case of retreat.
EUR/USD Analysis: Who Is in Control?
Two central banks, two hawkish tones — but only one dollar just took a hit. The ECB delivered a 25bp hike in June, its first since 2023, lifting the deposit rate to 2.25% as Middle East-driven energy costs pushed headline inflation to 3.2% in May before easing to 2.8% in June, with growth downgraded to 0.8% amid weaker confidence.
The Fed, under new Chair Kevin Warsh, held rates at 3.50%-3.75% for a fourth straight meeting, with a hawkish dot-plot shift initially fueling hike expectations. However, the June employment report—released on July 3rd—showed nonfarm payrolls rising by just 57K against 110K expected, the weakest reading in four months, while the unemployment rate dipped to 4.2% only due to a labor force participation rate falling to 61.5%, its lowest level in five years.
The result: both central banks' communications currently lean hawkish, but with the Fed's data now sending mixed signals. Which side ultimately prevails could well set the tone for EUR/USD's trend into year-end.
EUR/USD Technical Analysis
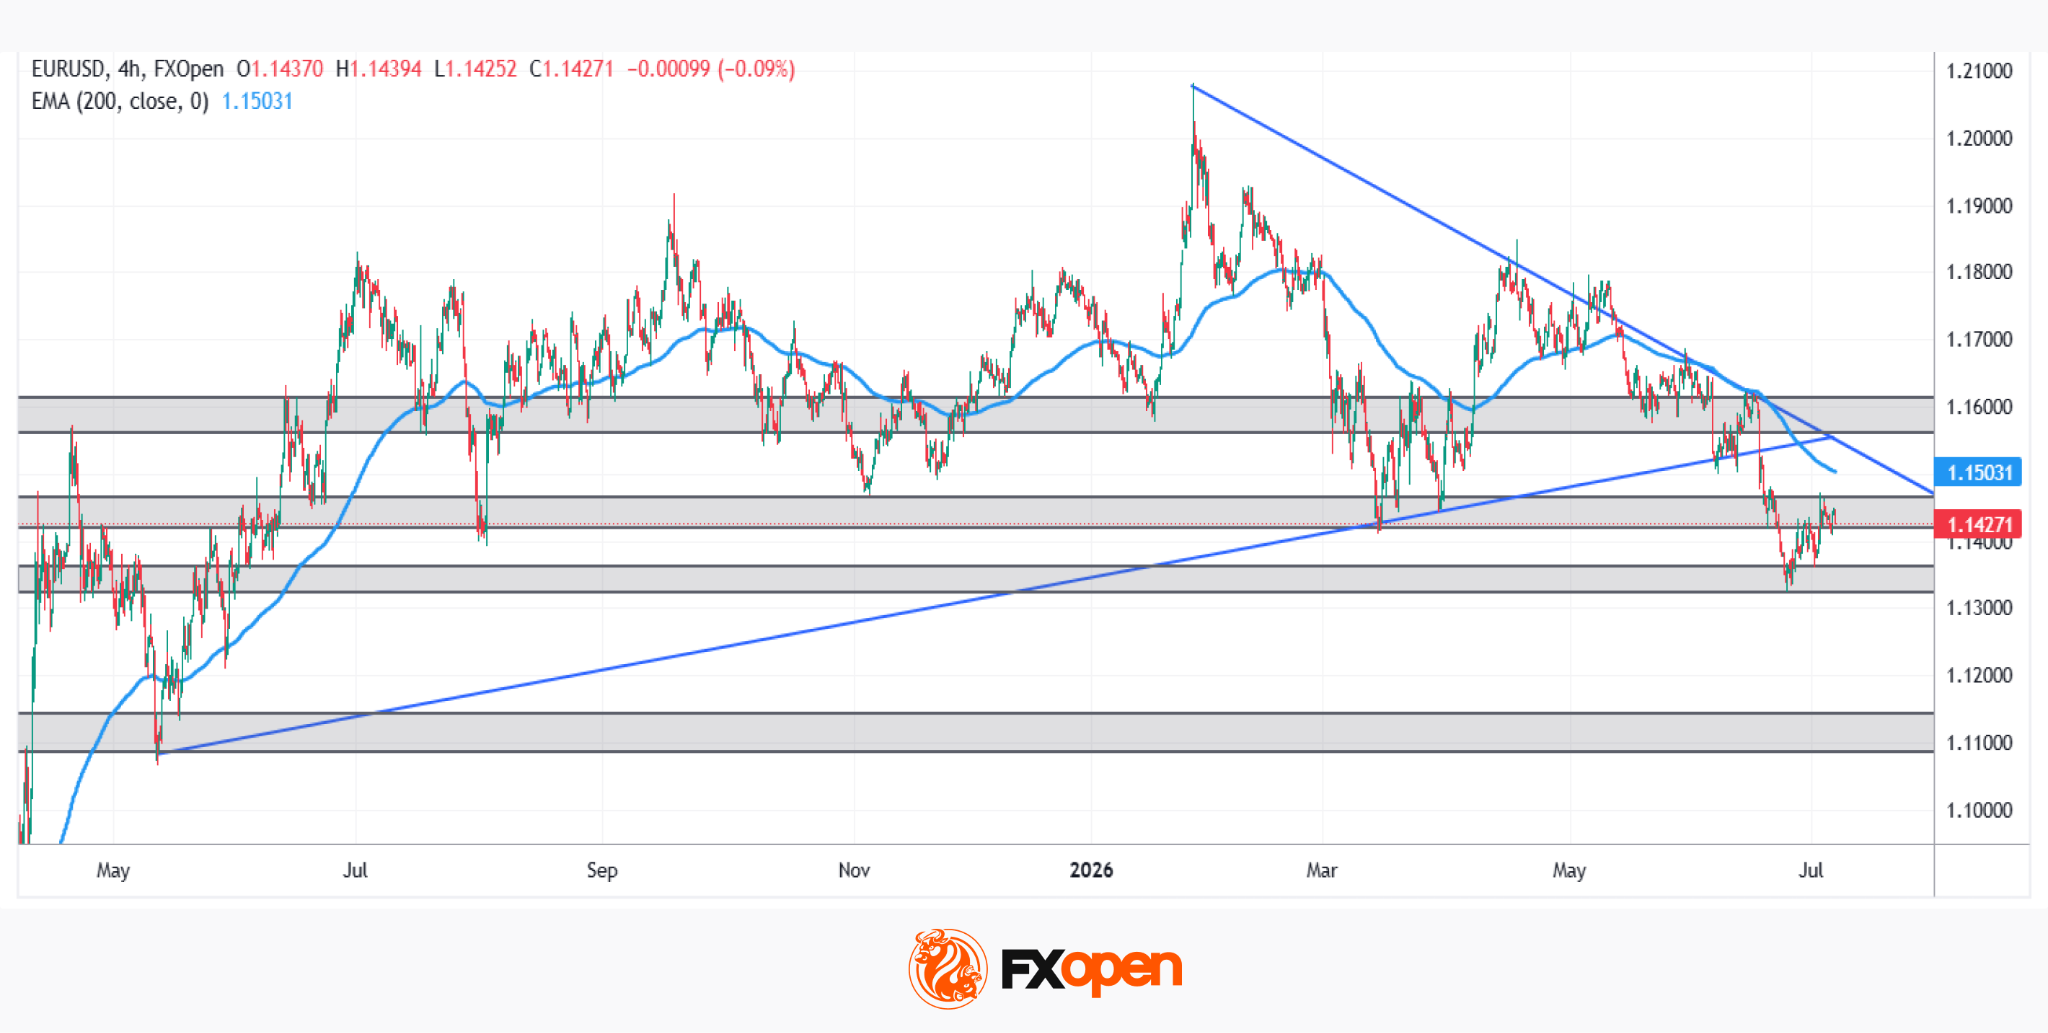
EUR/USD has spent roughly the past year confined within a broad consolidation range, as the chart illustrates, with price repeatedly oscillating between well-defined boundaries and no decisive breakout sustained in either direction.
Bullish Scenario
After briefly breaking below the range's base support, price snapped back quickly, reclaiming the range almost as fast as it left it. For renewed bullish momentum to take hold, EUR/USD first needs to hold above the 1.1420-1.1460 support zone. The next, more decisive test lies with the descending trendline originating from January's highs, which has been respected consistently throughout the year. This same area also converges with the 200-period EMA and the long-term ascending trendline broken to the downside in June. This confluence makes 1.1500-1.1550 the pivotal zone: a clean break above it would open the door for the euro to regain sustained strength against the dollar.
Bearish Scenario
The alternative reading is that price is currently only retesting the previously broken key support at 1.1420-1.1460. A decisive break below the low formed near 1.1320-1.1350 would confirm renewed downside momentum, clearing the path to resume the broader medium-term downtrend, where the next significant support comes into play around 1.1100-1.1150.
Either scenario will likely require confluence between technical structure and fundamentals, with central bank rhetoric and action remaining the key driver. ECB or Fed — which one becomes the catalyst for EUR/USD's next major trend?
Trade over 50 forex markets 24 hours a day with FXOpen. Take advantage of low commissions, deep liquidity, and spreads from 0.0 pips (additional fees may apply). Open your FXOpen account now or learn more about trading forex with FXOpen.
This article represents the opinion of the Companies operating under the FXOpen brand only. It is not to be construed as an offer, solicitation, or recommendation with respect to products and services provided by the Companies operating under the FXOpen brand, nor is it to be considered financial advice.
ECB’s Panetta: Fragile Outlook Means No Predetermined Path for Rates
European Central Bank Governing Council member Fabio Panetta said the Eurozone economy continues to face a delicate balance between persistent inflation risks and weakening growth, arguing that policymakers should avoid committing to any predetermined path for interest rates. "The outlook remains fragile. Upside risks to inflation continue to coexist with downside risks to growth," he said, underscoring the high degree of uncertainty surrounding the policy outlook.
Panetta argued that such an environment requires policymakers to remain flexible and closely monitor a broad range of indicators. He said the ECB must keep a close watch on geopolitical developments, energy markets, supply chains, wage growth and inflation expectations, adding that monetary policy should "avoid committing to a predetermined path." While acknowledging that the recent easing in oil prices following US-Iran negotiations could prove more favorable than the ECB assumed in its June projections, he stressed that the overall outlook remains too uncertain to justify firm forward guidance.
Looking beyond the immediate outlook, Panetta described the global economy as entering a "Great Reconfiguration," driven by geopolitical fragmentation, artificial intelligence, digital finance, demographic change and climate risks. Against that backdrop, he defended the ECB's June rate decision as "robust across a range of scenarios," suggesting policymakers believe flexibility rather than pre-commitment will remain the most appropriate approach as they assess incoming data ahead of future meetings.
Gold: Does It Have the Momentum to Set New Records?
- The Fed’s rate hike expectations limit gold’s rally potential.
- Capital inflows into ETFs and central bank purchases are supporting the gold price.
The US dollar failed to capitalise on the escalation of the conflict in the Middle East. Reports of a tanker incident in the Strait of Hormuz are putting US-Iran negotiations at risk. Nevertheless, Brent crude rose only slightly, while the resumption of the S&P 500 rally and the associated improvement in global risk appetite are undermining the greenback’s position.
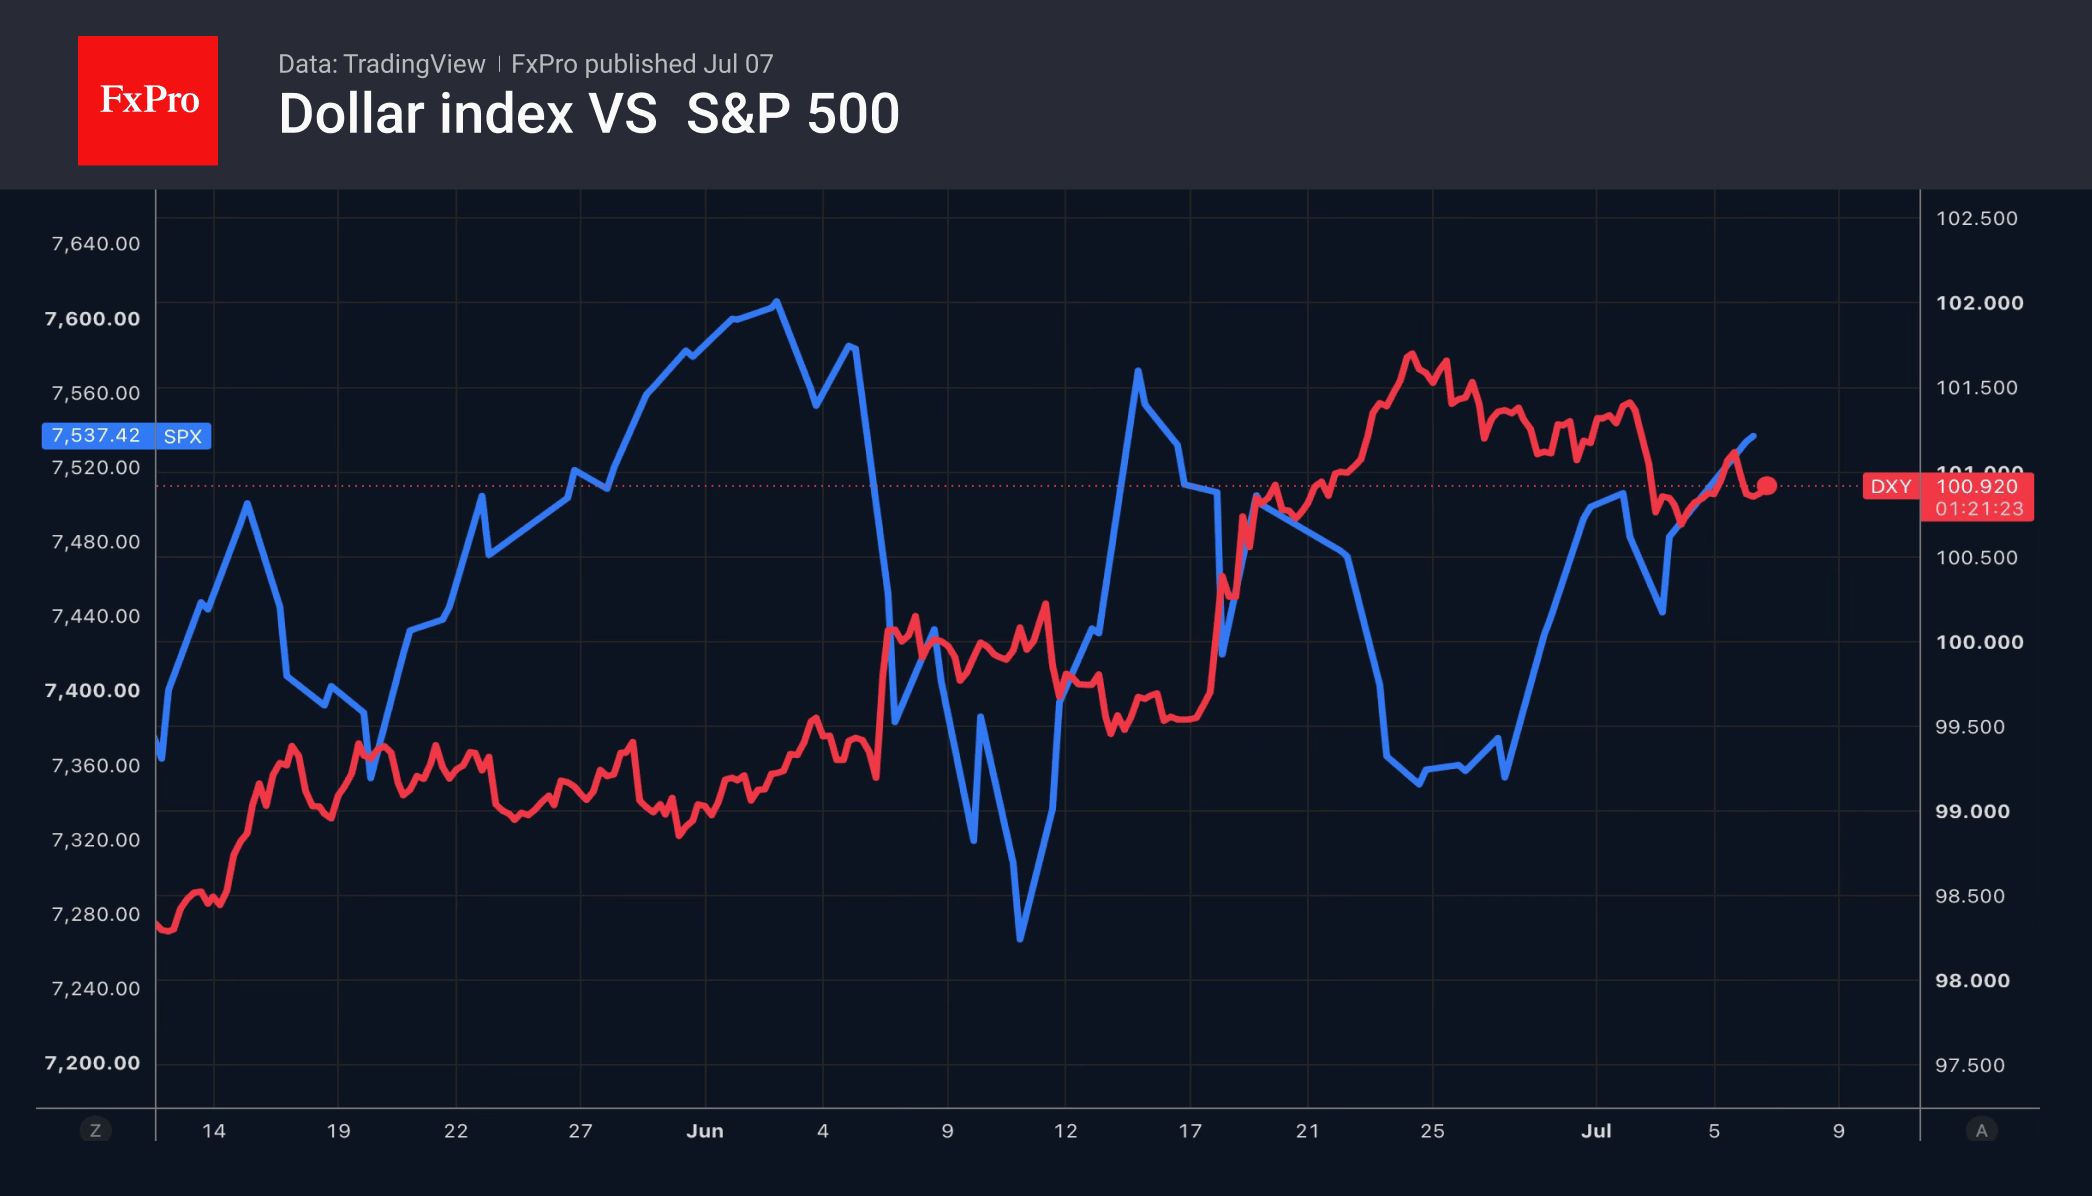
The futures market is pricing in a 3-in-4 chance of a Fed rate hike in 2026. This is allowing speculators to build up net long positions in the US dollar to their highest levels since 2015, leaving the US currency’s positions vulnerable. No sooner had Kevin Warsh adopted less hawkish rhetoric in Sintra than the markets had anticipated, and the employment figures disappointed, than the EURUSD soared sharply.
Lower chances of a Fed rate hike have allowed gold to find its footing. However, the Sword of Damocles (a potential federal funds rate hike due to persistent inflation) continues to hang over the precious metal. As the risks of an energy shock have receded, the inflationary nature of massive investments in artificial intelligence and weather-related supply chain disruptions remains a reality.
Fears that the Federal Reserve will tighten monetary policy are unlikely to allow gold to return to its record highs in 2026. However, HSBC remains optimistic, expecting that medium-term demand for gold as a means of diversifying investment portfolios, capital inflows into ETFs and increased purchases of bullion by central banks will allow the precious metal to rise.
Indeed, according to the World Gold Council, central banks increased their reserves by 41 tonnes in May, stepping up their bullion purchases. Poland and China were the most active. Since the start of the year, Poland has bought 64 tonnes, Uzbekistan 33 tonnes, China 25 tonnes and Kazakhstan 20 tonnes.
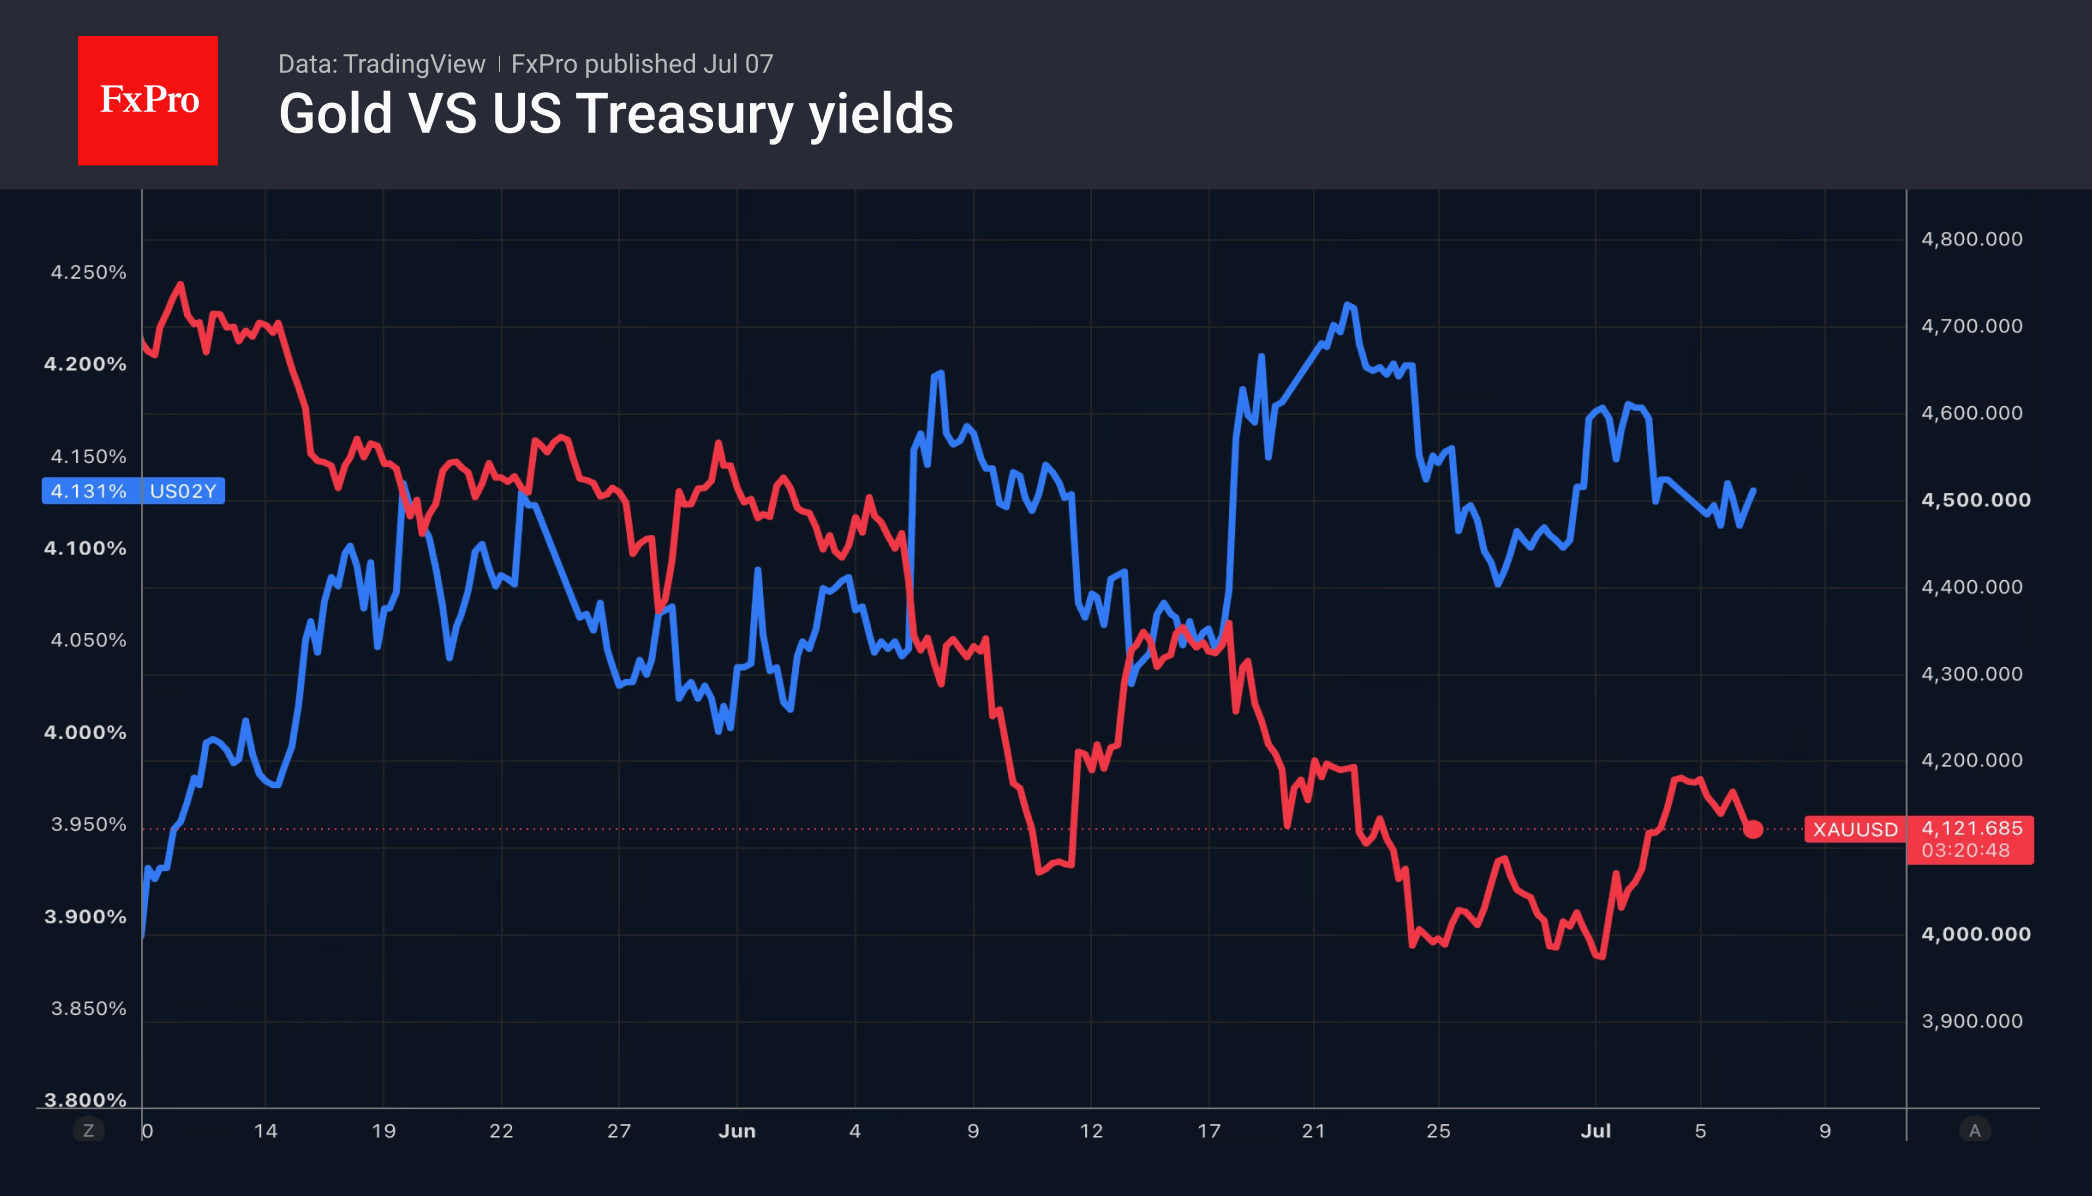
HSBC believes that, in the short term, gold will come under pressure due to the strong US dollar and high yields on US Treasury bonds. In reality, its fate depends on the futures market’s reassessment of the trajectory of the federal funds rate. In this regard, clues from the minutes of the June FOMC meeting are certain to influence gold.
The FxPro Analyst Team