
Sample Category Title
Stock Markets Surge on US-Iran Peace Progress and Soft Japan CPI
Key Takeaways
- Global equity markets extended their relief rally as optimism over a potential US-Iran peace agreement boosted risk appetite, triggering strong gains in Asian and US stock indices while crude oil prices continued to retreat.
- Japan’s softer-than-expected April inflation data reduced pressure on the Bank of Japan to tighten monetary policy aggressively, reinforcing Yen weakness and widening the policy divergence versus the hawkish Federal Reserve.
- Cooling bond yields and easing geopolitical tensions provided fresh support for growth and technology stocks, while improving labour relations at Samsung Electronics helped reduce concerns over semiconductor supply-chain disruptions.
- Chart of the day: Nikkei 225 kickstarts new bullish impulsive up move sequence towards new all-time highs above 61,955 key short-term support.
Top Macro Headlines
- US-Iran peace deal reaches “in progress”: Global market sentiment shifted gear to “risk on” dramatically after Iran said the latest proposal from the US has partly bridged the gap between them, increasing the odds of a peace deal.
- Japan April CPI cools to 4-year low: Japan's core consumer price index, which excludes fresh food but includes energy, rose 1.4% year-on-year in April, coming in softer than market forecasts of 1.7%. Also, the Bank of Japan’s preferred inflation data, the core-core CPI, excluding fresh food and energy, rose at a slower pace of 1.9% y/y versus 2.4% in March. This reading marked the lowest level since July 2024 and fell below the Bank of Japan's 2% target, largely due to government fuel subsidies offsetting the Iran war oil shock.
Key Macro Themes
- Geopolitical “risk on” volatility unlocked: Capital markets are actively pricing out the prolonged geopolitical risk premium. The temporary pause in Middle East military escalation has triggered immediate short-covering across multiple asset classes, especially boosting airlines and tech while tanking crude oil.
- Diverging central bank paths: While the Fed minutes signal potential rate hikes due to sticky US inflation, the Bank of Japan finds itself with renewed breathing room. Japan's unexpectedly soft 1.4% y/y core CPI and 1.9% y/y core-core CPI prints suggest less urgency for immediate aggressive tightening, despite the ongoing weakness of the Yen.
- The billion-dollar tech IPO thaw: Led by SpaceX seeking a $1.75 trillion public footprint and OpenAI moving into confidential prospectus filings, the multi-trillion-dollar tech listings boom is shifting structural market liquidity back toward equities.
Global Market Impact: Last 24 Hours
Equities: Global equities experienced a massive relief rally. Wall Street rallied for the second consecutive session, with a fresh all-time closing high seen in the Dow Jones Industrial Average. The energy sector lagged, down 1%.
Fixed Income: Sovereign bond yields pulled back, providing much-needed relief from the recent historic debt selloff. The benchmark US 10-year Treasury yield slid for the second consecutive session by 1 bps to 4.57%, and the longer-term 30-year yield fell by 3 bps to 5.09%.
FX: The US Dollar Index, DXY, traded almost unchanged on Thursday, 21 May, capped by renewed risk-on appetite. The Japanese Yen faced depreciation pressure following the softer-than-expected Japan CPI data, as it probed the 159.10/35 per USD level that may trigger verbal intervention.
Commodities: WTI and Brent crude oil saw losses for the second consecutive session, dropping by 1.1% and 0.2% on Wednesday, 21 May, as the geopolitical risk premium from the Middle East conflict evaporated on peace hopes. Meanwhile, spot Gold traded almost unchanged at $4,543/oz, below its 20-day moving average at $4,611/oz.
Asia Pacific Impact
- Stock markets: Benchmark Asia Pacific stock indices kick-start today’s session on a bullish footing, reinforced by overnight gains seen in the US stock market. Nikkei 225 rose 1.8%, Hang Seng Index gained 0.5%, KOSPI rose 0.5%, ASX 200 added 0.4%, and STI advanced 0.2% at the time of writing.
- Currencies and monetary policy: The Indonesian Rupiah caught a significant bid and strengthened after Bank Indonesia implemented an interest rate hike to defend the currency. Conversely, Japan's unexpectedly soft CPI data gives the Bank of Japan breathing room, further complicating efforts to defend the Yen from speculative short selling.
- Corporate and supply chain: Providing a major tailwind for regional tech, the Samsung union officially suspended its planned strike after reaching a tentative pay deal, easing severe risks to global semiconductor and memory supply chains.
Top 3 Events to Watch Today
- UK Retail Sales (Apr) - 2.00 pm SGT; consensus: 1.3% y/y, Mar: 1.7% Impact: GBP/USD, GBP crosses, FTSE 100
- US University of Michigan Consumer Sentiment Final (May) - 10.00 pm SGT Impact: USD, US stock indices
- Updates on US-Iran peace deal Impact: All asset classes
Chart of the Day: Nikkei 225 En Route to Fresh All-Time High
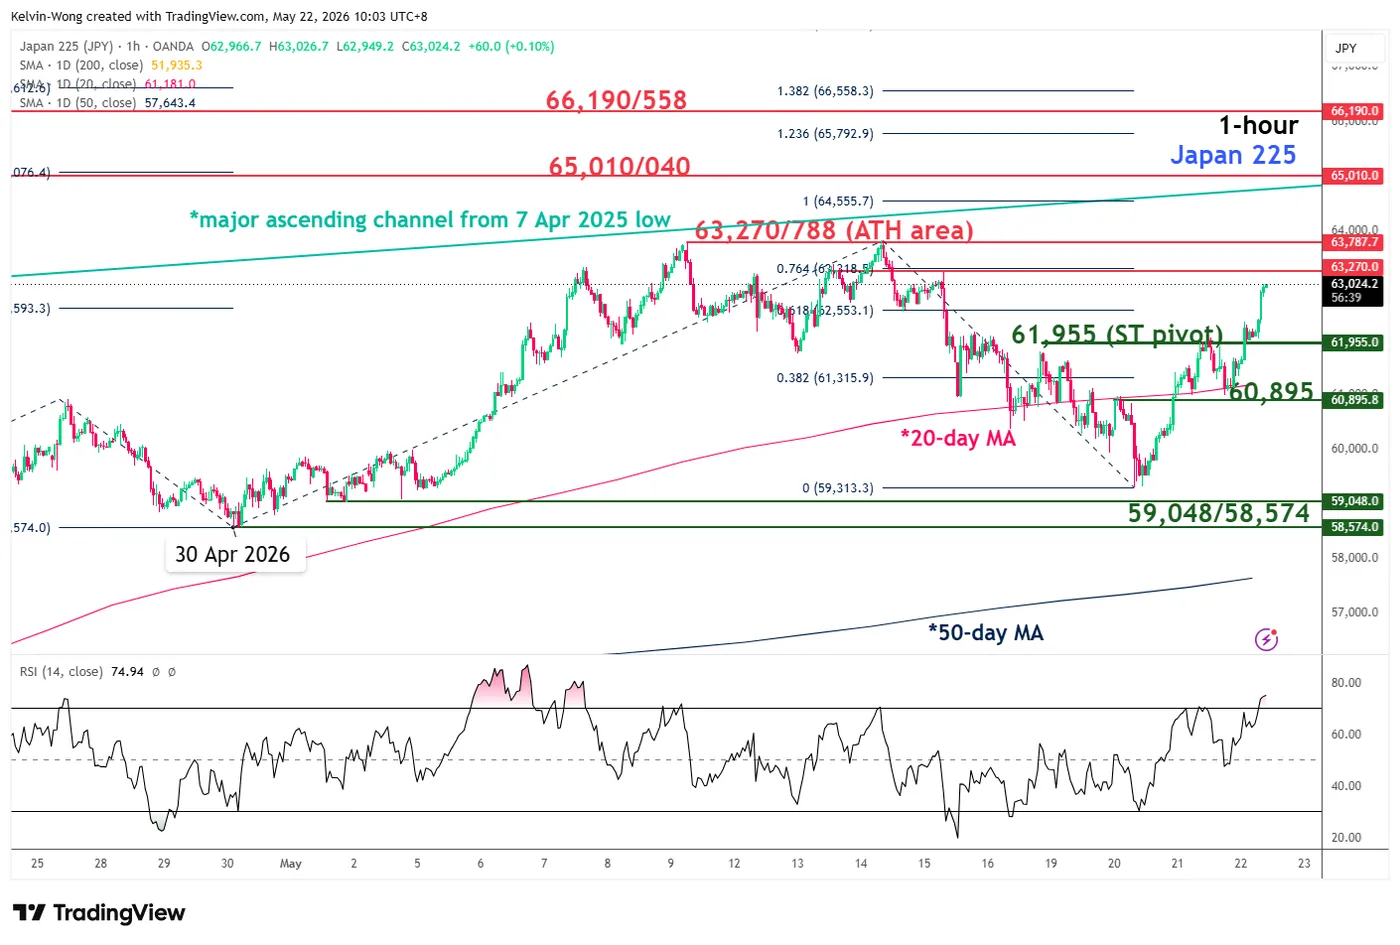
Fig. 1: Japan 225 CFD minor trend as of 22 May 2026. Source: TradingView.
The recent bullish reversal seen on the Japan 225 CFD, a proxy of the Nikkei 225 futures, after a break below and a reintegration back above its 20-day moving average on Wednesday, 20 May 2026, has suggested that a new potential bullish impulsive up move sequence is underway towards new record highs.
Watch the 61,955 key short-term pivotal support to maintain the bullish bias. A clearance above the current all-time area of 63,270/788 sees the next intermediate resistances coming in at 65,010/040 and 66,190/558, Fibonacci extension clusters.
On the other hand, a break and an hourly close below 61,955 invalidates the bullish scenario, potentially leading to a minor corrective setback to retest the 20-day moving average at 60,985. Further weakness is possible, with potential to extend towards the next intermediate support at 59,048/58,574.
USD/JPY Rally Reclaims Most Losses, Trend Sentiment Improves
Key Highlights
- USD/JPY started a decent increase and reclaimed 158.00.
- A key bullish trend line is forming support at 158.50 on the 4-hour chart.
- EUR/USD extended losses and traded below 1.1620.
- USD/CAD is showing signs of strength above the 1.3750 resistance.
USD/JPY Technical Analysis
The US Dollar remained supported above 156.50 against the Japanese Yen. USD/JPY formed a base and started a fresh increase above 158.00.
Looking at the 4-hour chart, the pair above the 50% Fib retracement level of the downward move from the 160.72 swing high to the 155.03 low. The pair settled above 158.80, the 100 simple moving average (red, 4-hour), and the 200 simple moving average (green, 4-hour).
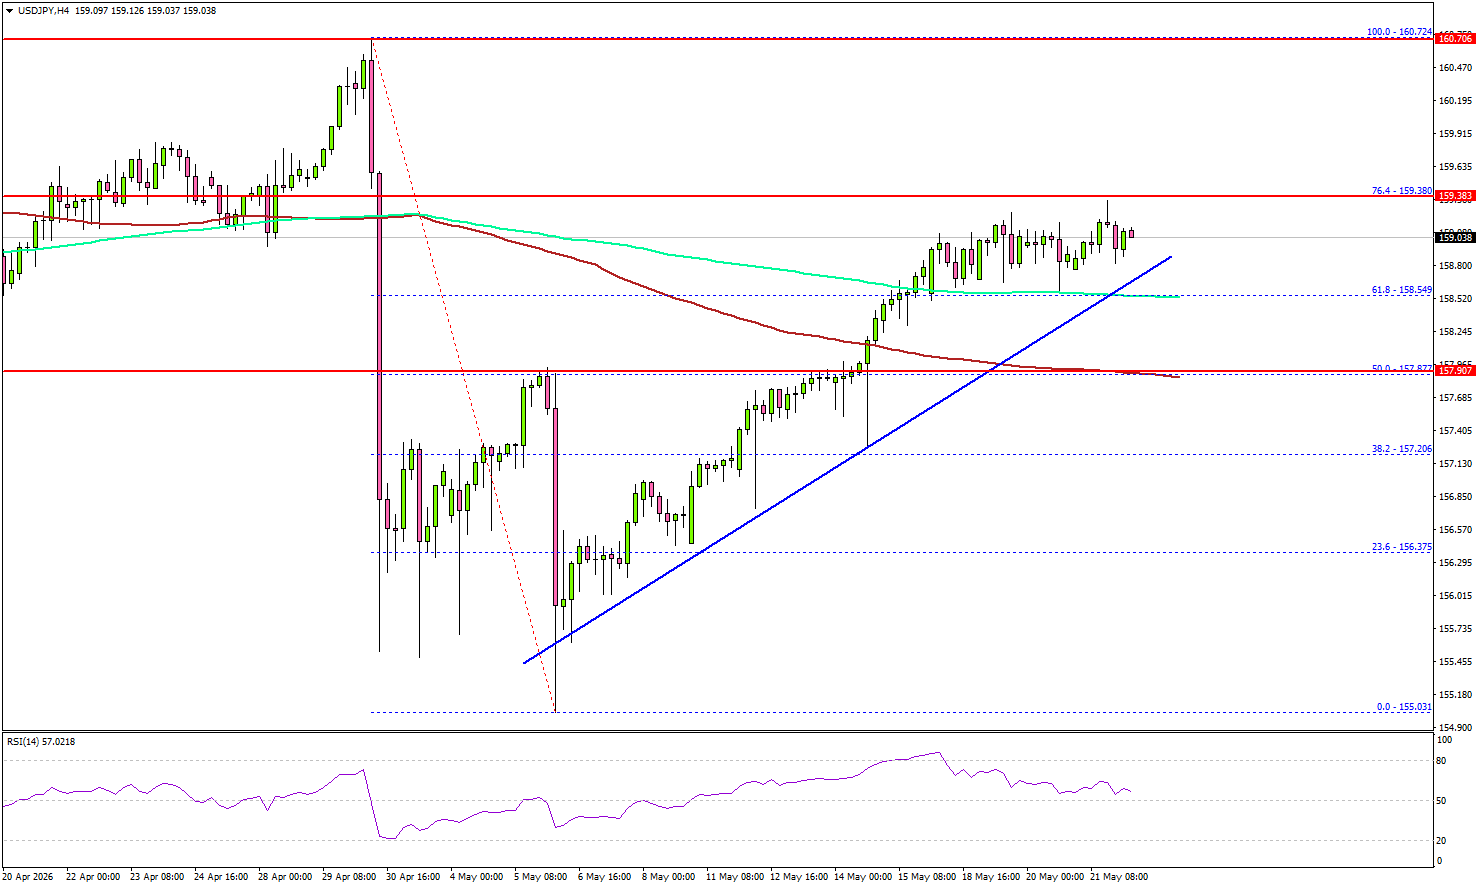
Besides, there is a key bullish trend line forming support at 158.50. On the upside, the pair faces resistance at 159.40 and the 76.4% Fib retracement level of the downward move from the 160.72 swing high to the 155.03 low.
The first major resistance sits at 160.00. A close above 160.00 could open doors for gains above 160.50. In the stated case, the bulls could aim for a move to 162.00.
If there is another decline, the pair could find bids near 158.50. The first major support sits near the 158.00 level. The next support could be 157.80 and the 100 simple moving average (red, 4-hour). A close below 157.80 might initiate a drop to 156.50. Any more losses might open the doors for a drop toward the 155.00 zone.
Looking at EUR/USD, the pair remained in a negative zone, and the bears could aim for a clear move below the 1.1550 support.
Upcoming Key Economic Events:
- Fed Chair Warsh Swearing-in Ceremony.
- Michigan Consumer Sentiment Index for May 2026 (Prelim) – Forecast 48.2, versus 48.2 previous.
Silver’s $90 Breakout Dream Fades, but Structural Deficit Keeps $70 Floor Alive
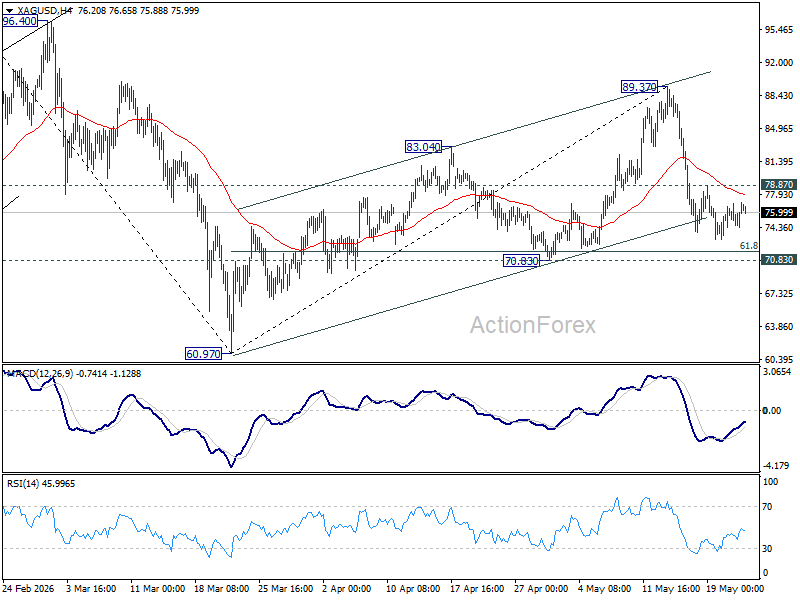
Silver has endured a violent reversal in the past two weeks, swinging from near $90 to the mid-$70s as geopolitical panic surrounding the Iran conflict intensified and then eased sharply. The initial steep decline was fueled by fears of an imminent US strike on Iran earlier in the week and a potential collapse of the fragile ceasefire framework, which sent Brent crude above $111. But sentiment shifted quickly after the White House postponed the strikes, and signaled negotiations with Tehran were entering the “final stages”.
The more important story may be what did not happen. Despite intense liquidation pressure across commodities, rates, and broader macro markets this week, Silver refused to break decisively below the mid-$73 area. That resilience reinforces the view that a structural physical-demand floor remains firmly intact around the $70–74 corridor. Industrial demand tied to solar photovoltaics and electrification continues to outpace mine supply in 2026, creating a persistent structural deficit that long-term buyers appear willing to defend aggressively during sharp pullbacks.
As a result, Silver may now be entering a broad consolidation phase. Unless there is a meaningful resolution to the Iran conflict and a deeper unwind in inflation fears there is unlikely to be enough momentum to sustain a breakout above $90. At the same time, structural demand should continue keeping the metal comfortably supported above $70. Silver is therefore likely to remain trapped within a broad $70–$90 range over the coming weeks.
Technically, a firm break above 78.87 minor resistance would suggest Silver has already started another upleg within the broader range structure and reopen the path toward 89.37 resistance next.
Japan Core Inflation Slows to Four-Year Low as Weak Price Momentum Challenges BoJ Hawks
Japan’s underlying inflation slowed sharply in April, creating increasingly difficult conditions for the Bank of Japan to justify near-term rate hikes despite recent hawkish rhetoric from several policymakers.
CPI core, excluding fresh food, eased from 1.8% yoy to 1.4% yoy, well below expectations of 1.7% yoy and marking the slowest pace since March 2022. Headline CPI also edged lower from 1.5% yoy to 1.4% yoy, remaining below the BoJ’s 2% target for a fourth consecutive month.
The details of the report reinforced signs that domestic inflation momentum is weakening rather than broadening. CPI core-core, which excludes both fresh food and energy, slowed from 2.4% yoy to 1.9% yoy, while service-sector inflation moderated to just 0.9%. A sharp -10.6% drop in education fees weighed heavily on services prices and offset continued increases across other categories.
The report also highlighted how some of the extreme price pressures seen last year have faded, with rice prices rising just 0.6% yoy compared with a massive 98.4% surge in April 2025. Energy prices fell -3.9% yoy in April following a -5.7% decline in March due to the government measures.
| Indicator | Previous | Latest |
|---|---|---|
| Headline CPI (yoy) | 1.5% | 1.4% |
| CPI Core ex-Fresh Food (yoy) | 1.8% | 1.4% |
| CPI Core-Core ex-Fresh Food & Energy (yoy) | 2.4% | 1.9% |
| Service Inflation (yoy) | — | 0.9% |
| Energy Prices (yoy) | -5.7% | -3.9% |
| Rice Prices (yoy) | — | 0.6% |
Barkin, Goolsbee Signal Growing Fed Concern Over Persistent Inflation Risks
Federal Reserve officials Thomas Barkin and Austan Goolsbee signaled growing concern on Thursday that inflation pressures may prove more persistent than previously expected, reinforcing the broader market shift toward a higher-for-longer interest rate outlook. While neither policymaker explicitly endorsed another rate hike, both emphasized that inflation progress has stalled and that policymakers cannot assume recent supply-driven price shocks will fade smoothly on their own.
Richmond Fed President Thomas Barkin said the Fed’s decision to hold rates steady at the last meeting “made sense” as policymakers gathered more clarity on inflation and labor market developments amid the Middle East conflict and broader economic disruptions. However, he also warned that policymakers may soon face pressures on “the employment side of our mandate, the inflation side of our mandate, or conceivably both.”
Barkin specifically questioned whether the Fed can continue relying on its traditional approach of “looking through” supply shocks, warning that repeated waves of geopolitical tensions, trade fragmentation, rising debt, and supply disruptions could eventually risk “loosening the anchor” for inflation expectations.
Nevertheless, Barkin stopped short of prioritizing either inflation or labor market risks, saying he was “not leaning toward overly focusing on one side or the other.” Still, his remarks reflected increasing unease inside the Fed that structural inflation pressures linked to energy costs and broader global fragmentation may not fade quickly. Markets have increasingly shifted toward pricing scenarios where rates stay elevated for longer and where further tightening remains possible if inflation fails to moderate convincingly.
Chicago Fed President Austan Goolsbee struck a similarly cautious tone, saying “we have a pretty significant inflation problem developing,” while noting that the labor market has remained “mostly stable.” Goolsbee added that “we were making progress, then we stopped making progress,” reinforcing concerns that disinflation momentum has stalled.
The remarks from both officials continue the broader hawkish repricing already underway across rates markets, with Treasury yields remaining elevated as investors increasingly reassess how long restrictive Fed policy may ultimately need to stay in place.
Cryptos Pulled Back but Sentiment Rebounds: Opportunity? BTC and Ethereum Technical Outlook
- Bitcoin retraced from the $80,000 level, along with other altcoins, and they are lagging US equities after the latest US-Iran peace draft.
- Cryptos have been consolidating for a while, but present interesting technical indications. A trap or an opportunity?
- Exploring technical analysis and trading levels for Bitcoin and Ethereum.
Bitcoin has pulled back from the important $80,000 level, and this drop has also affected the wider altcoin market.
Right now, cryptocurrencies are somewhat falling behind US stocks after the recent US-Iran peace draft. Nasdaq, normally highly correlated to digital assets, has quickly moved back toward new highs thanks to optimism about diplomacy, but despite the correlations, cryptocurrencies have barely moved.
This clear difference shows that digital assets are not following the usual trends in the broader market, at least for now.
Cryptocurrencies have been stuck in a long period of relative sideways movement, unable to break out as some traders hoped.
This may have been frustrating for those looking for quick gains, but there are still some interesting technical signals to watch. The big question now is whether this slow price action is a warning sign or a chance to buy at a discount.
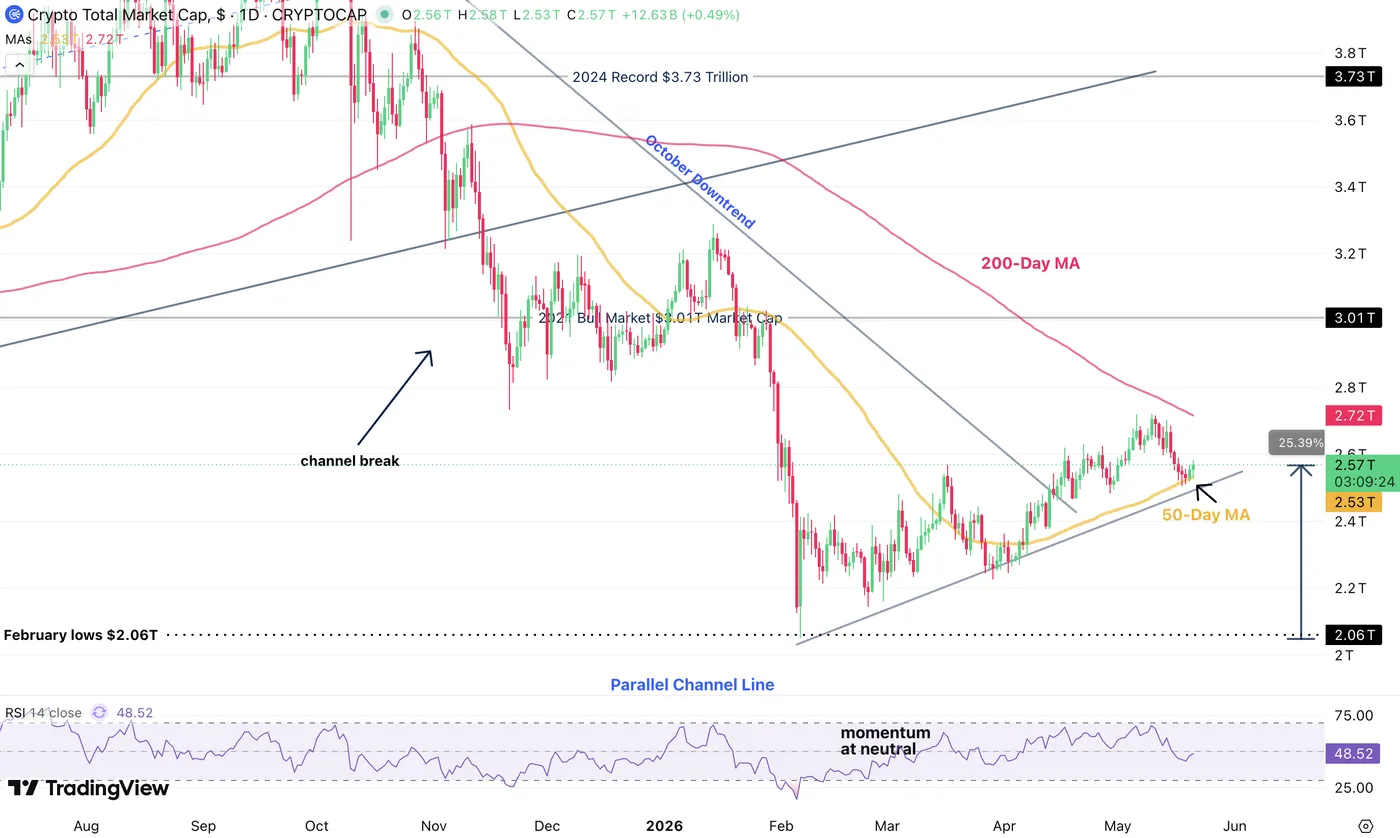
Total crypto market cap daily chart. Source: TradingView, May 21, 2026.
The digital asset market has shown resilience by bouncing off important moving averages, even though there has not been a big surge in retail trading.
If overall market sentiment remains positive and the peace talks continue to hold, Bitcoin and other cryptocurrencies could soon rally and make up for lost ground compared to tech stocks. But this will depend on whether investors can remain hopeful about the deal and its effect.
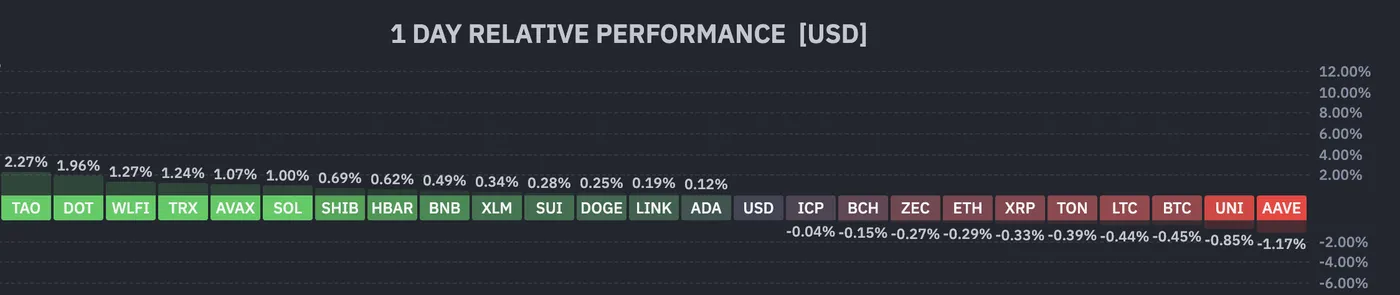
Daily crypto performance, 16:48. Source: Finviz, May 21, 2026.
Let's dive right into technical analysis and key trading levels for both Bitcoin and Ethereum to spot if a clear breakout is indeed in play from here.
Bitcoin (BTC) 4H Chart and Technical Levels
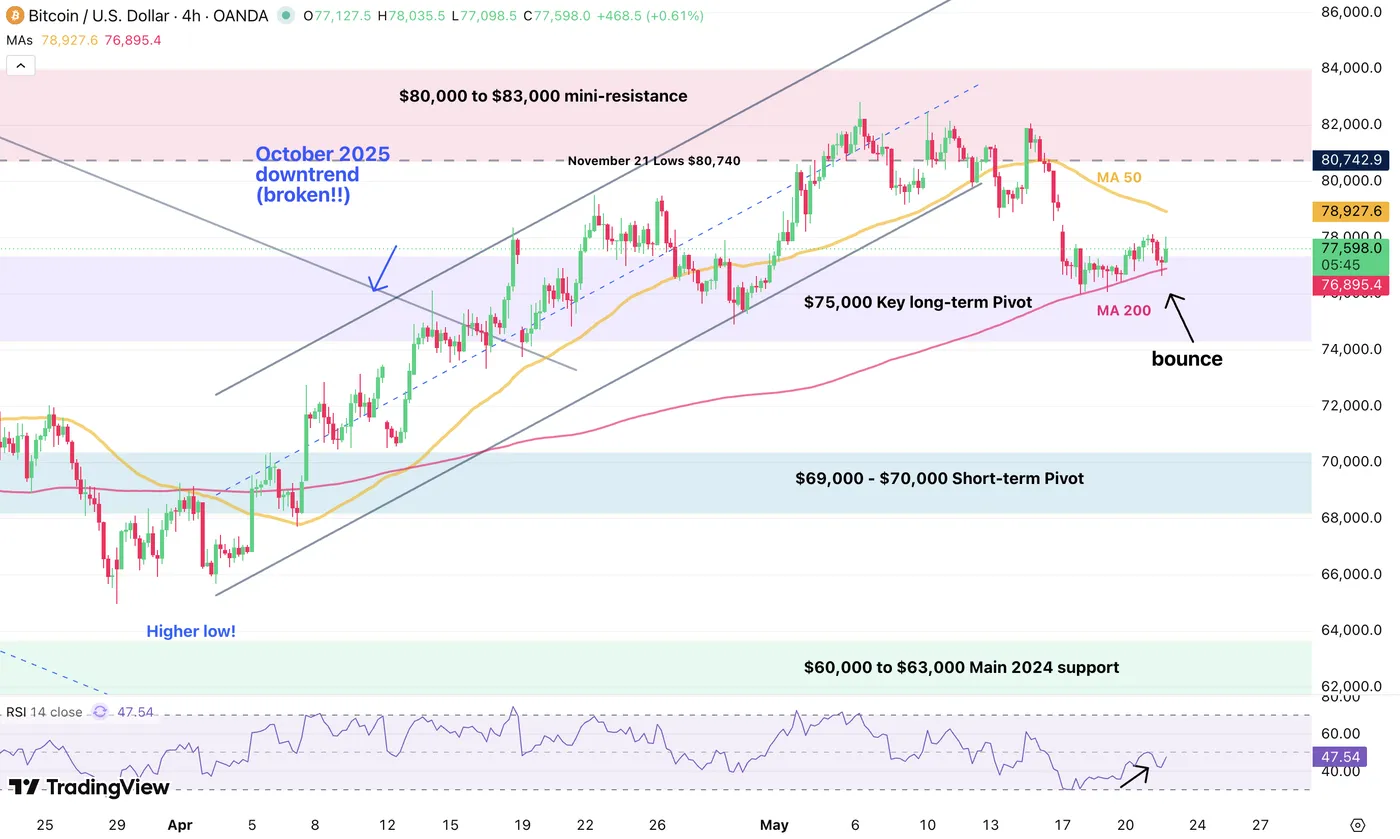
Bitcoin (BTC) 4H chart. Source: TradingView, May 21, 2026.
Bitcoin has broken its recent upward channel that brought the action above $80,000, but looking at current trading, the action is far from bearish.
The pullback stalled right at the 4H 200-period MA, $77,000, and is currently acting as support.
Bouncing back above $78,800, the 4H 50 MA, opens the way for a new test of a higher break.
On the other hand, bears will want to see a break of the 200 MA with an extension below $75,000.
Levels of interest for BTC trading:
Support Levels:
- 4H 200-period MA: $77,000
- $75,000 key long-term pivot, acting as resistance
- $70,000 short-term momentum pivot
- $60,000 to $63,000 main 2024 support, recent double bottom
- $59,935 February lows
Resistance Levels:
- $78,800, the 4H 50 MA
- $80,000 to $83,000 mini-resistance, entering and bullish above
- $82,500 cycle highs
- $90,000 to $95,000 minor resistance
- $98,000 to $100,000 pivotal resistance
- Current ATH resistance: $124,000 to $126,000
Ethereum (ETH) 4H Chart and Technical Levels
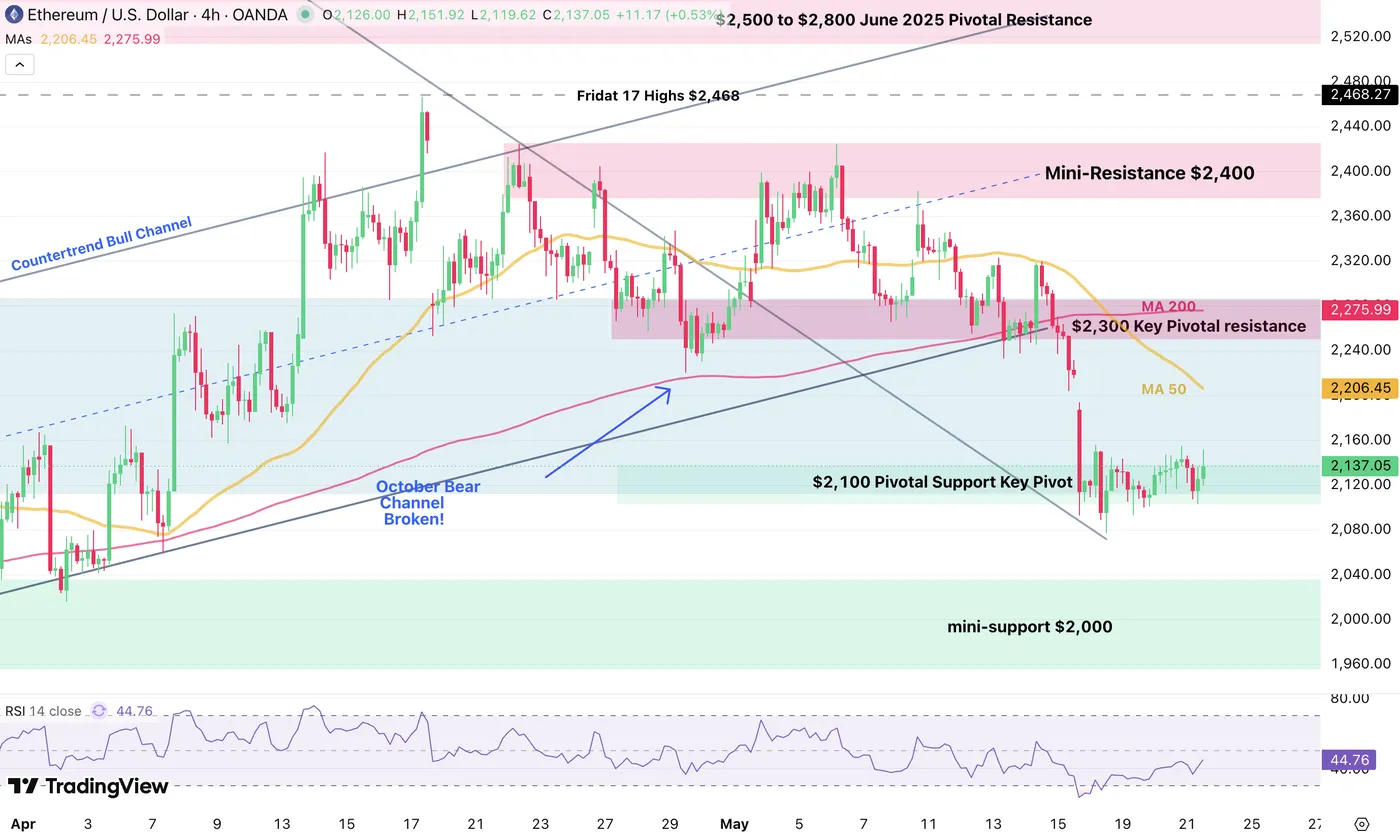
Ethereum (ETH) 4H chart. Source: TradingView, May 21, 2026.
Ethereum is still showing a somewhat weaker price action than Bitcoin, but is finding support at the bottom of its major pivot region, around $2,100.
Rebounding from here should relaunch better prospects for a rebound, but the action is not showing much impulse from here.
A bounce above $2,200, the 50-period MA, should clear the path for more bullish action ahead.
For bears, look for a clean break and close below $2,100.
Levels of interest for ETH trading:
Support Levels:
- Pivot zone lows: $2,100
- $1,700 to $1,800 pre-bounce 2025 key support, testing
- $1,744 February 6 lows
- $1,380 to $1,500 2025 support
- 2025 lows: $1,384
Resistance Levels:
- 4H 50 MA: $2,200
- Mini-resistance: $2,400
- $2,500 to $2,800 June 2025 pivotal resistance
- $3,000 to $3,200 major momentum pivot, test of $3,000
- $4,950 current new all-time highs
The narrative is easing, but keep track of WTI crude and the latest headlines to stay ahead of the game.
Safe trades.
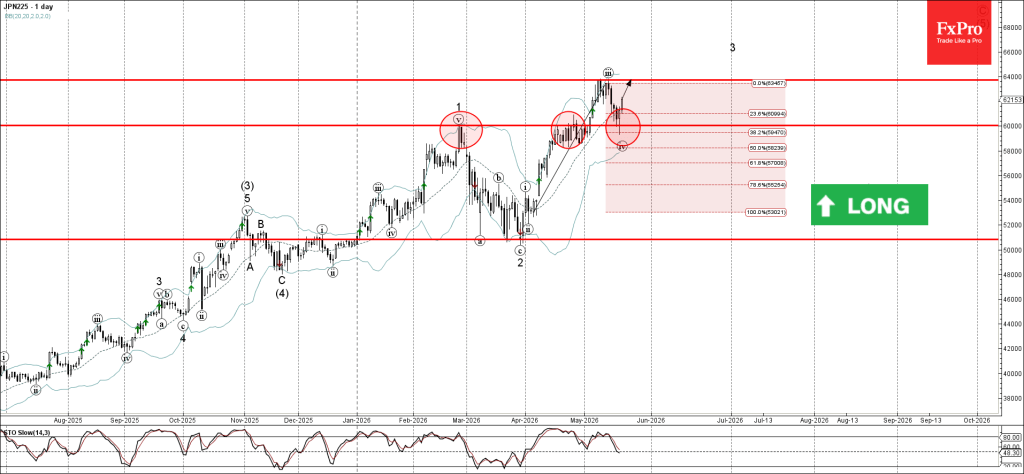
Nikkei 225 Wave Analysis
Nikkei 225: ⬆️ Buy
- Nikkei 225 reversed from round support level 60000.00
- Likely to rise to resistance level 64000.00
Nikkei 225 index recently reversed up from the support zone between the round support level 60000.00 (former strong resistance from February) and the 38.2% Fibonacci correction of the upward impulse from April.
The upward reversal from this from the support zone stopped the previous minor correction iv.
Given the strong daily uptrend, Nikkei 225 index can be expected to rise to the next resistance level 64000.00 (which stopped the previous impulse wave iii).
Eco Data 5/22/26
| GMT | Ccy | Events | Act | Cons | Prev | Rev |
|---|---|---|---|---|---|---|
| 22:45 | NZD | Retail Sales Q/Q Q1 | 0.90% | 0.50% | 0.90% | |
| 22:45 | NZD | Retail Sales ex Autos Q/Q Q1 | 1.00% | 0.80% | 1.50% | 1.40% |
| 23:01 | GBP | GfK Consumer Confidence May | -23 | -28 | -25 | |
| 23:30 | JPY | National CPI Y/Y Apr | 1.40% | 1.50% | ||
| 23:30 | JPY | National CPI Core Y/Y Apr | 1.40% | 1.70% | 1.80% | |
| 23:30 | JPY | National CPI Core-Core Y/Y Apr | 1.90% | 2.40% | ||
| 06:00 | EUR | Germany GDP Q/Q Q1 F | 0.30% | 0.30% | 0.30% | |
| 06:00 | EUR | Germany GfK Consumer Confidence Jun | -29.8 | -33.7 | -33.3 | |
| 06:00 | GBP | Retail Sales M/M Apr | -1.30% | -0.60% | 0.70% | 0.60% |
| 06:00 | GBP | Public Sector Net Borrowing (GBP) Apr | 24.3B | 20.7B | 12.6B | 11.5B |
| 08:00 | EUR | Germany IFO Business Climate May | 84.9 | 84.2 | 84.4 | 84.5 |
| 08:00 | EUR | Germany IFO Current Assessment May | 86.1 | 85.1 | 85.4 | |
| 08:00 | EUR | Germany IFO Expectations May | 83.8 | 83.5 | 83.3 | 83.5 |
| 12:30 | CAD | Industrial Product Price M/M Apr | 2.00% | 1.20% | 2.40% | |
| 12:30 | CAD | Raw Material Price Index M/M Apr | 2.60% | 2.70% | 12% | |
| 12:30 | CAD | Retail Sales M/M Mar | 0.90% | 0.60% | 0.70% | |
| 12:30 | CAD | Retail Sales ex Autos M/M Mar | 1.40% | 0.90% | 0.50% | |
| 14:00 | USD | UoM Consumer Sentiment May F | 44.8 | 48.2 | 48.2 | |
| 14:00 | USD | UoM 1-Yr Inflation Expectations May F | 4.80% | 4.50% |
| 22:45 | NZD |
| Retail Sales Q/Q Q1 | |
| Actual | 0.90% |
| Consensus | 0.50% |
| Previous | 0.90% |
| 22:45 | NZD |
| Retail Sales ex Autos Q/Q Q1 | |
| Actual | 1.00% |
| Consensus | 0.80% |
| Previous | 1.50% |
| Revised | 1.40% |
| 23:01 | GBP |
| GfK Consumer Confidence May | |
| Actual | -23 |
| Consensus | -28 |
| Previous | -25 |
| 23:30 | JPY |
| National CPI Y/Y Apr | |
| Actual | 1.40% |
| Consensus | |
| Previous | 1.50% |
| 23:30 | JPY |
| National CPI Core Y/Y Apr | |
| Actual | 1.40% |
| Consensus | 1.70% |
| Previous | 1.80% |
| 23:30 | JPY |
| National CPI Core-Core Y/Y Apr | |
| Actual | 1.90% |
| Consensus | |
| Previous | 2.40% |
| 06:00 | EUR |
| Germany GDP Q/Q Q1 F | |
| Actual | 0.30% |
| Consensus | 0.30% |
| Previous | 0.30% |
| 06:00 | EUR |
| Germany GfK Consumer Confidence Jun | |
| Actual | -29.8 |
| Consensus | -33.7 |
| Previous | -33.3 |
| 06:00 | GBP |
| Retail Sales M/M Apr | |
| Actual | -1.30% |
| Consensus | -0.60% |
| Previous | 0.70% |
| Revised | 0.60% |
| 06:00 | GBP |
| Public Sector Net Borrowing (GBP) Apr | |
| Actual | 24.3B |
| Consensus | 20.7B |
| Previous | 12.6B |
| Revised | 11.5B |
| 08:00 | EUR |
| Germany IFO Business Climate May | |
| Actual | 84.9 |
| Consensus | 84.2 |
| Previous | 84.4 |
| Revised | 84.5 |
| 08:00 | EUR |
| Germany IFO Current Assessment May | |
| Actual | 86.1 |
| Consensus | 85.1 |
| Previous | 85.4 |
| 08:00 | EUR |
| Germany IFO Expectations May | |
| Actual | 83.8 |
| Consensus | 83.5 |
| Previous | 83.3 |
| Revised | 83.5 |
| 12:30 | CAD |
| Industrial Product Price M/M Apr | |
| Actual | 2.00% |
| Consensus | 1.20% |
| Previous | 2.40% |
| 12:30 | CAD |
| Raw Material Price Index M/M Apr | |
| Actual | 2.60% |
| Consensus | 2.70% |
| Previous | 12% |
| 12:30 | CAD |
| Retail Sales M/M Mar | |
| Actual | 0.90% |
| Consensus | 0.60% |
| Previous | 0.70% |
| 12:30 | CAD |
| Retail Sales ex Autos M/M Mar | |
| Actual | 1.40% |
| Consensus | 0.90% |
| Previous | 0.50% |
| 14:00 | USD |
| UoM Consumer Sentiment May F | |
| Actual | 44.8 |
| Consensus | 48.2 |
| Previous | 48.2 |
| 14:00 | USD |
| UoM 1-Yr Inflation Expectations May F | |
| Actual | 4.80% |
| Consensus | |
| Previous | 4.50% |
Sunset Market Commentary
Markets
The European May PMIs painted a gloomy picture, putting the economy on track for a quarterly decline by 0.2%. The composite indicator fell to a 31-month low of 47.5. The decline was driven both by manufacturing and services. The former still eked out growth (51.4) but the momentum created by anticipative buying (ahead of price increases and supply disruptions) is waning. Services activity on the other hand tumbled to a 5-year low (46.4), hit hard by the surge in the cost of living. New orders contracted across sectors, resulting outstanding business being reduced to the largest extent since end 2024. Staff reduction overall was the sharpest since August 2013 (excluding the pandemic). The Middle East conflict left clear traces through sharply lengthening supplier delivery times and continued rising prices pressures. Input cost inflation rose to a 3.5 year high while prices charged rose at their fastest pace in 38 months. The survey owners say the price gauges correspond with inflation running close to 4% in coming months. The impact of high energy prices is clearly visible and ties the hands of the ECB, at least according to markets. The ECB at the April policy meeting was seen as laying the groundwork for a June hike. The central bank’s chief economist’s speech two weeks later kind of rubberstamped the idea. Philip Lane’s slide pack showed how the oil futures curve was and still is clearly closer to the adverse scenario, which required a “limited monetary response”. Sources told news agency Reuters that such move in June was nearly a done deal. Even if a peace deal was reached before the meeting, the ECB would probably act to preserve credibility after signaling the move in April, they said, adding that there would be no assurances that any deal would hold and that energy prices would remain high for some time. Money markets assume 2-3 rate hikes by the end of the year. Front-end yields add 4.5 bps today with the long end more or less flat. US yield changes vary between 2 and 5.1 bps in a bear flattening move. The euro is facing some selling pressure, driving back below EUR/USD 1.16 in a mild risk-off climate and rising oil prices which offset about half of yesterday’s intraday drop ($108.5). Stocks lose around 0.5% in Europe and the US. The US PMI was close to expectations with services stabilizing at 50.9 and manufacturing improving to 55.3 on precautionary buying. The composite gauge matched April’s 51.7, pointing at a meagre 1% annualized growth in Q2. The survey price gauges indicate that inflation looks set to rise further just as the economy cools, the survey noted, as a surge in firm costs resulted in sharply higher selling prices. Front-end yields hold on to earlier gains after the report.
News & Views
In the Norges Bank’s (NB) Q2 survey, households expect inflation to be 4.4% 12 months ahead (up 0.3% from Q1). Prices are expected to rise 4.7% over the next 2-3 years (+0.2 ppts from Q1). Annual inflation in 5 years is seen at 5.1% (up 0.3%). Price expectations among economists and social partners (3.3% 1-y) were more modest. Business leaders raised theirs for the next year to 4.1%. 46.7% expect purchase prices to increase more over the next 12 months compared to the previous year (+17.6% from Q1). 33.1% expect the company’s selling prices to increase more than previous year (+8%). Annual 2026 wage growth among social partners is seen at 4.5%, up 0.4 ppts. The NB at the May meeting already raised the policy rate by 25 bps to 4.25% amid too high and above-target inflation for several years. The survey doesn’t provide much reason for NB to change the indication that the policy rate still might be raised somewhat further by year end. Money markets see (more than) one additional 25 bps hike by September. At EUR/NOK 10.71, the krone holds at the strongest levels against the euro since early 2023.
UK private sector output fell for the first time since April 2025 with the UK composite PMI dropping from 52.6 to 48.5. The decline was due to a sharp downturn in the services economy (47.9, a 64 month low). Aside from the pandemic, it was the lowest level for nearly a decade. Manufacturing output still improved (52.4 from 51.8). The decline in the services sector was seen as being due to economic hesitancy and weaker investment sentiment, alongside delayed spending decisions in response to the Middle East war. Some respondents also cited political uncertainty weighing on confidence. Manufacturing still was supported by frontloading ahead of expected price rises and supply issues. Private payroll numbers fell for the twentieth successive month. Input inflation eased slightly since April, but remained well above its long-run average. Alongside higher energy and raw materials prices, wage pressures also added to costs. Prices charged by UK private sector firms continued to rise sharply, especially in manufacturing (factory gate prices rising at fastest pace since July 2022). Survey owner S&P indicates that the May PMI suggest a 0.2% quarterly contraction.
The Deal Is Still Quite Unsure, Crude Oil Back Above $100: WTI Technical Analysis
- WTI oil corrected strongly yesterday on Trump's announcement that a deal is close, but the reality could be less optimistic.
- Traders are preparing for a rocky path to peace, as oil rallies back above $100 with the situation still uncertain.
- Exploring an in-depth technical analysis of crude oil.
WTI crude oil corrected strongly yesterday following President Trump's optimistic announcement that a diplomatic deal was in its final stages, but the geopolitical reality is proving to be much less straightforward.
As the market quickly learned this morning, sometimes headlines are not enough, especially when Trump is posting a dozen each day.
Ayatollah Mojtaba Khamenei has reportedly announced that the nation insists on keeping its near-weapons-grade enriched uranium stockpile within its borders.
This condition remains an absolute dealbreaker for the United States, so this could prove to be another barrier to a longer-run deal.
Despite yesterday's massive wave of diplomatic enthusiasm, it is now clear that the proposed agreement still harbors severe, contentious roadblocks that must be navigated before any true resolution is reached.
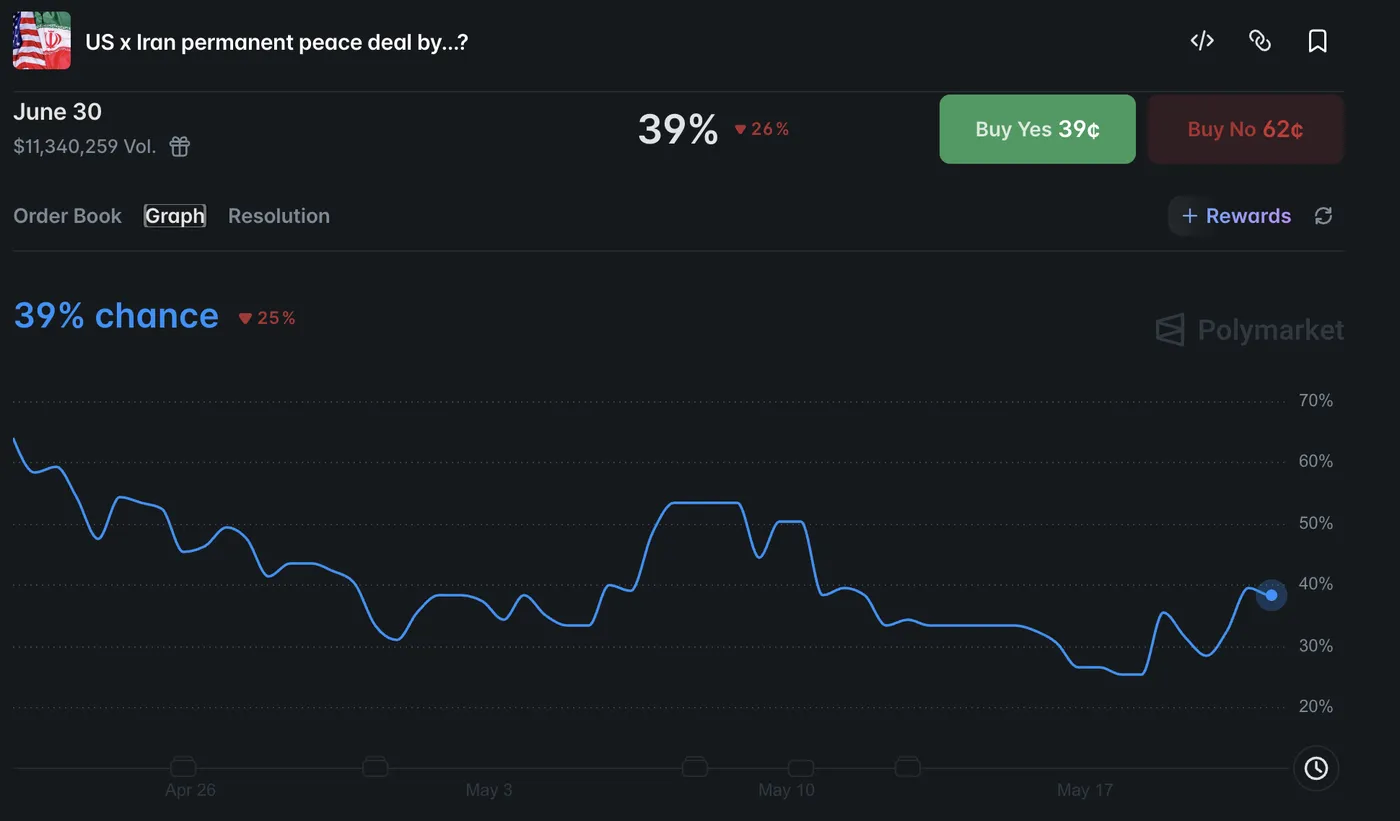
Peace deal odds for June 30. Source: Polymarket, May 21, 2026.
Consequently, traders are actively preparing for a highly rocky and volatile path to peace.
With the immediate diplomatic situation once again steeped in heavy uncertainty, the geopolitical risk premium is aggressively flooding right back into energy markets, sending WTI violently rallying back above the $100 psychological handle today.
Now, let's take a closer look at the technical analysis for WTI crude to see if prices can remain above $100 for long.
US Oil Intraday Timeframe Analysis
WTI 4H Chart and Technical Levels
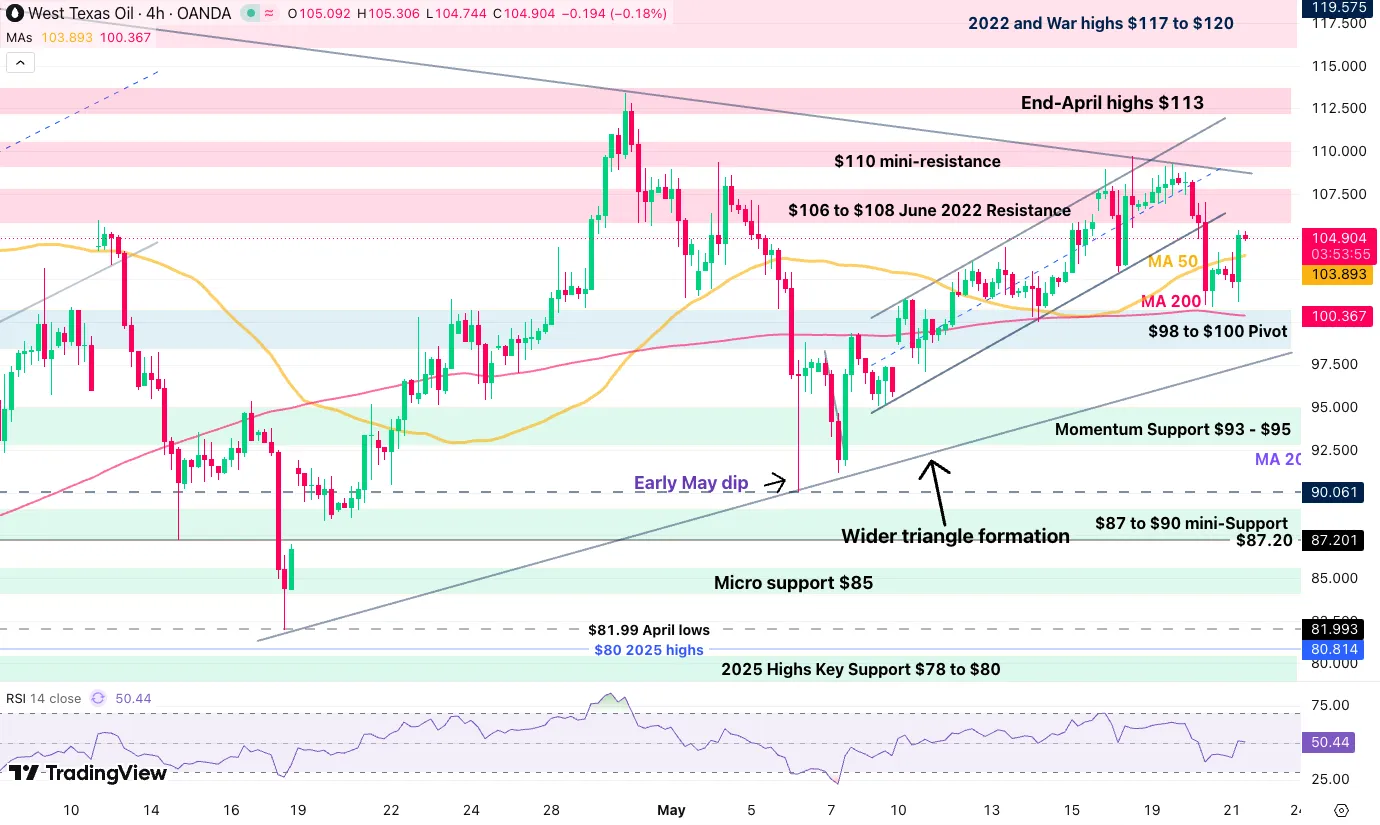
WTI Oil 4H chart. Source: TradingView, May 20, 2026.
WTI crude is stuck in a large triangle formation, currently consolidating between $110 and $98, a key development to watch.
Recently rejecting its upper bound on rumors of a new deal, the commodity broke its upward channel, but this was not enough for sellers to push momentum lower.
Buyers stepped back into the commodity just shy of the 4H 200-period MA and the commodity is now back 5% higher since. Check out reactions within the $106 to $108 resistance zone as the action gets back there.
WTI Technical Levels:
Resistance Levels
- $106.50 broken channel lows
- $106 to $108 June 2022 resistance
- $109 triangle resistance
- 2022 and Monday highs $117 to $120, larger channel top
Support Levels
- $98 to $100 pivot, 4H 200-period MA, short-term bearish below
- Momentum support $93 to $95
- $90 psychological level and past session's lows
- $87 to $90 mini-support
- $82 Friday 17 lows
- 2025 highs key support $78 to $80
1H Chart and Action Levels
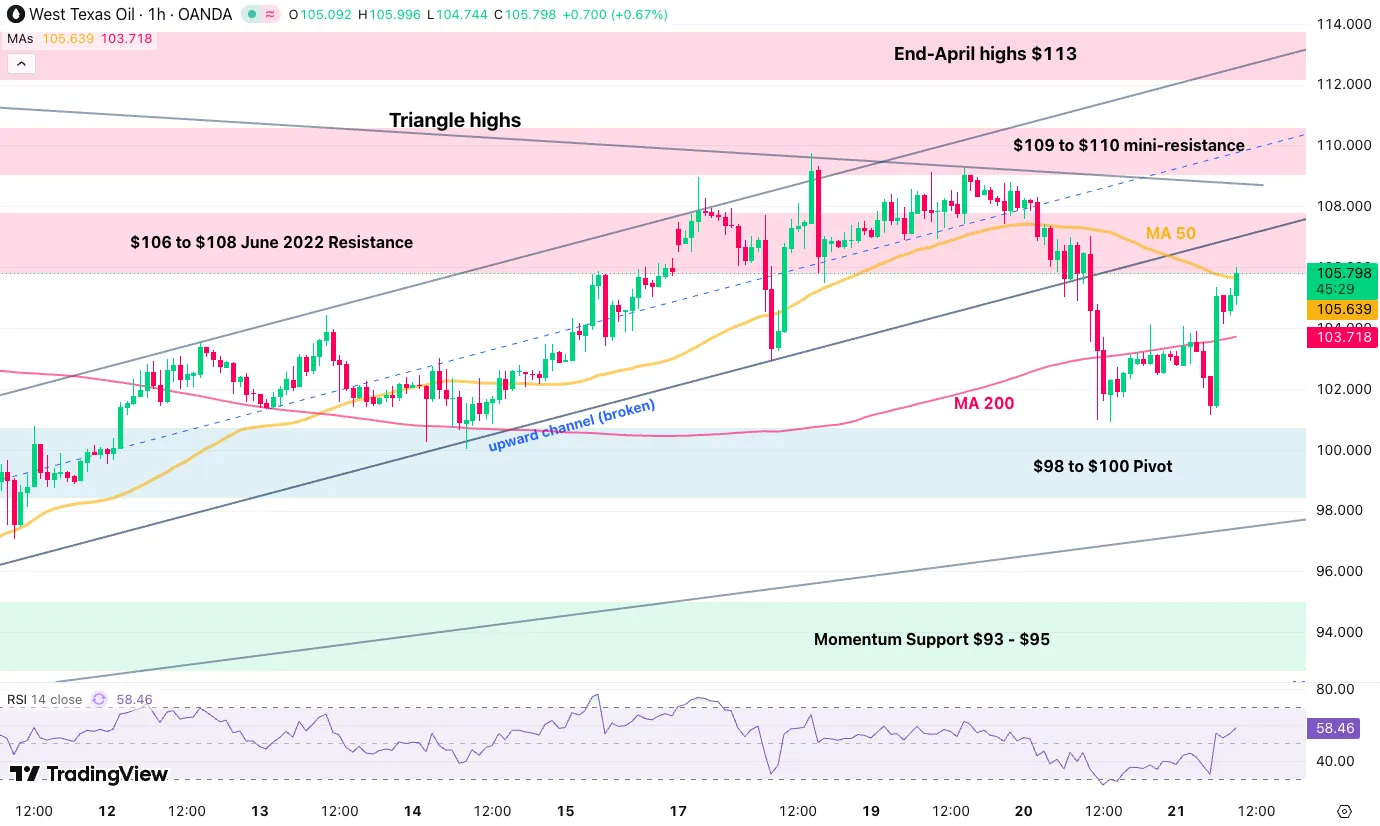
WTI Oil 1H chart. Source: TradingView, May 20, 2026.
Bulls are stepping back aggressively, as the narrative of a compromised deal continues to fuel intraday rallies.
The 50-hour MA has just been breached, but it could still weigh on the price action, hence traders will want to keep a close eye on it, with a 4H close for confirmation.
Mean-reversion traders will want to see either rejection here or at the upper resistance lines drawn from the triangle and broken channel formations.
Safe trades and keep your eyes on the news.