
Sample Category Title
GBP/USD Turns Bullish Again While EUR/GBP Drops More
GBP/USD is showing positive signs above 1.3440 and 1.3460. EUR/GBP declined and is now consolidating losses below 0.8680.
Important Takeaways for GBP/USD and EUR/GBP Analysis Today
The British Pound started a fresh increase above 1.3420 to enter a positive zone.
There is a bullish trend line forming with support at 1.3450 on the hourly chart of GBP/USD at FXOpen.
EUR/GBP is trading in a bearish zone below the 0.8660 pivot level.
There is a connecting bearish trend line forming with resistance near 0.8650 on the hourly chart at FXOpen.
GBP/USD Technical Analysis
On the hourly chart of GBP/USD at FXOpen, the pair remained well-bid above 1.3350. The British Pound started a decent increase above 1.3400 against the US Dollar.
The bulls were able to push the pair above the 50-hour simple moving average and 1.3440. The pair even climbed above 1.3480. A high was formed at 1.3490, and the pair is now consolidating gains above the 23.6% Fib retracement level of the upward move from the 1.3395 swing low to the 1.3490 high.
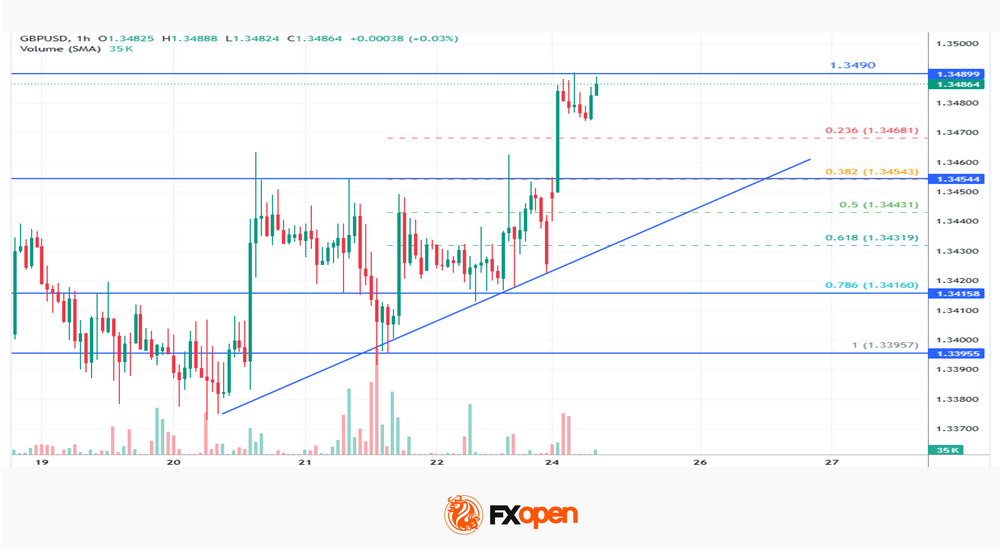
On the upside, the GBP/USD chart indicates that the pair is facing resistance near 1.3490. The next hurdle for the bulls could be 1.3500. A close above 1.3500 could open the doors for a move toward 1.3550. Any more gains might send GBP/USD toward 1.3600.
On the downside, the bulls might remain active near 1.3450. There is also a bullish trend line forming with support at 1.3450. If there is a downside break below 1.3450, the pair could accelerate lower.
The first major support could be at 1.3430 and the 61.8% Fib retracement, below which the pair could test 1.3470. The next key area for the bulls could be 1.3415, below which the pair could test 1.3395. Any more losses could lead the pair toward 1.3350.
EUR/GBP Technical Analysis
On the hourly chart of EUR/GBP at FXOpen, the pair started a steady decline from well above 0.8700. The Euro traded below 0.8680 against the British Pound.
The EUR/GBP chart suggests that the pair even declined below 0.8660 and the 50-hour simple moving average. A low was formed at 0.8630, and the pair is now consolidating losses below the 23.6% Fib retracement level of the downward move from the 0.8730 swing high to the 0.8630 low.
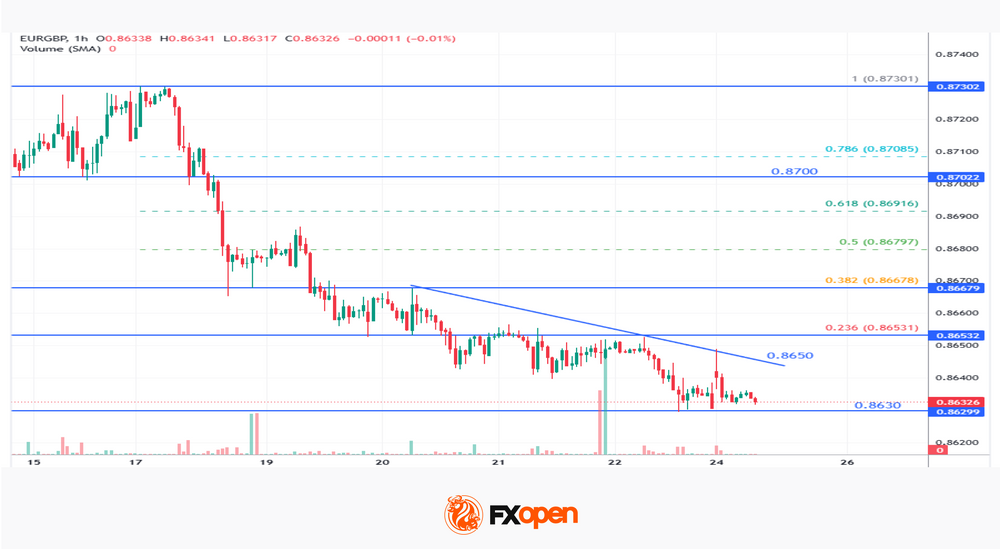
The pair is now facing resistance near a connecting bearish trend line at 0.8650. The next major barrier for the bulls could be 0.8665 and the 38.2% Fib retracement.
A close above 0.8665 might accelerate gains. In the stated case, the bulls may perhaps aim for a test of 0.8670. Any more gains might send the pair toward the 0.8730 pivot. The main hurdle for the bulls might be at 0.8780.
Immediate support could sit near 0.8630. The first key zone migbt be at 0.8600. A downside break below 0.8600 might call for more downsides. In the stated case, the pair could drop toward 0.8565.
Trade over 50 forex markets 24 hours a day with FXOpen. Take advantage of low commissions, deep liquidity, and spreads from 0.0 pips (additional fees may apply). Open your FXOpen account now or learn more about trading forex with FXOpen.
This article represents the opinion of the Companies operating under the FXOpen brand only. It is not to be construed as an offer, solicitation, or recommendation with respect to products and services provided by the Companies operating under the FXOpen brand, nor is it to be considered financial advice.
US Futures Gap Up on US-Iran Peace Deal Hopes With US Dollar in Retreat
Key takeaways
- Global risk sentiment improved sharply after senior US officials signalled that a US-Iran peace agreement may be nearing completion, triggering strong gains in US equity futures and sending the US dollar lower.
- The US economy is showing increasing stagflationary pressures as consumer sentiment collapsed to a record low while inflation expectations continued to rise, placing new Federal Reserve Chair Kevin Warsh under immediate policy pressure.
- Asia Pacific markets rallied on easing geopolitical fears, led by Japan’s Nikkei 225 hitting a fresh all-time high, while Southeast Asia’s accelerating shift toward biofuels is beginning to create broader food supply and inflation risks across the region.
- Chart of the day: WTI crude bearish break below 50-day moving average with key short-term resistance at $100.80/bbl. Potential near-term weakness may expose intermediate supports at $90.50 and $87.60.
Top macro headlines
- US officials signalled an imminent US-Iran peace deal: In contrast to US President Donald Trump, who stated earlier on Sunday that he told his representatives “not to rush” into any deal with Iran, senior US officials highlighted that the US and Iran are closing in on a deal to reopen the Strait of Hormuz. The development triggered an intraday rally in S&P 500 (+0.8%) and Nasdaq 100 (+1.3%) E-mini futures during Monday’s Asia opening session.
- US consumer sentiment plunges to an all-time record low: The University of Michigan consumer sentiment index dropped to 44.8 in May, the lowest level on record, falling below the pandemic and 2008 financial crisis troughs. The collapse is directly tied to soaring gasoline prices approaching $5 a gallon nationwide due to the ongoing Middle East conflict.
- Kevin Warsh sworn in as Fed Chair amid stagflation: Kevin Warsh officially took the helm of the Federal Reserve on Friday. He assumes leadership of a central bank navigating a difficult environment where surging fuel costs are driving up inflation while rapidly eroding consumer demand.
- Gold surges as dollar weakens: Spot gold prices rose 1.2% to $4,564/oz on Monday, supported by a weaker US dollar and lower oil prices due to renewed optimism over an imminent US-Iran peace deal.
- Southeast Asia pivots to biofuels, threatening food supply: Cut off from Middle Eastern energy by the Strait of Hormuz closure, Southeast Asian nations are shifting palm oil and local crops into diesel and gasoline blends. This rapid transition is squeezing regional supplies for cooking oil, animal feed and agricultural exports.
Key macro themes
- Geopolitical whiplash and energy uncertainty: Conflicting messaging between US officials over the US-Iran peace process continues to create volatility. While oil prices initially hit two-week lows on optimism surrounding negotiations, the lack of a finalized agreement means the Strait of Hormuz remains closed, perpetuating the global supply shock.
- Stagflationary pressures worsen: With consumer sentiment at record lows and one-year inflation expectations rising to 4.8%, according to the final May University of Michigan survey, the US economy is flashing classic stagflation warning signs. Rising gasoline prices are disproportionately impacting lower-income consumers and severely complicating the Fed’s policy options.
- Food versus fuel crisis in emerging markets: The prolonged energy shock is forcing structural shifts across emerging markets. Southeast Asia’s increasing use of crops for fuel production highlights how the geopolitical oil crisis is spilling over into global agricultural and food supply chains, compounding inflation risks.
Global market impact (last 48 hours)
Equities: The S&P 500’s eight-week rally is showing signs of potential buyer exhaustion according to several technical indicators. Even if a US-Iran peace deal is finalized, markets may still face a “sell the news” reaction as June approaches, a month historically associated with softer equity performance.
Fixed Income: Incoming Fed Chair Kevin Warsh faces a difficult bond market backdrop. With US long-term five-year inflation expectations surging to 3.9%, the highest level since October 2025 according to May’s University of Michigan survey data, Treasury yields remain highly sensitive to any further energy-driven inflation shocks.
FX: The US dollar weakened over the weekend, offering a modest reprieve to emerging market currencies while making dollar-priced commodities such as gold and silver more affordable for international buyers.
Commodities: Oil prices initially hit two-week lows on optimism surrounding peace negotiations, but markets remain highly reactive to Trump’s subsequent “do not rush” remarks. Spot gold rose 1.2% to $4,564/oz, while spot silver surged 3.1% to $77.85/oz.
Asia Pacific impact
- Stock markets and regional security: Major Asia Pacific equity markets started the week on a bullish footing, tracking gains in US futures. The Nikkei 225 surged 3.1% to a fresh intraday all-time high of 65,330, while China A50 (+0.7%), ASX 200 (+0.6%) and STI (+0.6%) also advanced. Regional security developments will remain in focus this week with the Quad foreign ministers meeting in New Delhi on Tuesday, followed by the Shangri-La Dialogue in Singapore on Friday.
- Commodities and food security: Indonesia and Malaysia’s rapid shift toward higher biodiesel blends to offset lost Middle Eastern oil supply is tightening cooking oil availability. The diversion is expected to push food inflation higher and disrupt regional export balances.
- Diplomatic realignment: Philippine President Ferdinand Marcos Jr. is set to visit Japan to strengthen bilateral ties, reflecting broader regional efforts to secure energy cooperation and maritime security amid ongoing global instability.
Top 2 events to watch today
- US-Iran peace deal news flows – Impact: All asset classes
- Singapore Core Inflation (Apr) – 1:00 SGT (consensus: 1.7% y/y, Mar: 1.7%)
Impact: USD/SGD, SGD crosses, STI
Chart of the day – WTI crude bearish break below 50-day moving average
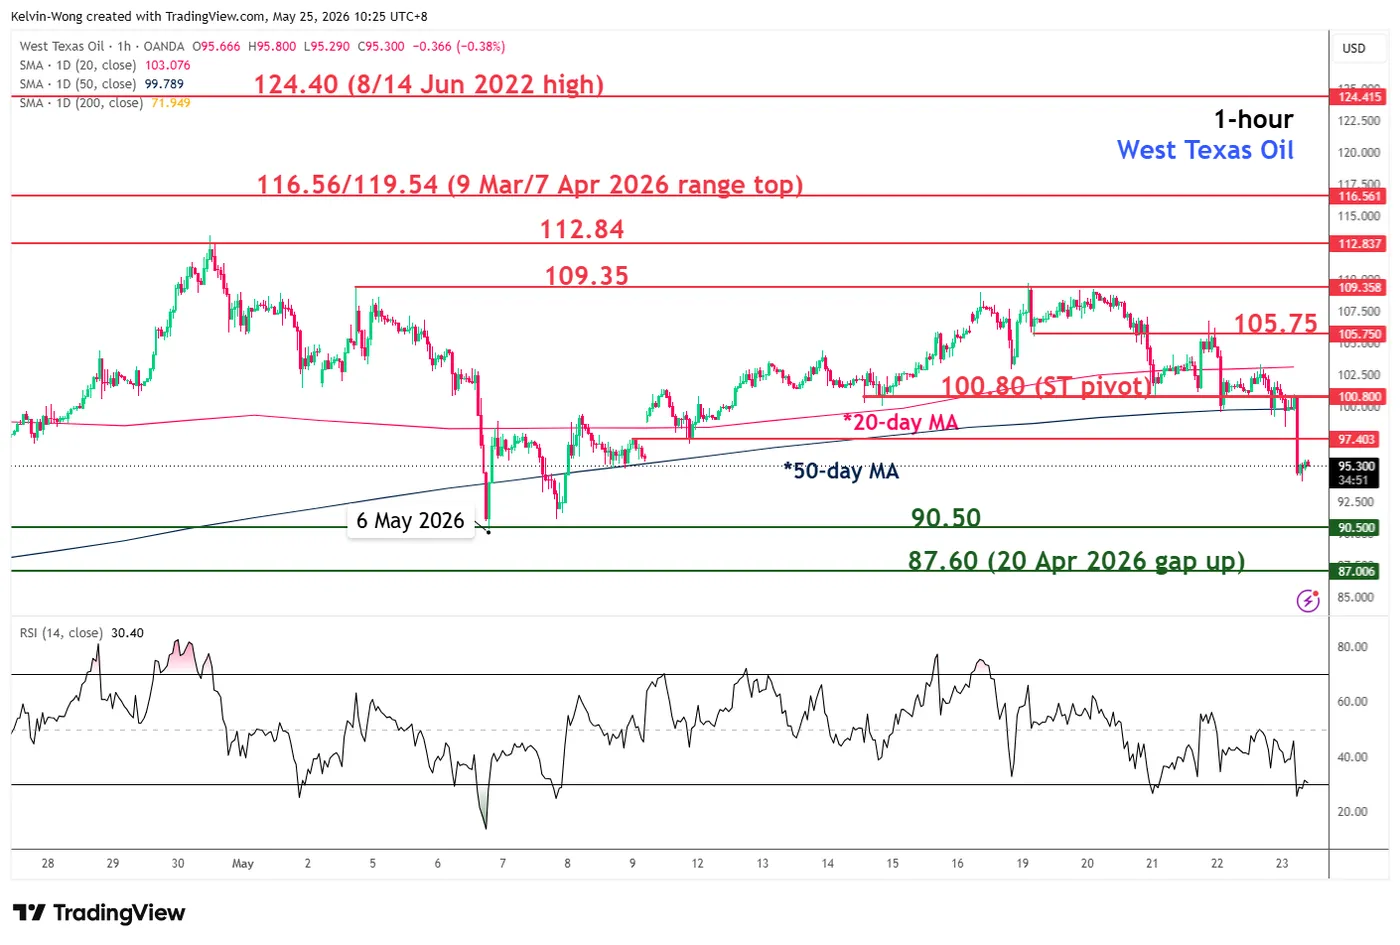
Fig. 1: West Texas oil CFD minor trend as of 25 May 2026 (Source: TradingView).
The price action of the West Texas oil CFD, a proxy for WTI crude oil futures, staged an intraday bearish breakdown below its 50-day moving average during Monday’s Asian opening session. This marks the first confirmed breakdown after price action previously tested the 50-day moving average on 6 May and 17 April 2026.
Hourly RSI momentum remains in bearish territory, with oversold conditions visible but no bullish divergence signal emerging yet.
Watch the $100.80 short-term pivotal resistance, which is also close to the 50-day moving average. Failure below this level could expose the next intermediate supports at $90.50 and $87.60.
On the other hand, a clearance with an hourly close above $100.80 would negate the bearish scenario and open the door for a squeeze higher toward the next intermediate resistances at $105.75 and $109.35.
EUR/USD Recovery Builds Slowly As Traders Eye Breakout Potential
Key Highlights
- EUR/USD dipped further before the bulls appeared near 1.1575.
- It traded above a bearish trend line with resistance at 1.1610 on the 4-hour chart.
- GBP/USD climbed higher above the 1.3450 resistance zone.
- Gold started a consolidation phase above the $4,450 support.
EUR/USD Technical Analysis
The Euro remained in a bearish zone below 1.1720 against the US Dollar. EUR/USD even dipped below 1.1620 before the bulls appeared.
Looking at the 4-hour chart, the pair traded as low as 1.1576 and recently started a recovery wave. The pair climbed above the 23.6% Fib retracement level of the downward move from the 1.1787 swing high to the 1.1576 low.
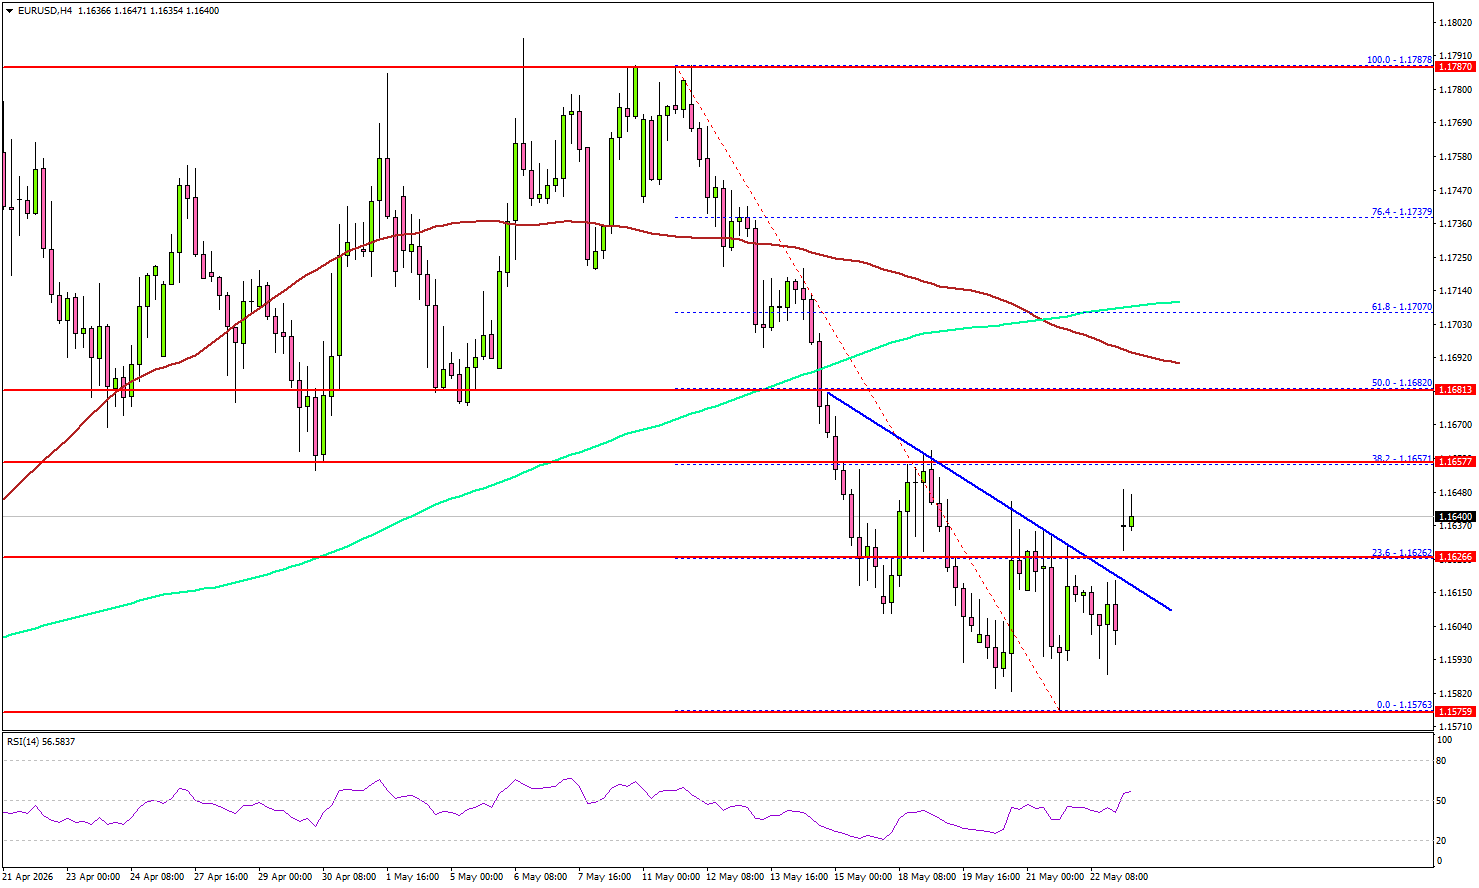
Besides, the pair traded above a bearish trend line with resistance at 1.1610. On the upside, the pair faces resistance at 1.1655. The first major resistance could be 1.1685, the 100 simple moving average (red, 4-hour), the 200 simple moving average (green, 4-hour), and the 61.8% Fib retracement level of the downward move from the 1.1787 swing high to the 1.1576 low.
A close above 1.1700 could open doors for gains above 1.1720. In the stated case, the bulls could aim for a move to 1.1800. If there is another decline, the pair could find bids near 1.1600.
The first major support sits near the 1.1575 level. The next support could be 1.1550. A close below 1.1550 might initiate a drop to 1.1500. Any more losses might open the doors for a drop toward the 1.1465 zone.
Looking at GBP/USD, the pair started a decent increase and was able to clear the 1.3450 resistance zone.
Upcoming Key Economic Events:
- ECB's Sleijpen speech.
Hawkish RBNZ, Fragile Aussie: Why AUD/NZD Could Break Hard This Week
Outside developments surrounding the US-Iran negotiations, this week’s largest FX event risks may come from Oceania, where traders face a potentially divergence between the policy outlooks of the Reserve Bank of New Zealand and Reserve Bank of Australia. While the RBNZ is widely expected to leave the Official Cash Rate unchanged at 2.25% on Tuesday, markets increasingly see risks that the central bank delivers a more hawkish message than currently priced. By contrast, Wednesday’s Australian CPI report could expose downside risks for the Aussie if inflation fails to justify further RBA tightening expectations. The risks are asymmetric.
For New Zealand, the danger for markets is not that the RBNZ hikes this week. Almost nobody expects that. The real danger is that the central bank sounds far more worried about inflation than traders currently assume. Elevated oil prices and imported inflation risks are beginning to unsettle economists, policymakers, and markets alike. The latest NZIER Shadow Board already exposed those cracks, with three members openly calling for an immediate hike because “the real interest rate has remained low for a prolonged period.”
If Governor Anna Breman or the new economic projections deliver a higher OCR track, signals rates could rise toward 3.00%-3.25% by early 2027, or reveals a meaningful internal split pushing for hikes, NZD could reprice aggressively.
That possibility matters because markets are nowhere near consensus on where New Zealand rates are ultimately heading. Some banks still expect only one additional hike over the next year, while others see a full 100bps tightening cycle. Westpac is even more aggressive. That leaves NZD exposed to a violent adjustment if the RBNZ confirms that inflation fears tied to the energy shock are becoming more persistent rather than temporary.
Australia, meanwhile, looks far less comfortable. The Aussie spent weeks building a sizeable hawkish premium as traders embraced the idea that the Reserve Bank of Australia might eventually push rates toward 4.70% by late 2026. But April jobs data changed the mood. Cracks are beginning to appear in the labor market, and suddenly the RBA no longer looks eager to keep on tightening unless inflation genuinely explodes higher again.
Wednesday’s CPI report therefore carries a very different risk profile for AUD. Headline inflation is expected to rise from 4.6% to 4.8%, while trimmed mean CPI is seen edging from 3.3% to 3.4%. But the market’s problem is that expectations are already elevated. The RBA now faces a much higher hurdle for another hike because policymakers do not want to tighten into a slowing economy unless they absolutely must. If core inflation undershoots even modestly, the hawkish premium supporting AUD could evaporate very quickly.
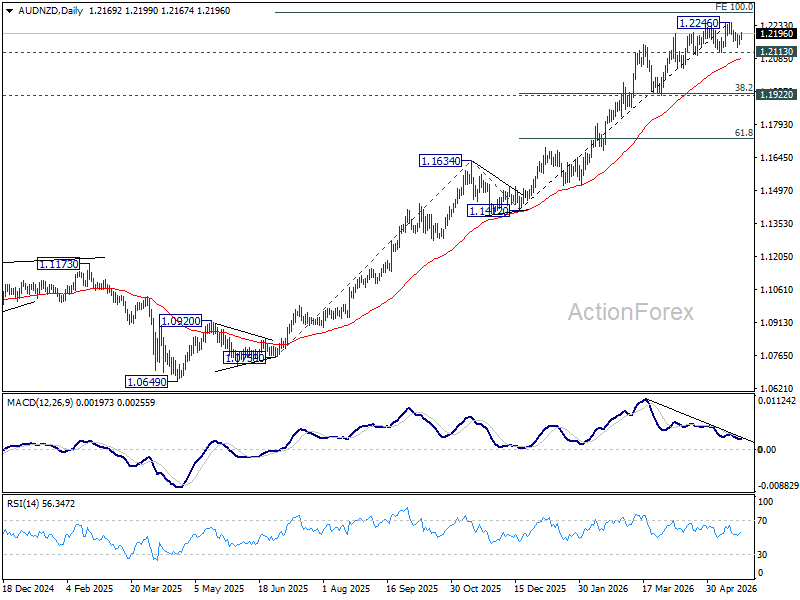
That is why AUD/NZD suddenly looks dangerous. Near 1.2200, the cross has already started flashing technical warning signs, with bearish divergence developing on D MACD as upside momentum fades.
Resistance near 100% projection of 1.0759 to 1.1634 from 1.1412 at 1.2287 could become a major ceiling if the RBNZ surprises hawkishly while Australian inflation disappoints.
Decisive break below 1.2113 support would strongly suggest that a medium-term top is already in place, opening a much deeper slide toward 1.1922 cluster support (38.2% retracement of 1.1412 to 1.2246 at 1.1927).
RBNZ Shadow Board Backs Hold at 2.25%, Three Call for Immediate Hike
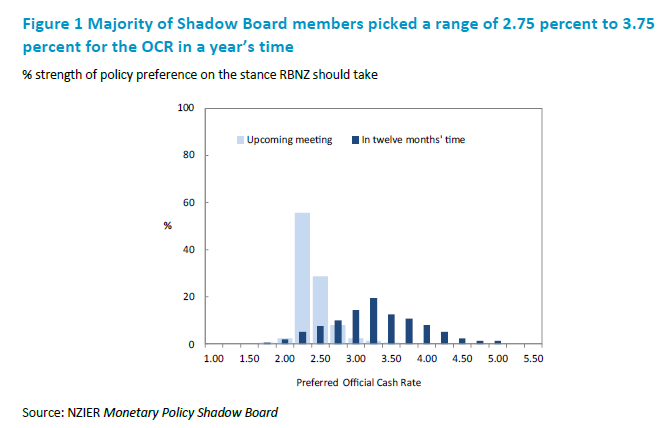
A split emerged within the NZIER Monetary Shadow Board ahead of this week’s Reserve Bank of New Zealand policy decision. While the majority recommended keeping the Official Cash Rate unchanged at 2.25%, several members argued that tightening should begin immediately as inflation pressures build.
The majority view centered on weak domestic conditions and geopolitical uncertainty. Members pointed to “subdued growth and spare capacity” in the New Zealand economy, alongside uncertainty surrounding the US-Israel-Iran conflict, as reasons to leave policy unchanged for now. However, three members favored a rate increase, warning that “the real interest rate has remained low for a prolonged period,” which they believe is “adding to inflation pressures.”
Despite the near-term split, the board broadly agreed that rates will need to move higher over the coming year, with most expecting the OCR to rise into a 2.75% to 3.75% range. The debate mirrors broader global central bank tensions, where policymakers are weighing whether to look through the latest fuel shock because growth is soft, or tighten sooner to prevent inflation expectations from becoming entrenched.
ECB’s Lagarde Signals Higher Inflation Forecasts, June Hike Bets Firm
ECB President Christine Lagarde opened the door wider to a June rate hike after signaling that the central bank’s inflation forecasts are likely to move higher again. Lagarde said the ECB’s March projection of 2.6% inflation for 2026 “will probably be revised,” noting that “the situation has evolved” since those estimates were published.
Although Lagarde avoided directly committing to tighter policy, she stressed that policymakers must “look at all the data available” and evaluate “whether action is needed.” She also reiterated that the ECB’s objective is “2% medium term,” reinforcing that inflation credibility remains central to policy discussions.
The comments are likely to strengthen market conviction that the ECB will raise rates by 25bps next month. Several policymakers have already hinted that prolonged energy-driven inflation risks could force the Governing Council to act sooner rather than later.
Iran Talks Drive Market Focus as USD/JPY Tests Higher
The week remained focused on the Iran situation, as negotiations reached an important stage. Some progress was reported, but major issues remained, especially around Iran’s uranium enrichment program and how quickly sanctions could be eased.
USD/JPY pushed higher as the Bank of Japan stayed on the sidelines and markets continued to focus on the gap between US and Japanese interest rates. US economic data was weaker than expected, with the University of Michigan consumer sentiment report falling to 44.8 from 48.2. Fed Governor Christopher Waller also pushed back against hopes for early rate cuts, supporting the view that US rates may stay high for longer.
WTI oil fell back toward $100 as hopes for a settlement reduced some of the immediate supply fears. Even with geopolitical risks, US stock markets finished the week higher. The Dow reached a new record high, and the S&P 500 rose for the eighth straight week, helped by continued interest in AI stocks.
Markets This Week
US Stocks
The Dow reached new record highs as worries about inflation and higher interest rates were outweighed by optimism about future company earnings. The uptrend remains strong, and with the potential for progress toward ending the conflict with Iran in the coming week, focusing on buying opportunities looks to be the best strategy.
Resistance levels are at 51,000, 51,500 and 52,000. Support is seen at 50,000, 49,500, 49,000, 48,500 and 48,000.
Japanese Stocks
The Nikkei 225 returned to record highs as lower oil prices and a strong outlook for AI-related companies supported positive market sentiment. The recovery is encouraging, but the short-term trend is still moving sideways, so looking for range-trading opportunities may be the preferred strategy this week.
Resistance is seen at 64,000, 65,000, 66,000, 67,000 and 68,000, while support is at 61,000, 60,000, 59,000, 58,500 and 57,000.
USD/JPY
USD/JPY continued to test higher as short-term traders who expected more yen-buying action from the Bank of Japan were caught holding short positions. Comments from the new Fed Chair also supported USD/JPY, as he suggested that interest rate cuts may take longer than expected due to high inflation.
For medium-term traders, selling opportunities ahead of 160 may be the preferred strategy, as intervention risk remains high near that level. For short-term traders, focusing on the current small range or waiting for higher volatility may be the better approach.
Resistance is at 160.00, 160.50, 162.00 and 165.00, while support is seen at 158.00, 157.00, 156.00, 155.50 and 155.00.
Gold
Gold continued to test lower last week as a stronger US dollar and expectations for higher long-term interest rates reduced demand for the metal. The market remains relatively quiet overall, and it was surprising that there was not more selling pressure after prices moved below last month’s lows.
A quick end to the conflict with Iran could bring some buying interest back into gold, but for now, looking for further downside seems most likely to be the best strategy.
Resistance is at $4,550, $4,600, $4,665, $4,750 and $4,900, while support is at $4,500, $4,450 and $4,350.
Crude Oil
WTI crude oil tested higher at the start of the week, but later fell back toward $100 after Trump indicated that talks with Iran were productive and close to a possible conclusion.
The negotiations remain difficult to forecast, but Trump has a strong motivation to end the conflict quickly to help support the US economy. At the moment, headlines about Iran are driving oil prices, and there appears to be more risk to the downside if progress toward a settlement continues.
Resistance is at $105, $110 and $120, while support is at $95, $90, $80, $75, $70 and $67.50.
Bitcoin
Bitcoin fell last week as selling in ETFs and rising long-term interest rates around the world reduced demand for risk assets. Higher yields are becoming more attractive for some investors, which put pressure on Bitcoin.
However, support at $75,000 held, so range-trading opportunities may remain the best strategy as long as this level continues to hold.
Resistance is at $80,000, $85,000 and $90,000, while support is at $75,000, $65,000, $60,000 and $55,000.
This Week’s Focus
- Monday: UK and US holiday
- Tuesday: Japan BoJ Core CPI, US CB Consumer Confidence
- Wednesday: Australia CPI
- Thursday: US Building Permits, Core PCE Price Index, GDP, Durable Goods Orders and New Home Sales
- Friday: Japan Tokyo Core CPI and Industrial Production, EU German Unemployment Rate, US Chicago PMI
USD/JPY will still be important this week, as traders remain cautious about possible Bank of Japan intervention if yen weakness continues. The week may start quietly because of holidays in the UK and US, with no major economic announcements until Thursday.
Markets are likely to focus mainly on headlines from the Iran-US negotiations.
GBPJPY Wave Analysis
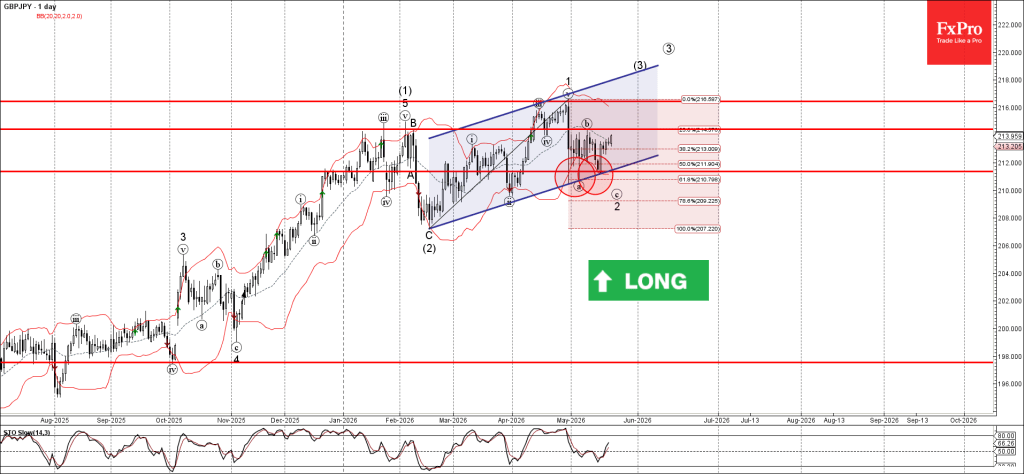
GBPJPY: ⬆️ Buy
- GBPJPY reversed from support zone
- Likely to rise to resistance level 214.40
GBPJPY currency pair recently reversed up from the support zone between the support level 211.00 (which has been reversing the price from the start of May), lower daily Bollinger Band and the support trendline of the daily up channel from February.
The upward reversal from this support zone stopped the previous minor ABC correction 2 from the end of April.
Given the strong daily uptrend and the continuation of the bearish yen sentiment seen across the FX markets today, GBPJPY currency pair can be expected to rise to the next resistance level 214.4 (top of the pervious wave b).
Dow Jones Wave Analysis
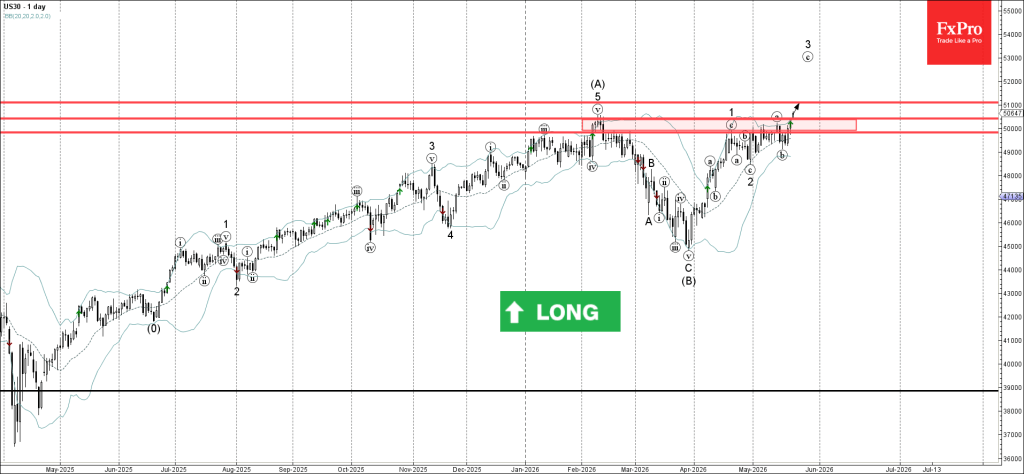
Dow Jones: ⬆️ Buy
- Dow Jones broke resistance zone
- Likely to rise to resistance level 51000.00
Dow Jones index continues to rise after the earlier breakout of the resistance zone between the resistance levels 50000.00 and 50400.00 (which stopped wave A at the stat of April).
The breakout of this resistance zone should accelerate the active impulse wave 3 – which belongs to the intermediate impulse wave (C) from March.
Given the overriding daily uptrend, Dow Jones index can be expected to rise to the next resistance level 51000.00.
Eco Data 5/25/26
| GMT | Ccy | Events | Act | Cons | Prev | Rev |
|---|---|---|---|---|---|---|
| 12:30 | CAD | Corporate Profits Q/Q Q1 | -2.00% | -1.60% |
| 12:30 | CAD |
| Corporate Profits Q/Q Q1 | |
| Actual | -2.00% |
| Consensus | |
| Previous | -1.60% |