

Sample Category Title
BoC Set to Hold as Inflation and Growth Concerns Fade
The Bank of Canada is widely expected to hold the overnight rate at 2.25% at Wednesday’s policy announcement—marking a sixth consecutive pause after 50 basis points of cuts over September and October last year.
The BoC highlighted two-sided risks to the interest rate in their prior policy meetings – risks of cuts tied to potential downside growth surprises and hike risks due to concerns that higher energy prices from conflict in the Middle East could lead to “generalized inflation.”
But both concerns have broadly eased over the last month to help solidify expectations for the central bank to remain in a wait and see mode for now.
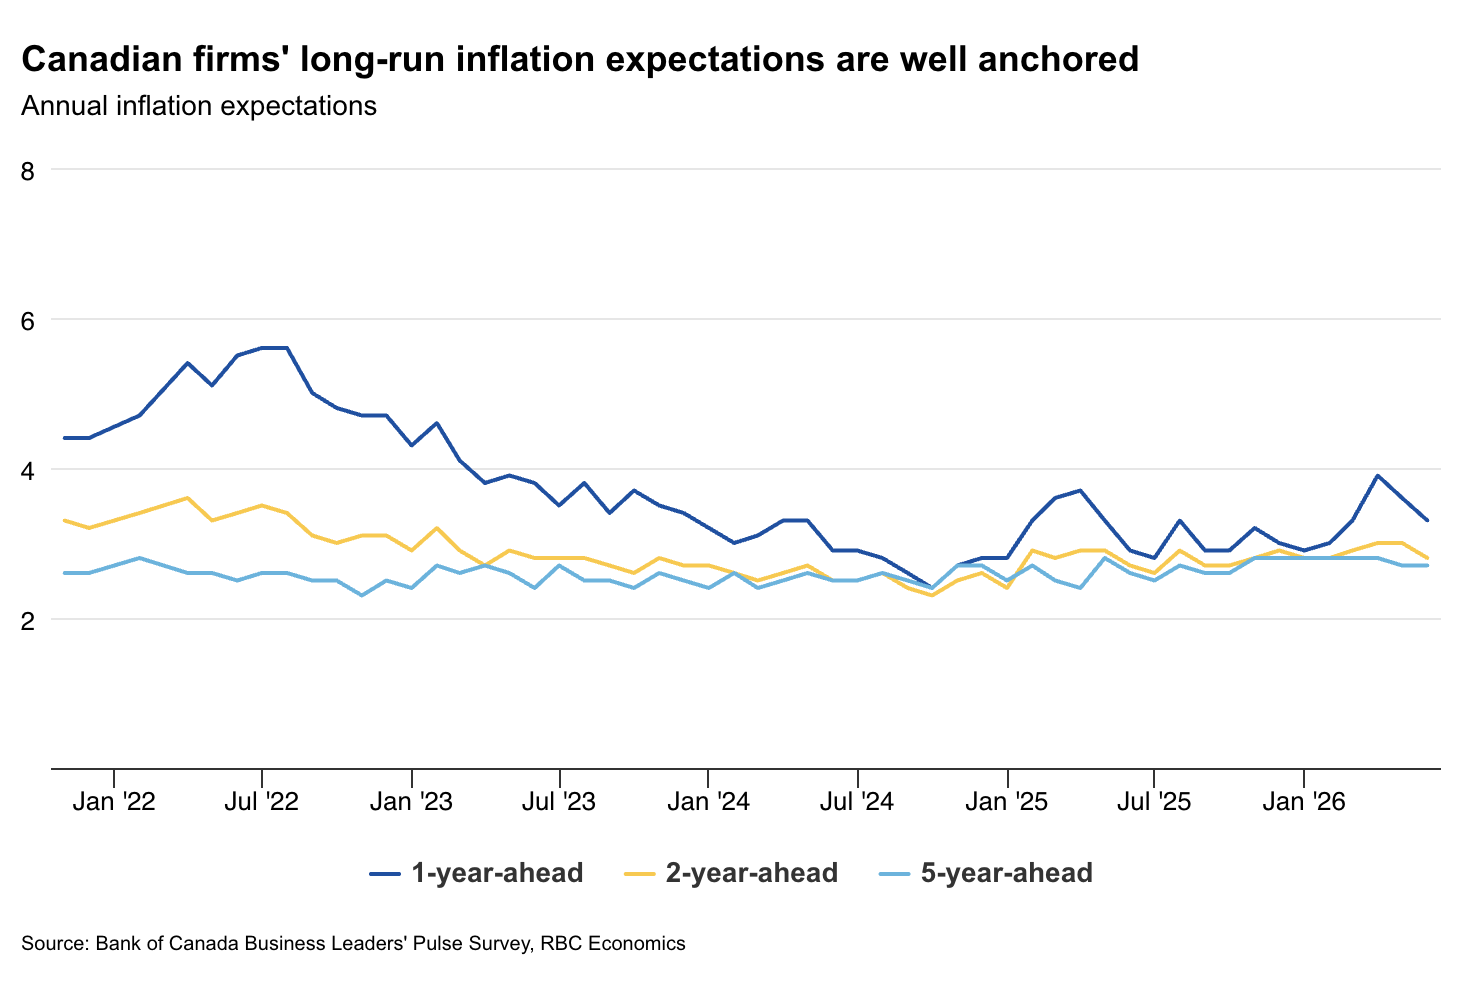
The spike in oil prices has yet to show significant signs of turning into a broader longer-lasting inflation shock. Higher gasoline prices have raised costs for households, but price increases haven’t generally spread across the consumer spending basket. The BoC’s Business Outlook Survey showed businesses’ longer-run inflation expectations still well-anchored in May when oil prices were at recent peaks. And oil prices have since moved lower despite still significantly restricted traffic through the Strait of Hormuz.
At the same time, Canada’s growth and labour market data have looked better after a downside surprise in Q1 gross domestic product growth.
Critically, CUSMA continues to protect the bulk of Canadian exports from U.S. tariffs despite the U.S. administration opting not to (yet) extend the 2036 expiry date of the deal, and broader U.S. tariff rates have been edging lower.
Monthly GDP data so far is pointing to stronger growth in Q2. Labour markets showed more signs of steadying in May and June after job losses earlier in the year. Our tracking of consumer spending has remained resilient. And housing markets have firmed in cities like Toronto and Vancouver that significantly underperformed previously.
We’re also looking ahead to May’s manufacturing and wholesales’ reports on Wednesday. Both should look softer than in April, particularly controlling for higher energy prices, but not enough to retrace larger gains in the prior months. Statistics Canada’s advance estimate is for a 0.1% increase in real GDP in May after a 0.5% April increase, leaving growth in Q2 tracking in line with an about 2% annualized rebound.
Overall, we continue to expect the combination of a soft but gradually improving Canadian per-person growth backdrop will leave the BoC on hold through 2026.
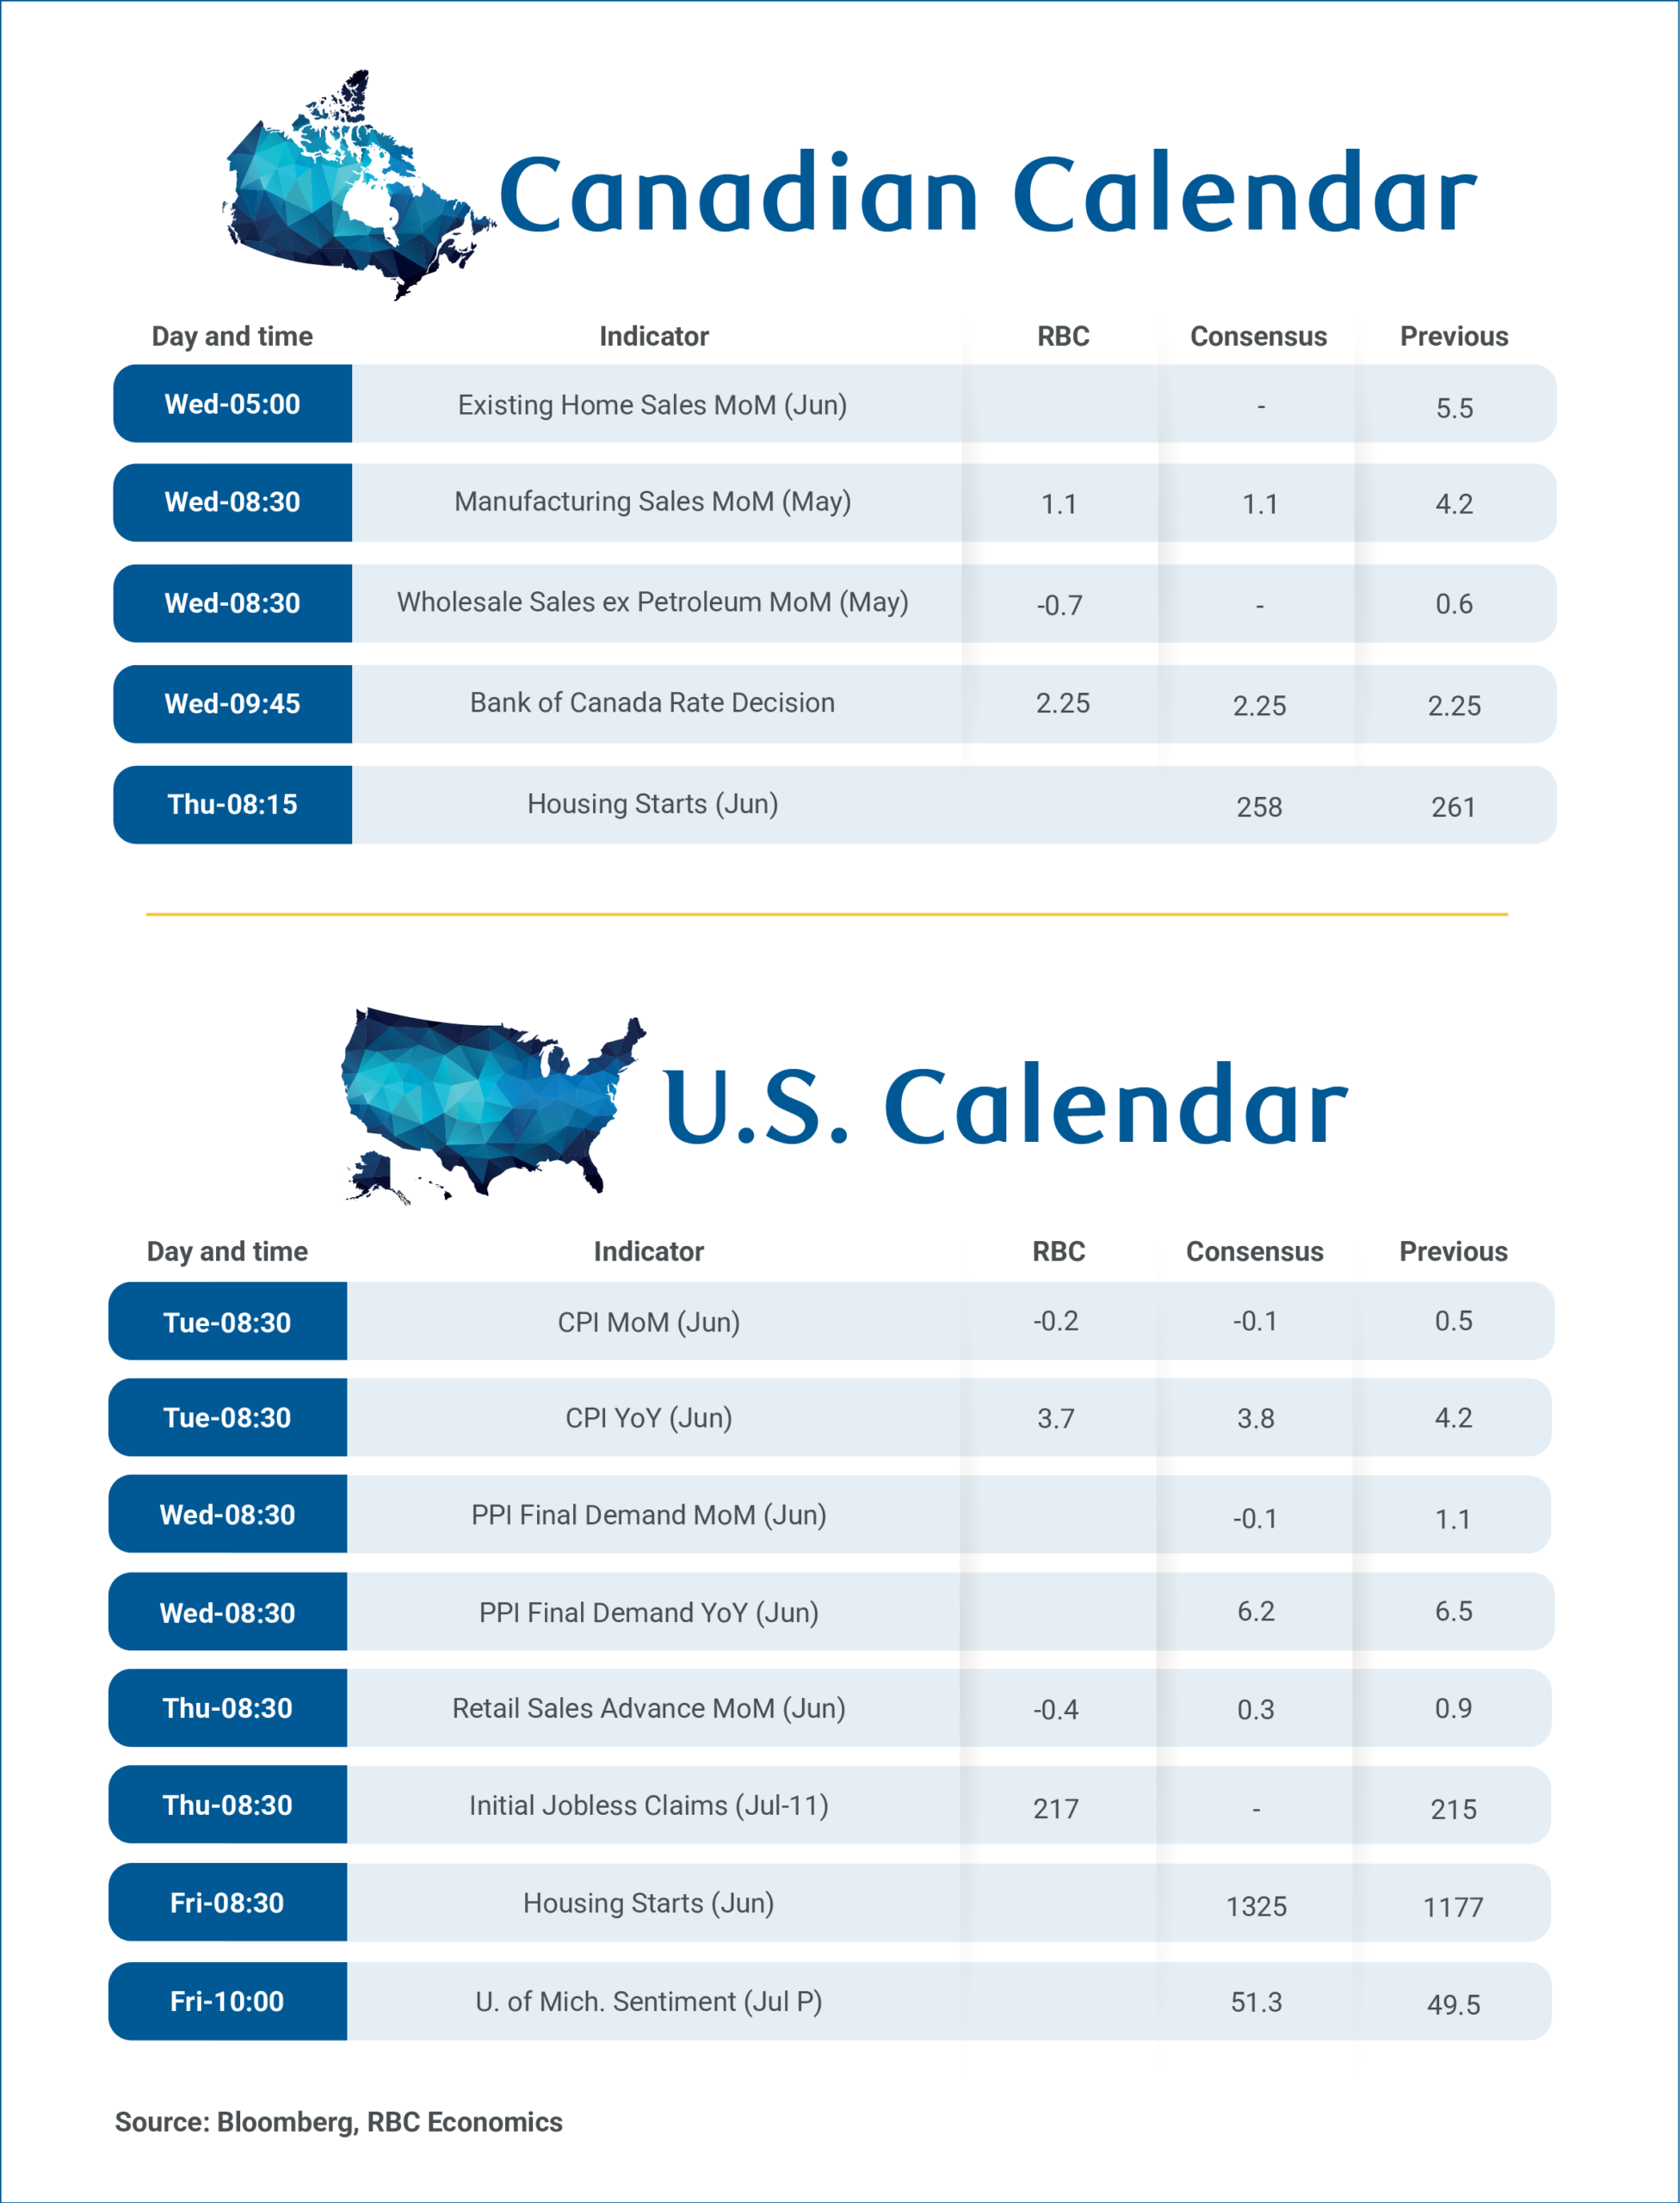
U.S. CPI growth likely remained elevated but slowed in June with gasoline prices falling ~10% (on a seasonally adjusted) basis from May. We look for headline CPI growth to edged down to 3.7% after rising above 4% for the first time in three years in May. Excluding food & energy products, we expect core inflation to remain elevated at 2.8% on a 0.2% month-over-month increase.
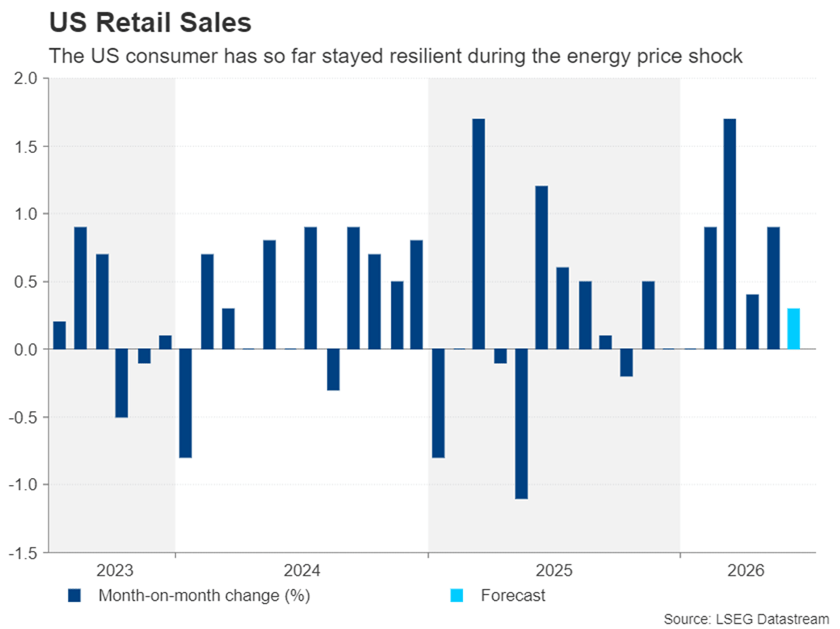
We expect U.S. retail sales edged down 0.4% in June driven by a sharp pullback in oil prices lowering spending at gasoline stations. Accounting for price changes, spending should still look firm, supported by a 2.8% increase in unit vehicle sales and an assumed 0.4% increase in control (excluding gasoline stations, motor vehicle sales, and building material stores).
Summary 7/13 – 7/17
Monday, Jul 13, 2026
| GMT | Ccy | Events | Cons | Prev |
|---|---|---|---|---|
| 22:30 | NZD | BusinessNZ PSI Jun | 47.5 |
| 22:30 | NZD |
| BusinessNZ PSI Jun | |
| Consensus | |
| Previous | 47.5 |
Tuesday, Jul 14, 2026
| GMT | Ccy | Events | Cons | Prev |
|---|---|---|---|---|
| 22:00 | NZD | NZIER Business Confidence Q2 | -4 | |
| 23:01 | GBP | BRC Like-For-Like Retail Sales Y/Y Jun | 3.40% | |
| 00:30 | AUD | Westpac Consumer Confidence Jul | -2.90% | |
| 01:30 | AUD | NAB Business Confidence Jun | -14 | |
| 01:30 | AUD | NAB Business Conditions Jun | 3 | |
| 03:00 | CNY | Trade Balance (USD) Jun | 119.5B | 105.4B |
| 04:30 | JPY | Industrial Production M/M May F | 0.50% | 0.50% |
| 06:30 | CHF | Producer and Import Prices M/M Jun | -0.50% | -0.40% |
| 06:30 | CHF | Producer and Import Prices Y/Y Jun | -1.80% | |
| 10:00 | USD | NFIB Business Optimism Index Jun | 95.6 | 95.3 |
| 12:30 | USD | CPI M/M Jun | -0.10% | 0.50% |
| 12:30 | USD | CPI Y/Y Jun | 3.80% | 4.20% |
| 12:30 | USD | CPI Core M/M Jun | 0.20% | 0.20% |
| 12:30 | USD | CPI Core Y/Y Jun | 2.80% | 2.90% |
| 22:00 | NZD |
| NZIER Business Confidence Q2 | |
| Consensus | |
| Previous | -4 |
| 23:01 | GBP |
| BRC Like-For-Like Retail Sales Y/Y Jun | |
| Consensus | |
| Previous | 3.40% |
| 00:30 | AUD |
| Westpac Consumer Confidence Jul | |
| Consensus | |
| Previous | -2.90% |
| 01:30 | AUD |
| NAB Business Confidence Jun | |
| Consensus | |
| Previous | -14 |
| 01:30 | AUD |
| NAB Business Conditions Jun | |
| Consensus | |
| Previous | 3 |
| 03:00 | CNY |
| Trade Balance (USD) Jun | |
| Consensus | 119.5B |
| Previous | 105.4B |
| 04:30 | JPY |
| Industrial Production M/M May F | |
| Consensus | 0.50% |
| Previous | 0.50% |
| 06:30 | CHF |
| Producer and Import Prices M/M Jun | |
| Consensus | -0.50% |
| Previous | -0.40% |
| 06:30 | CHF |
| Producer and Import Prices Y/Y Jun | |
| Consensus | |
| Previous | -1.80% |
| 10:00 | USD |
| NFIB Business Optimism Index Jun | |
| Consensus | 95.6 |
| Previous | 95.3 |
| 12:30 | USD |
| CPI M/M Jun | |
| Consensus | -0.10% |
| Previous | 0.50% |
| 12:30 | USD |
| CPI Y/Y Jun | |
| Consensus | 3.80% |
| Previous | 4.20% |
| 12:30 | USD |
| CPI Core M/M Jun | |
| Consensus | 0.20% |
| Previous | 0.20% |
| 12:30 | USD |
| CPI Core Y/Y Jun | |
| Consensus | 2.80% |
| Previous | 2.90% |
Wednesday, Jul 15, 2026
| GMT | Ccy | Events | Cons | Prev |
|---|---|---|---|---|
| 23:50 | JPY | Machinery Orders M/M May | -4.20% | 8.70% |
| 02:00 | CNY | Industrial Production Y/Y Jun | 4.70% | 4.50% |
| 02:00 | CNY | Retail Sales Y/Y Jun | -0.10% | -0.60% |
| 02:00 | CNY | Fixed Asset Investment YTD Y/Y Jun | -4.90% | -4.10% |
| 02:00 | CNY | GDP Q/Q Q2 | 0.90% | 1.30% |
| 02:00 | CNY | GDP Y/Y Q2 | 4.50% | 5.00% |
| 04:30 | JPY | Tertiary Industry Index M/M May | 0.40% | 1.30% |
| 09:00 | EUR | Eurozone Industrial Production M/M May | 0.30% | 0.10% |
| 12:30 | CAD | Manufacturing Sales M/M May | 1.10% | 4.20% |
| 12:30 | CAD | Wholesale Sales M/M May | -0.70% | 0.60% |
| 12:30 | USD | Empire State Manufacturing Jul | 9.3 | 5.7 |
| 12:30 | USD | PPI M/M Jun | 0.20% | 1.10% |
| 12:30 | USD | PPI Y/Y Jun | 6.20% | 6.50% |
| 13:45 | CAD | BoC Interest Rate Decision | 2.25% | 2.25% |
| 14:30 | CAD | BoC Press Conference | ||
| 14:30 | USD | Crude Oil Inventories (Jul 10) | -1.8M | 3.0M |
| 18:00 | USD | Fed's Beige Book |
| 23:50 | JPY |
| Machinery Orders M/M May | |
| Consensus | -4.20% |
| Previous | 8.70% |
| 02:00 | CNY |
| Industrial Production Y/Y Jun | |
| Consensus | 4.70% |
| Previous | 4.50% |
| 02:00 | CNY |
| Retail Sales Y/Y Jun | |
| Consensus | -0.10% |
| Previous | -0.60% |
| 02:00 | CNY |
| Fixed Asset Investment YTD Y/Y Jun | |
| Consensus | -4.90% |
| Previous | -4.10% |
| 02:00 | CNY |
| GDP Q/Q Q2 | |
| Consensus | 0.90% |
| Previous | 1.30% |
| 02:00 | CNY |
| GDP Y/Y Q2 | |
| Consensus | 4.50% |
| Previous | 5.00% |
| 04:30 | JPY |
| Tertiary Industry Index M/M May | |
| Consensus | 0.40% |
| Previous | 1.30% |
| 09:00 | EUR |
| Eurozone Industrial Production M/M May | |
| Consensus | 0.30% |
| Previous | 0.10% |
| 12:30 | CAD |
| Manufacturing Sales M/M May | |
| Consensus | 1.10% |
| Previous | 4.20% |
| 12:30 | CAD |
| Wholesale Sales M/M May | |
| Consensus | -0.70% |
| Previous | 0.60% |
| 12:30 | USD |
| Empire State Manufacturing Jul | |
| Consensus | 9.3 |
| Previous | 5.7 |
| 12:30 | USD |
| PPI M/M Jun | |
| Consensus | 0.20% |
| Previous | 1.10% |
| 12:30 | USD |
| PPI Y/Y Jun | |
| Consensus | 6.20% |
| Previous | 6.50% |
| 13:45 | CAD |
| BoC Interest Rate Decision | |
| Consensus | 2.25% |
| Previous | 2.25% |
| 14:30 | CAD |
| BoC Press Conference | |
| Consensus | |
| Previous | |
| 14:30 | USD |
| Crude Oil Inventories (Jul 10) | |
| Consensus | -1.8M |
| Previous | 3.0M |
| 18:00 | USD |
| Fed's Beige Book | |
| Consensus | |
| Previous | |
Thursday, Jul 16, 2026
| GMT | Ccy | Events | Cons | Prev |
|---|---|---|---|---|
| 01:00 | AUD | Consumer Inflation Expectations Jul | 5.50% | |
| 06:00 | GBP | GDP M/M May | 0.00% | -0.10% |
| 06:00 | GBP | Goods Trade Balance (GBP) May | -23.1B | -26.0B |
| 09:00 | EUR | Eurozone Trade Balance (EUR) May | 2.8B | -1.3B |
| 12:15 | CAD | Housing Starts Y/Y Jun | 256K | 261K |
| 12:30 | USD | Initial Jobless Claims (Jul 10) | 218K | 215K |
| 12:30 | USD | Philadelphia Fed Manufacturing Survey Jul | 12.7 | 10.3 |
| 12:30 | USD | Retail Sales M/M Jun | 0.20% | 0.90% |
| 12:30 | USD | Retail Sales ex Autos M/M Jun | 0.00% | 0.80% |
| 14:00 | USD | Business Inventories May | 0.30% | 0.50% |
| 14:00 | USD | NAHB Housing Market Index Jul | 35 | 35 |
| 14:30 | USD | Natural Gas Storage (Jul 10) | 45B | 61B |
| 01:00 | AUD |
| Consumer Inflation Expectations Jul | |
| Consensus | |
| Previous | 5.50% |
| 06:00 | GBP |
| GDP M/M May | |
| Consensus | 0.00% |
| Previous | -0.10% |
| 06:00 | GBP |
| Goods Trade Balance (GBP) May | |
| Consensus | -23.1B |
| Previous | -26.0B |
| 09:00 | EUR |
| Eurozone Trade Balance (EUR) May | |
| Consensus | 2.8B |
| Previous | -1.3B |
| 12:15 | CAD |
| Housing Starts Y/Y Jun | |
| Consensus | 256K |
| Previous | 261K |
| 12:30 | USD |
| Initial Jobless Claims (Jul 10) | |
| Consensus | 218K |
| Previous | 215K |
| 12:30 | USD |
| Philadelphia Fed Manufacturing Survey Jul | |
| Consensus | 12.7 |
| Previous | 10.3 |
| 12:30 | USD |
| Retail Sales M/M Jun | |
| Consensus | 0.20% |
| Previous | 0.90% |
| 12:30 | USD |
| Retail Sales ex Autos M/M Jun | |
| Consensus | 0.00% |
| Previous | 0.80% |
| 14:00 | USD |
| Business Inventories May | |
| Consensus | 0.30% |
| Previous | 0.50% |
| 14:00 | USD |
| NAHB Housing Market Index Jul | |
| Consensus | 35 |
| Previous | 35 |
| 14:30 | USD |
| Natural Gas Storage (Jul 10) | |
| Consensus | 45B |
| Previous | 61B |
Friday, Jul 17, 2026
| GMT | Ccy | Events | Cons | Prev |
|---|---|---|---|---|
| 08:00 | EUR | Eurozone Current Account (EUR) May | 18.1B | -15.7B |
| 09:00 | EUR | Eurozone CPI Y/Y Jun F | 2.80% | 2.80% |
| 09:00 | EUR | Eurozone Core CPI Y/Y Jun F | 2.40% | 2.40% |
| 12:30 | USD | Building Permits Jun | 1.420M | 1.410M |
| 12:30 | USD | Housing Starts Jun | 1.330M | 1.177M |
| 12:30 | USD | Import Price Index M/M Jun | -0.70% | 1.90% |
| 13:15 | USD | Industrial Production M/M Jun | 0.20% | 0.10% |
| 13:15 | USD | Capacity Utilization Jun | 76.20% | 76.20% |
| 14:00 | USD | UoM Consumer Sentiment Jul P | 51 | 49.5 |
| 14:00 | USD | UoM 1-Yr Inflation Expectations Jul P | 4.60% |
| 08:00 | EUR |
| Eurozone Current Account (EUR) May | |
| Consensus | 18.1B |
| Previous | -15.7B |
| 09:00 | EUR |
| Eurozone CPI Y/Y Jun F | |
| Consensus | 2.80% |
| Previous | 2.80% |
| 09:00 | EUR |
| Eurozone Core CPI Y/Y Jun F | |
| Consensus | 2.40% |
| Previous | 2.40% |
| 12:30 | USD |
| Building Permits Jun | |
| Consensus | 1.420M |
| Previous | 1.410M |
| 12:30 | USD |
| Housing Starts Jun | |
| Consensus | 1.330M |
| Previous | 1.177M |
| 12:30 | USD |
| Import Price Index M/M Jun | |
| Consensus | -0.70% |
| Previous | 1.90% |
| 13:15 | USD |
| Industrial Production M/M Jun | |
| Consensus | 0.20% |
| Previous | 0.10% |
| 13:15 | USD |
| Capacity Utilization Jun | |
| Consensus | 76.20% |
| Previous | 76.20% |
| 14:00 | USD |
| UoM Consumer Sentiment Jul P | |
| Consensus | 51 |
| Previous | 49.5 |
| 14:00 | USD |
| UoM 1-Yr Inflation Expectations Jul P | |
| Consensus | |
| Previous | 4.60% |
Week Ahead – US CPI and Warsh Testimony to Take Centre Stage, BoC Eyed Too
- US inflation report and Warsh testimony to headline the week.
- Dollar to dominate amid slew of other US data and Mideast tensions.
- Amid fresh Iran escalation, China GDP to shed light on Q2 impact.
- Bank of Canada not expected to follow RBNZ with rate hike.
- Wall Street braces for Q2 earnings season amid AI angst.
Warsh back in the spotlight
It's been more than a month since Kevin Warsh took over as head of the Federal Reserve but after one FOMC meeting and two public appearances later, investors are still trying to gauge where the new chair sits on the dove-hawk scale. The coming week will present another opportunity for investors to assess Warsh's views, as he is due to testify in his semi-annual hearing before House and Senate lawmakers on Tuesday and Wednesday, respectively.
Not that there's high hopes that Warsh will succumb to pressure and reveal anything he hasn't already on interest rates, but perhaps the grilling by Congress will at least extract more out of him about his plans on reforming the Fed.
Will CPI report boost Fed bets?
What could make Tuesday's testimony particularly interesting is that the latest CPI data is released 90 minutes prior to the start of the hearing, making it difficult for Warsh to bypass questions about the inflation picture in the United States.
With both headline CPI and PCE readings above 4.0%, it is fair to say that inflation is at serious risk of spiraling out of control. Underlying measures have been a little more tamed, but policymakers should be concerned, as the core PCE price index has been trending upwards over the past few months, reaching 3.4% in May.
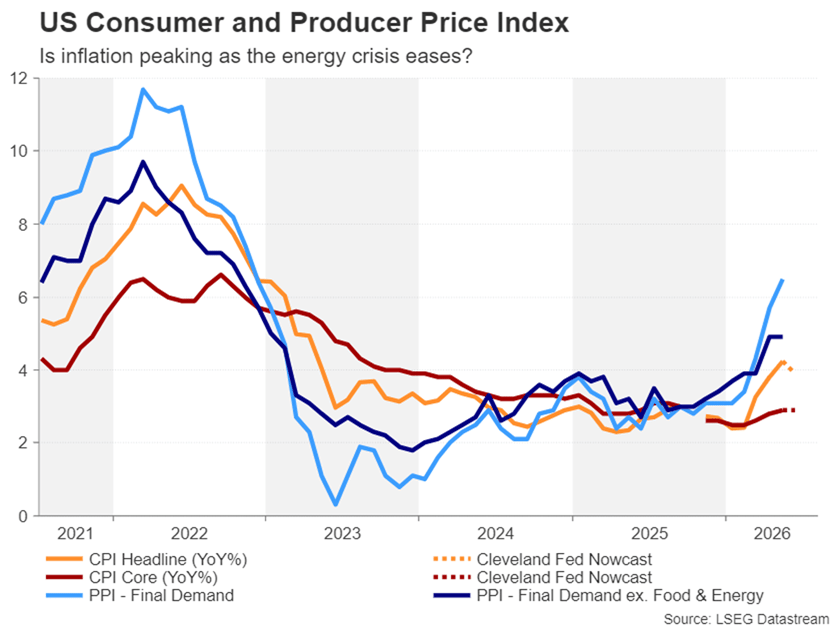
What's more significant about the current upswing is that the Fed hasn't met its 2% target with any of the inflation metrics since early 2021, hence Warsh's resetting of policy priorities. There may be some relief in the June data, as headline CPI is forecast to have eased to 3.9%, while core CPI is expected to have stayed unchanged at 2.9%.
Policymakers might feel they can afford to wait a little before pressing the hike button if inflation appears to be peaking, especially as the energy crisis has started to ease. But with the minutes of the June meeting acknowledging that price pressures are becoming more broad based and not just confined to energy, any upside surprises in the CPI data could revive bets for a July rate hike.
Plenty of drivers for the Dollar
For the US dollar, the biggest risk is a scenario where the CPI report is hot but Warsh repeats in Congress his recent comment that inflation risks "have come down". Alternatively, if Warsh does not rule out a rate hike in July if asked, the dollar is well positioned to resume its post-FOMC climb.
In the absence of clear direction from either the CPI numbers or Warsh's appearance on Capitol Hill, investors will divert their attention to the other releases out of the United States, of which there are plenty.
The producer price index for June comes out on Wednesday together with the Empire State manufacturing index. The Philly Fed's manufacturing gauge follows on Thursday, along with retail sales and pending home sales. More housing indicators are due on Friday and wrapping up the week are industrial production figures for June and the University of Michigan's preliminary consumer sentiment index for July.
Geopolitics and earnings to test market nerves
With Fed speculation potentially going into overdrive next week, the situation in the Middle East could add to the volatility. Following the flareup that prompted President Trump to declare that the ceasefire deal with Iran is over, a further escalation is highly possible as neither side seem to be in a very comprising mood.
The important thing for the markets, though, is whether the Strait of Hormuz will remain open, at least partially, or if another blockade is on the cards. The latter would boost both the safe-haven dollar and oil prices, pushing up policy tightening expectations for the Fed and other major central banks.
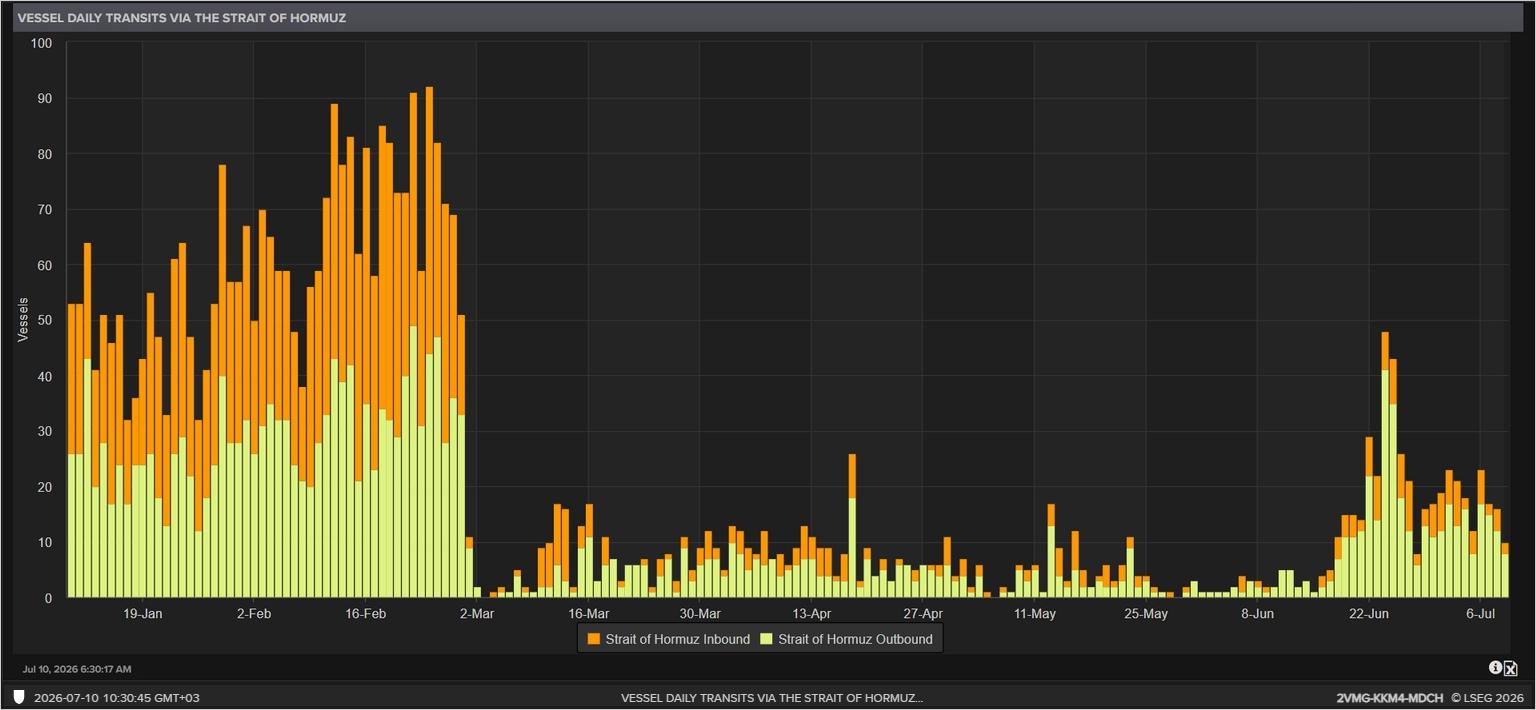
A return to full-blown fighting in the region could sour sentiment in equity markets – where sentiment is already fragile – and distract traders from the Q2 earnings season, which goes into full swing next week. The major banks will be in focus, so too will Netflix, but most investors will probably be primarily concerned about what the earnings outlook holds for the AI sector, as ASML Holding and Taiwan Semiconductor report their results.
China's economy may have hit a bump in Q2
Despite China being at the centre of the trade war storm with Trump, its economy suffered surprisingly few bruises from all the tariff blows. However, it may not have been so immune to the Middle East conflict, as economic growth likely cooled in the three months to June.
After notching up solid growth of 5.0% y/y in Q1, GDP is expected to have risen by 4.4% y/y in Q2, which would mark the slowest annual expansion since the end of 2022. On a quarterly basis, growth is expected at 0.9% q/q – a pace last seen in Q4 2023.
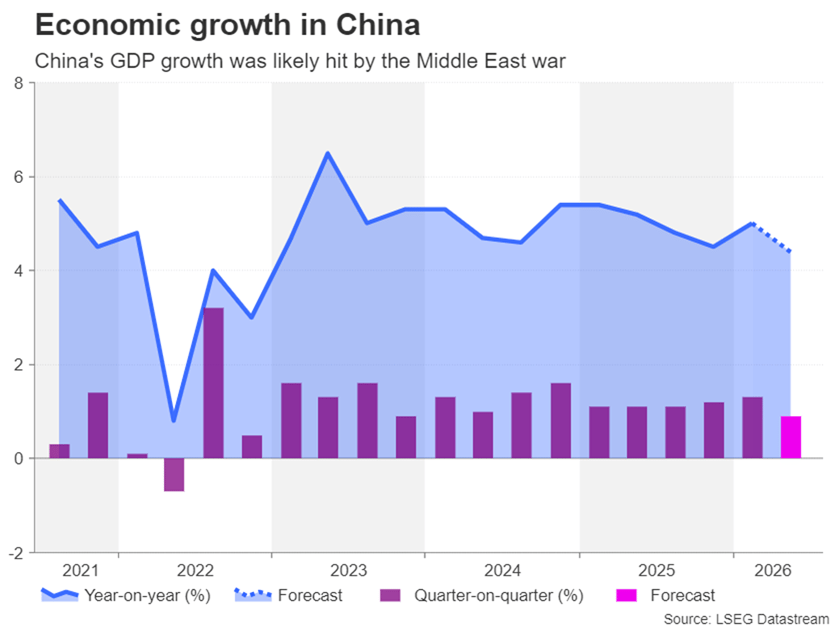
However, although the energy price shock was probably the biggest drag, China's economy has been in some trouble for a while. The government's efforts over the past decade to deleverage the economy have put the brakes on growth. But although these policies have had only modest success in reducing debt, one side effect is that it triggered a property crash.
Consumer demand has consequently tanked and has been unable to recover even with endless support measures by the government to lift spending. A jump in exports this year doesn't appear to have been enough to push overall growth into higher gear. The latest trade figures due on Tuesday will show whether export growth maintained momentum in June. A day later, the GDP data will follow, which will include the June readings for industrial production and retail sales.
Stronger-than-expected GDP numbers could boost risk appetite, although probably not much, while any sharp slowdown could hurt global equities as well as the risk-sensitive aussie and kiwi.
Dovish BoC does the loonie no favours
Talking of the kiwi, the RBNZ's decision this week to raise interest rates and flag more to come gave the currency a substantial lift. However, the Canadian dollar is unlikely to enjoy a similar boost when the Bank of Canada meets on Wednesday.
No change in rates is anticipated at the BoC's July meeting, as Governor Tiff Macklem remains worried about the "weak" economy. Although there's been some improvement in the jobs market and headline inflation is on the up, growth is still sluggish and underlying CPI measures remain stable.
Moreover, with oil prices having almost erased the post-war rally, even after the past week's spike, the inflation threat appears to be receding, removing the urgency for policymakers to respond with tighter policy. Crucially, after Macklem's repeated playing down of the inflation risks, investors see just over a 50% probability of a 25-bps rate hike by December.
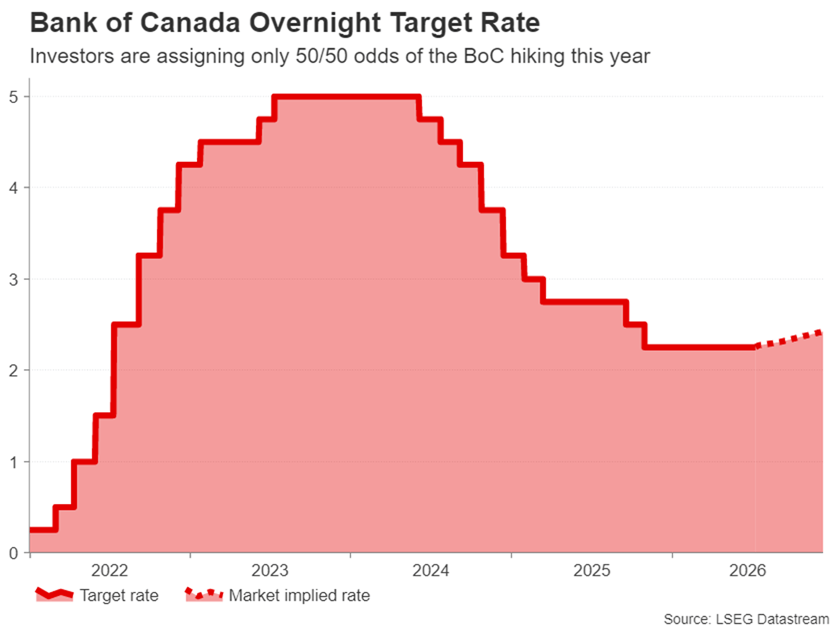
The Fed, on the other hand, looks sure to hike rates at least once over the coming months, and this divergence between the Fed and BoC has been damaging to the loonie, which has slumped to 15-month lows versus the greenback.
Pound shrugs off political risks, euro and yen struggle
The pound, whose performance this month is on par with the kiwi's rather than the loonie's, will also attract some attention next week, with investors watching the monthly GDP estimate for May on Thursday. UK GDP contracted by 0.1% m/m in April when Gulf oil and gas supplies remained constrained. A further decline in May would raise concerns about the British economy's resilience just as Labour's Andy Burnham is all set to replace Keir Starmer as prime minister later this month.
Labour MPs have until July 16 to submit nominations for the leadership race, otherwise Burnham would automatically become party leader and PM by July 20. Burnham may wait for the official declaration before presenting more policy details, leaving the pound vulnerable to speculation until then.
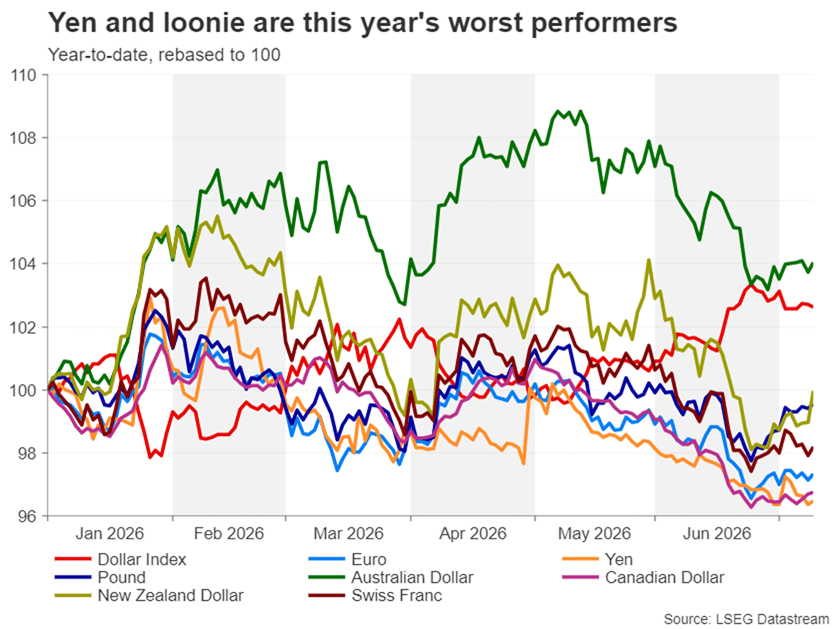
The euro, meanwhile, has been underperforming against both the pound and dollar lately. But there could be some support for the single currency on Friday if there's an upward revision to the Eurozone's final estimate of June CPI.
The yen is another laggard, and traders will be on high alert for possible intervention by Japanese authorities as the dollar keeps marching higher in relentless fashion, now approaching the 163-yen level.
Dollar’s Next Move Hinges on CPI and Warsh’s First Testimony
- US CPI report and Fed Chair Warsh's dual testimonies in the spotlight.
- Headline inflation is expected to ease, but will the deceleration surprise?
- Investors to monitor Warsh's rhetoric for clues about a September rate hike.
- Euro/dollar could revisit recent lows if CPI surprise on the upside and Warsh appears hawkish.
Dollar in demand
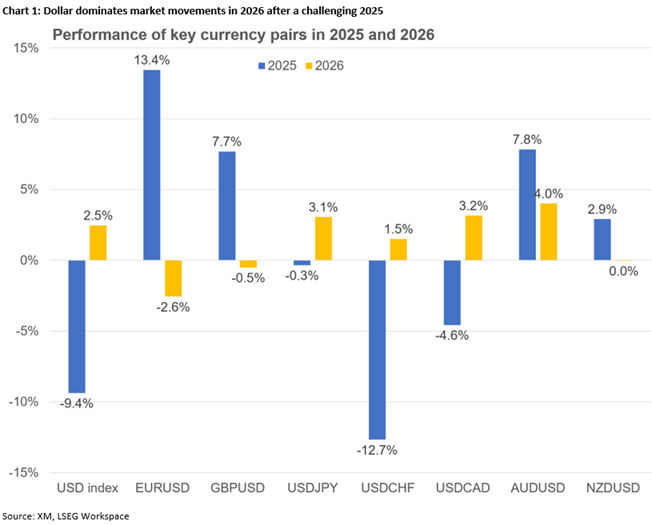
The US dollar has been one of the main protagonists of 2026, with the arrival of newcomer Fed Chair Warsh adding to the plethora of bullish catalysts. The dollar index climbed in late June to the highest level since May 2025, when the greenback was trying to recover from the reciprocal tariff announcements.
Busy data calendar – CPI in the spotlight
Next week's calendar will be exceptionally busy with a series of data prints and the first Humphrey-Hawkins testimony from Fed Chair Warsh. Specifically, the last CPI report ahead of the July 29 Fed meeting will be released on Tuesday at 12:30 GMT.
Following the solid May print, given the 20% monthly drop in oil prices in June and despite the World Cup boosting spending, there is a strong probability of the headline CPI decelerating below the 4% level again, largely erasing the May jump. Similarly, core CPI should also follow suit with a smaller drop. Both are expected to remain above the 2% inflation target.
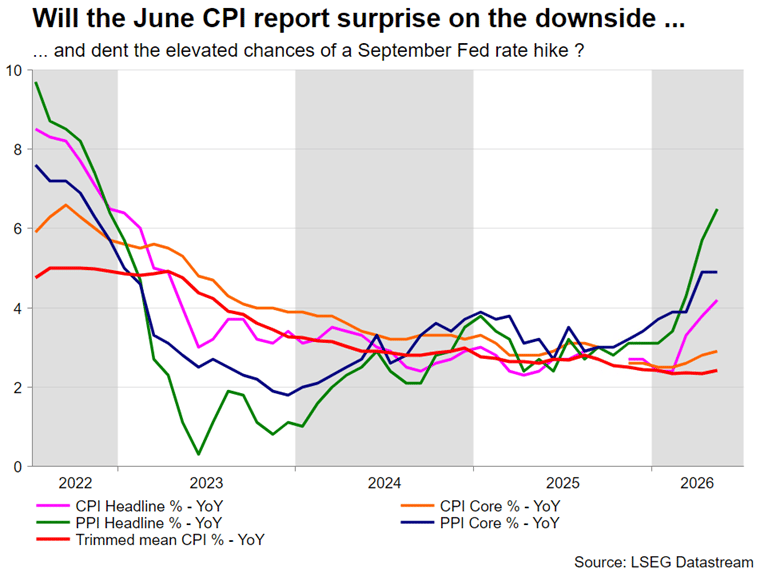
PPI and retail sales data releases will follow on Wednesday and Thursday respectively, while Friday's University of Michigan Consumer Sentiment index will complete the picture. Following the strong PPI report from China, chances of another solid PPI print cannot be underestimated, while both retail sales and UoM survey could climb on the back of the lower energy prices and the World Cup impact, especially as these data releases cover a period when the US soccer team was advancing in the tournament.
Warsh's testimony stands out
Fed Chair Warsh will appear before the House Financial Services Committee on Tuesday and before the Senate Banking Committee on Wednesday. Both have a starting time of 14:00 GMT with the latter usually being less market-moving.
Since taking office, Fed rate hike expectations have jumped, with Warsh's post-FOMC meeting press conference, the panel discussion at the ECB Forum in Sintra, Portugal and the June 17 meeting minutes justifying these hawkish expectations.
Warsh has made it quite clear that he dislikes forward guidance in normal periods and has emphasized the Committee's unease about inflation running well above target, thus highlighting that there is work to be done on price stability. The minutes left little doubt about the hawks holding the upper hand in the FOMC.
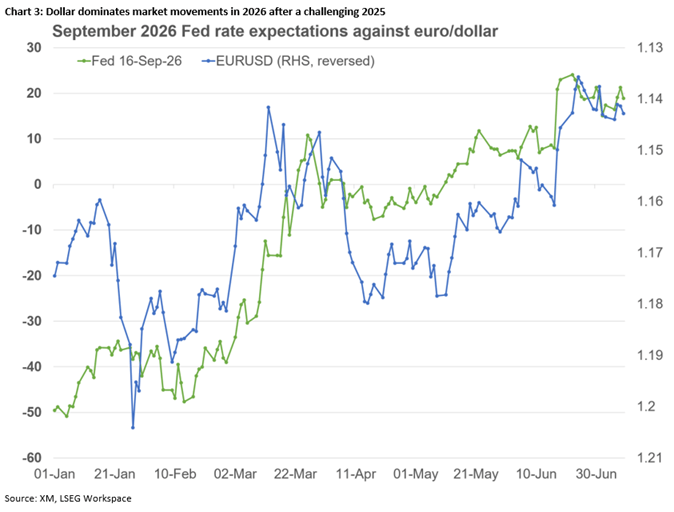
Warsh is expected to move along these lines in his dual testimonies, potentially also highlighting the failures of his predecessor to get inflation under control and claiming that the Fed's stance has been distorted by an inflated balance sheet and non-rate measures.
Barring a major hawkish surprise that puts a July rate hike on the table, investors will closely watch for any clues about the expected September rate hike and whether the recent soft labour market data has alarmed Warsh. If Warsh appears confident about the jobs market, expectations of a September hike could strengthen.
Dollar stabilizes after strong gains
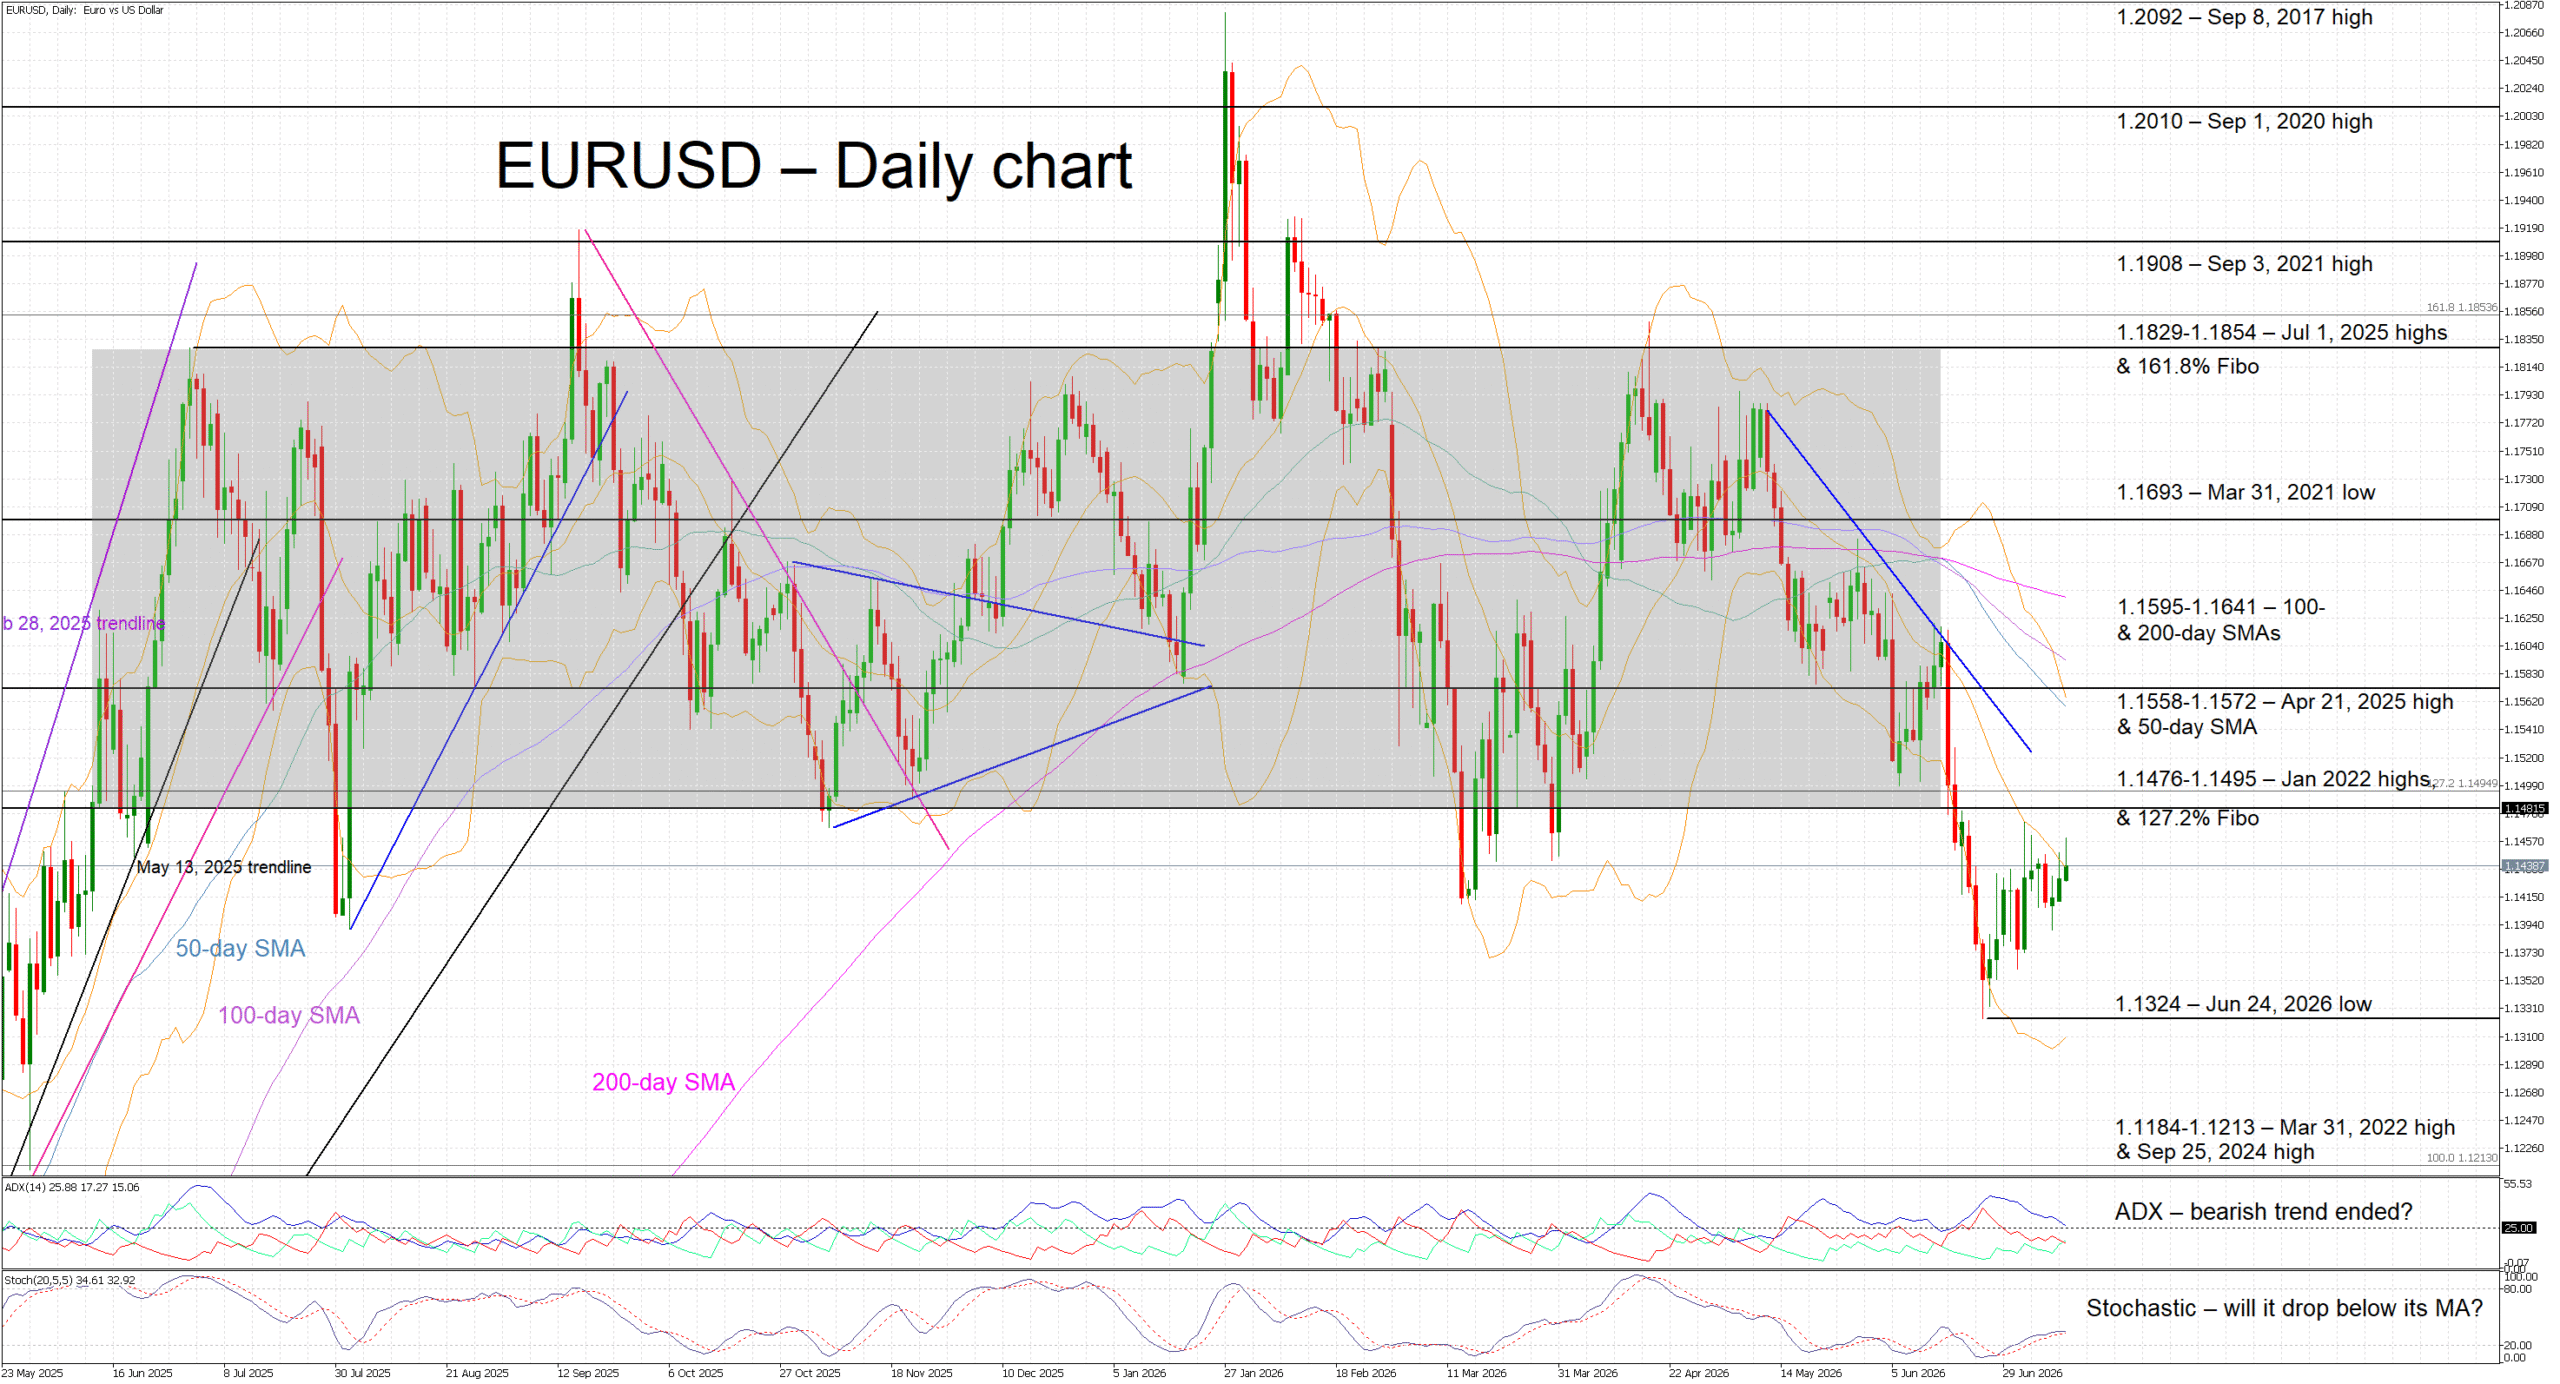
Following the June FOMC meeting, euro/dollar broke the one-year-long wide 1.1470-1.1829 range, dropping to the lowest level since May 30, 2025. With the ECB's hawkish stance exerting little upside influence on this pair and the eurozone economy struggling, the greenback dictates movements.
A softer inflation print on Tuesday and Warsh largely repeating his recent comments could somewhat dent the dollar's appeal. However, expectations for a September hike will most likely remain well supported. A test of the lower boundary of the recent range at 1.1470 could materialize but such a move might prove short-lived.
On the other hand, an inflation report that fails to show significant deceleration and a hawkish Warsh – for example, by repeating the Fed's commitment to price stability while dismissing job market concerns – could push euro/dollar towards the recent trough of 1.1324.
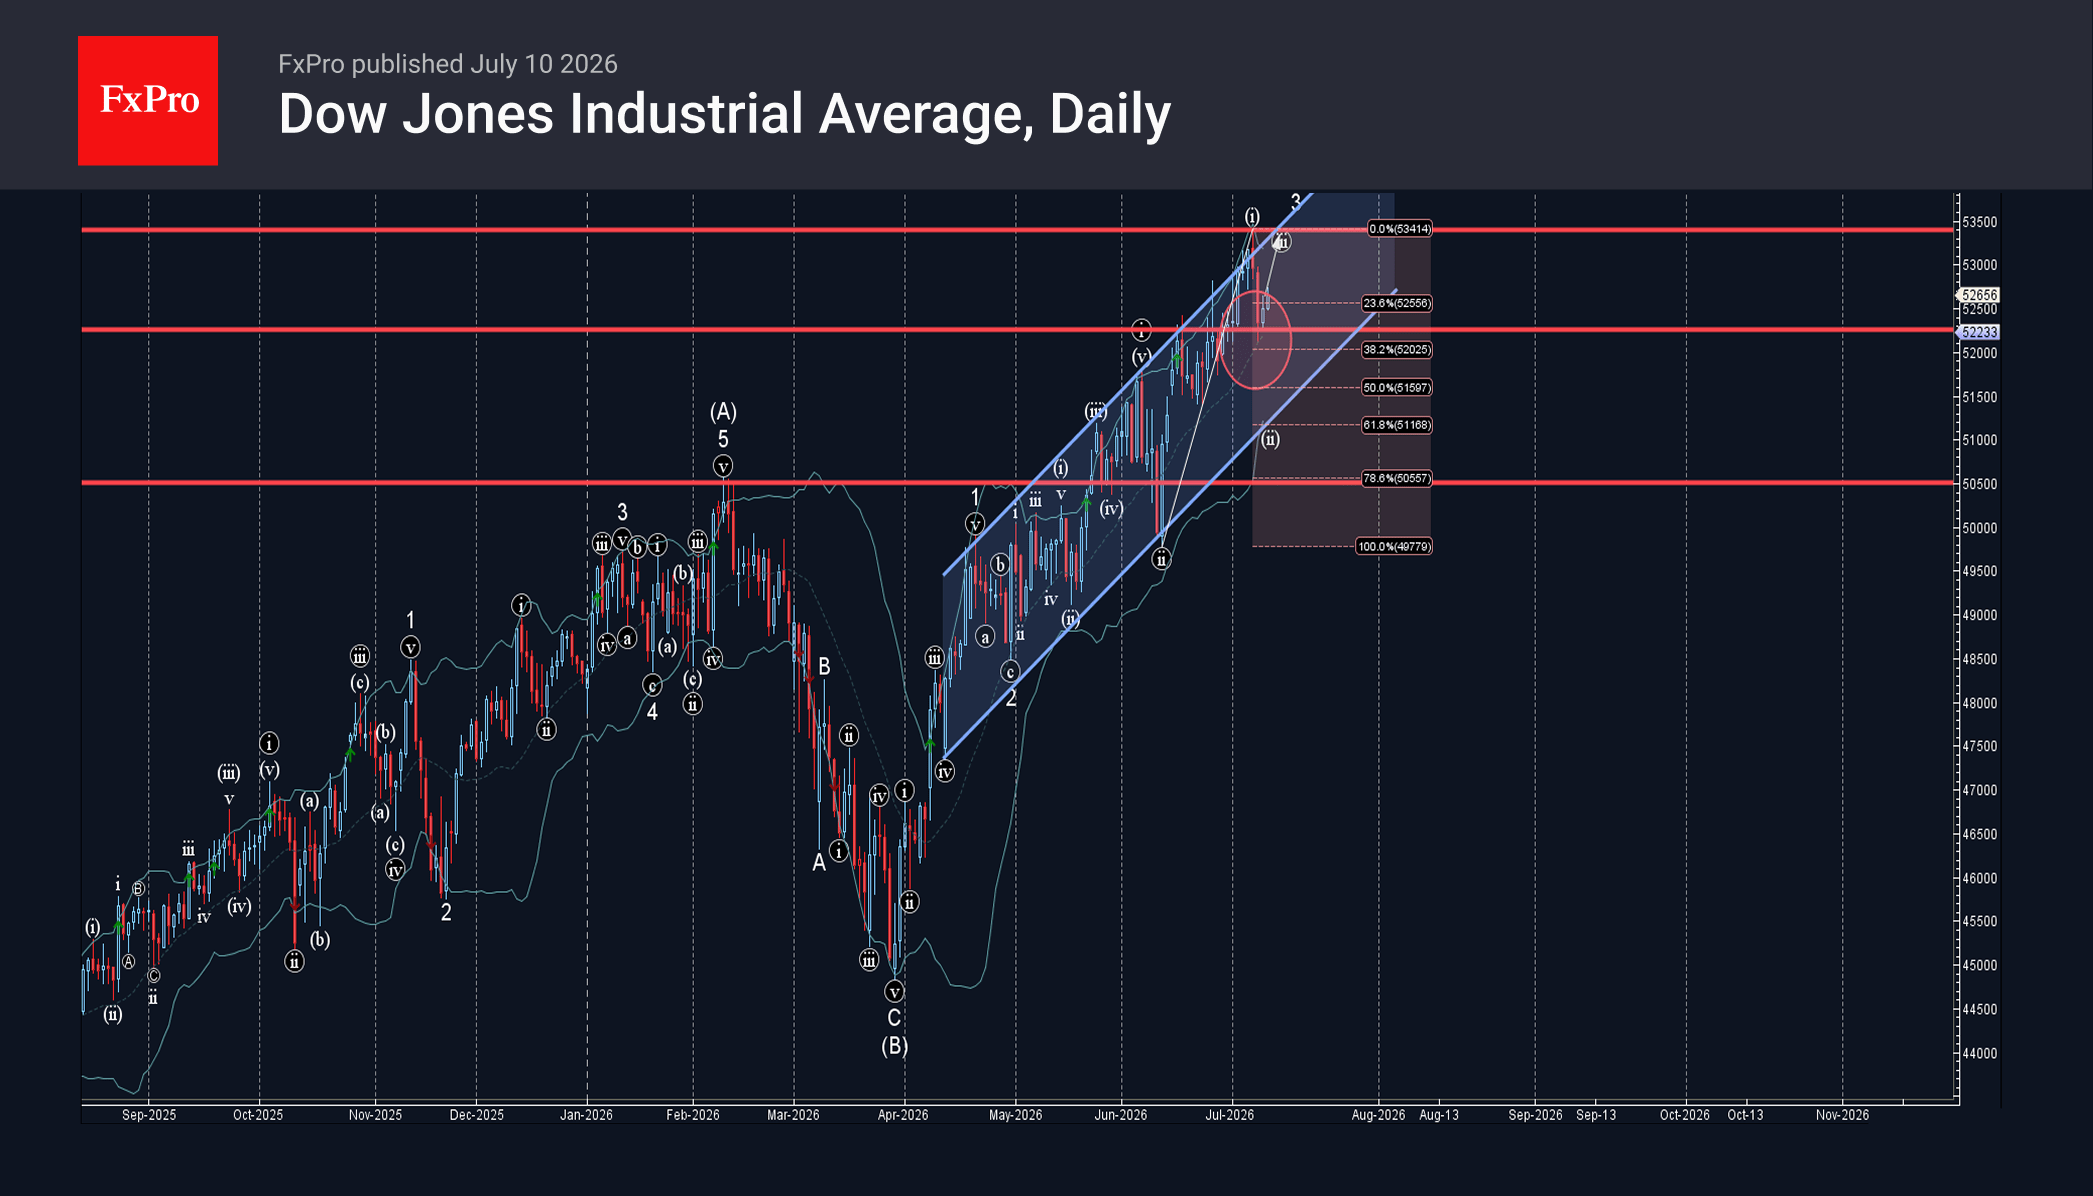
Dow Jones Index Wave Analysis
Dow Jones index: ⬆️ Buy
– Dow Jones reversed from support zone
– Likely to rise to resistance level 53500.00
Dow Jones index recently reversed up from the support zone between the support level 52250.00 (former strong resistance from June), 38.2% Fibonacci correction of the upward impulse from June and 20-day moving average.
The upward reversal from this support zone started the active minor impulse wave iii of the intermediate impulse wave (C) from March.
Given the strong daily uptrend, Dow Jones index can be expected to rise further to the next resistance level 53500.00 (which stopped earlier impulse wave i).
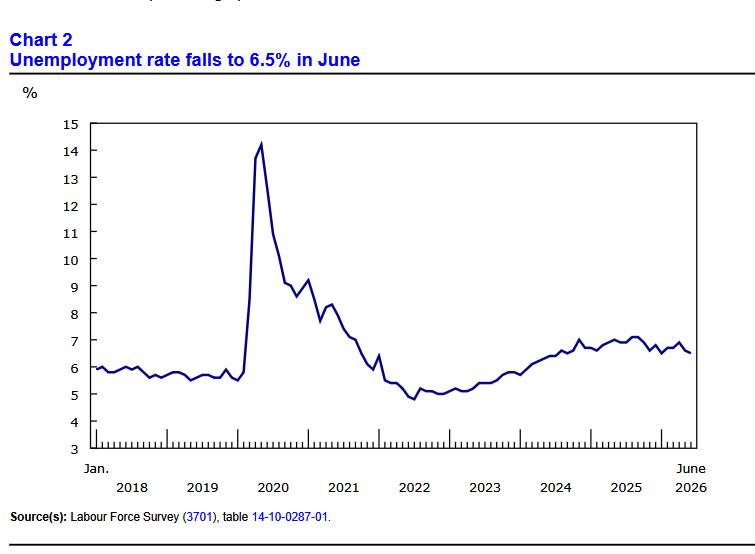
Canada’s Job Market Takes a Small Step in the Right Direction in June
- Canada’s economy added 18k jobs in June (+0.1% m/m), broadly in line with consensus expectations for a 10k gain. Employment gains were concentrated in the private-sector, while public-sector employment declined on the month.
- The unemployment rate eased to 6.5% from 6.6%, as labour supply remained stable, with the labour force participation rate holding at 65%.
- Job gains were led by accommodation and food services (+15k), while manufacturing lost 17k jobs. Manufacturing employment has fallen by 61k since January 2025 (3.2%), when tariff uncertainty began.
- Average hourly wages rose 3.3% year-on-year in June, up from a 3.0% pace in May.
Key Implications
- This report landed broadly in line with market expectations. Following May’s exceptionally strong gain, hiring moderated in June, and the unemployment rate returned to where it began the year. Pulling back the lens, Canada’s labour market has made modest, but positive progress over the past year.
- Manufacturing, where job losses continue to mount, remains a poster child of the uncertainty hanging over the Canadian economy. It is a reminder that the economy continues to operate below capacity, with downside risks concentrated in trade-exposed sectors. This should continue to provide a disinflationary offset. With this backdrop we expect the Bank of Canada to remain on the sidelines and keep its policy rate unchanged at 2.25% at next week's meeting.
Markets Stay in Wait-and-See Mode as Canada, Japan and Oil Offer No Breakthrough
Currency markets is heading to the end of the week on a subdued note as a series of developments across Canada, Japan and the Middle East ultimately reinforced existing narratives rather than triggering a meaningful repricing. Canadian Dollar gained modest support after another resilient employment report, while Yen held onto earlier gains sparked by Japan's pension fund initiative. Yet neither move developed into a sustained trend. Elsewhere, easing tensions between the US and Iran helped keep Brent crude comfortably below the critical USD 80 mark, allowing broader FX trading to settle into consolidation.
Canada Jobs Reinforce BoC Hold
Canadian Dollar firmed modestly in the early US session after June employment data came in slightly stronger than expected. Employment rose by 18.2k against expectations for a 10.0k increase, while the unemployment rate unexpectedly fell to 6.5% from 6.6%. The report was further supported by a steady participation rate and firmer wage growth, presenting a broad picture of a labor market that continues to outperform expectations.
The figures pose a meaningful challenge to any outright dovish Bank of Canada narrative. They reinforce Governor Tiff Macklem's assessment that the domestic economy has remained resilient despite growing uncertainty surrounding Canada's evolving trade relationship with the United States. At the same time, the report falls well short of making a convincing case for renewed tightening. With structural uncertainty surrounding the USMCA review still clouding the medium-term outlook, markets continue to expect the BoC to leave rates unchanged through the remainder of the year. Next week's policy meeting is unlikely to produce a material shift in guidance.
Japan's Structural Idea Needs Time
Yen also remained generally firmer after Finance Minister Katayama suggested encouraging pension funds to increase investment in domestic financial assets. Investors viewed the comments as pointing toward a potential structural solution to one of the Ten's longstanding weaknesses—persistent capital outflows into overseas assets—rather than another round of tactical currency intervention.
However, the initial enthusiasm has begun to fade. The proposal remains an idea rather than a formal policy initiative, and any meaningful portfolio reallocation would require decisions by independent institutional investors such as GPIF. Even if implemented, the process would unfold gradually over years rather than weeks, while the wide interest-rate differential between Japan and the United States continues to underpin carry trades. As a result, today's gains lacked strong follow-through despite the favorable initial market reaction.
Oil Retreat Keeps Broader Markets Calm
Meanwhile, geopolitical concerns also moderated after another round of hostilities between the United States and Iran earlier in the week. While attacks briefly renewed worries about global energy supplies and the security of Strait of Hormuz transit, Brent crude eased back toward USD 76 after failing to sustain gains above USD 80. The pullback suggests markets continue to view the latest flare-up as another episode within an ongoing negotiation process rather than the beginning of a renewed regional conflict.
Reports that both sides have returned to technical discussions further supported that interpretation. As long as Brent remains below the USD 80 threshold, investors appear reluctant to rebuild a significant geopolitical risk premium across broader financial markets.
For the week so far, New Zealand Dollar remains the strongest major currency, followed by Sterling and Canadian Dollar, while Swiss Franc, Yen and Euro lag the performance table.
Yen Jumps as Markets See Katayama's Pension Fund Push as Structural Fix for Currency Weakness
The Yen's latest rally wasn't driven by intervention speculation. Markets instead focused on a potential structural shift in Japan's capital flows after Finance Minister Katayama encouraged greater domestic investment by pension funds. Find out why investors believe this could have a more lasting impact than traditional FX intervention. Read More.
Canada Employment Tops Forecast as Jobless Rate Falls Again
Canada's employment rose by 18.2k in June while the unemployment rate fell to 6.5%, reinforcing labor market resilience ahead of next week's Bank of Canada meeting. Read More.
Japan PPI Hits Fastest Pace Since 2023 as Energy, AI Demand Drive Costs Higher
Japan's wholesale inflation accelerated to its fastest pace since March 2023 as the Middle East energy shock, booming AI-related metals demand and a weaker yen combined to push producer prices higher. Read More.
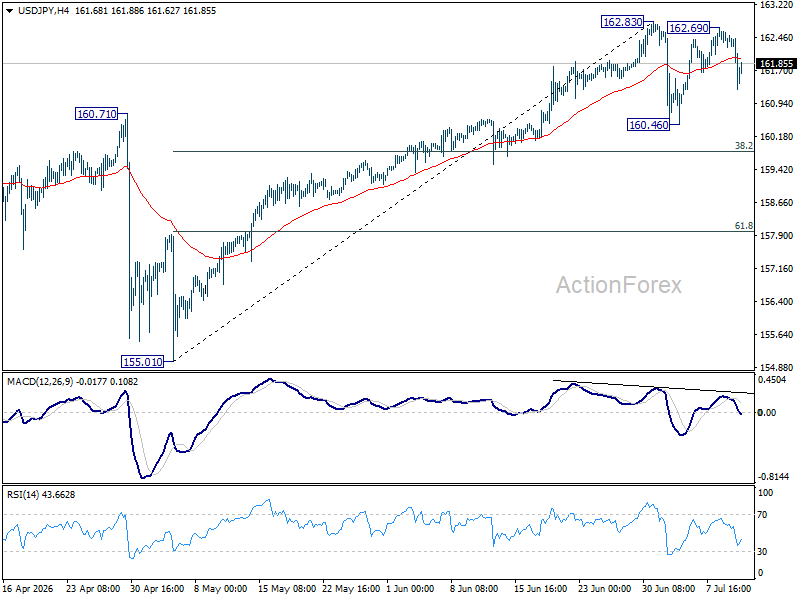
USD/JPY Daily Outlook
USD/JPY falls sharply today but still it's bounded in range below 162.83. Intraday bias remains neutral and more consolidations would be seen. In case of deeper pullback, downside should be contained by 38.2% retracement of 155.01 to 162.83 at 159.84. On the upside, firm break of 162.83 will resume larger up trend.
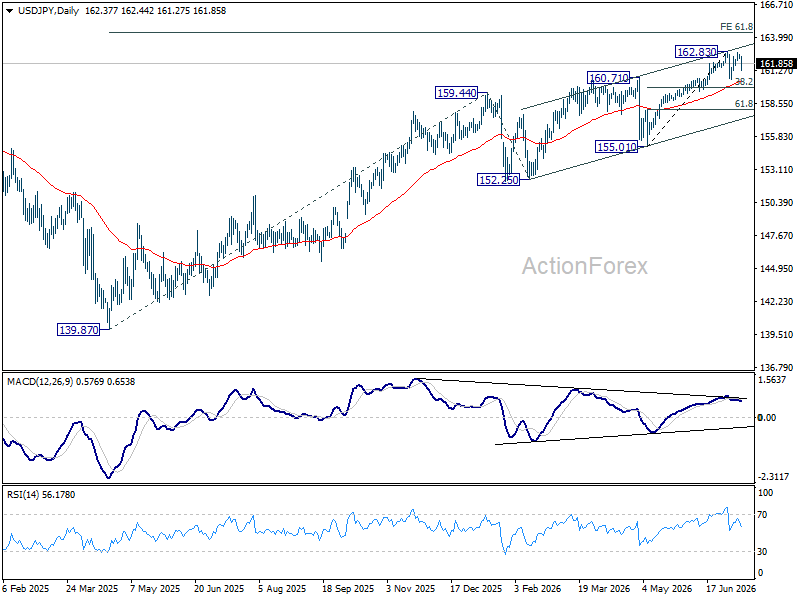
In the bigger picture, rise from 139.87 (2025 low) is seen as another rising leg of the long term up trend. Next target is 61.8% projection of 139.87 to 159.44 from 152.25 at 164.34. For now, outlook will remain bullish as long as 155.01 support holds, even in case of deep pullback.
Canada Employment Tops Forecast as Jobless Rate Falls Again
Canada's labor market continued to show resilience in June, with employment rising by 18.2k, comfortably above expectations for a 10.0k increase. While hiring slowed from May's exceptionally strong 87.8k gain, the latest figures point to continued labor market stability rather than the sharp normalization many investors had anticipated. The unemployment rate unexpectedly declined to 6.5% from 6.6%, marking a second consecutive monthly fall and reinforcing the view that labor demand remains firm despite mounting uncertainty surrounding Canada's trade outlook.
The details of the report were broadly encouraging. The employment rate edged up 0.1 percentage point to 60.8%, while the labor force participation rate held steady at 65.0%, indicating that the decline in unemployment was driven by stronger hiring rather than workers leaving the labor force. On a year-over-year basis, employment increased by 99k, or 0.5%, led by a 131k gain in full-time positions. Wage growth also picked up, with average hourly earnings rising 3.3% from a year earlier after a 3.0% increase in May, suggesting income growth remains supportive of household spending.
The figures are unlikely to fundamentally change the Bank of Canada's policy outlook, but they do weaken the case for markets to price a more dovish stance ahead of next week's meeting. Governor Tiff Macklem has emphasized that the larger challenge facing Canada is structural rather than cyclical, with evolving trade relations under the USMCA review process expected to reshape investment and growth over time. One stronger employment report does little to resolve those longer-term uncertainties, but it does suggest the domestic economy is going through that adjustment period in a position of greater strength than many investors had assumed.
| Indicator | June | May | Expectation |
|---|---|---|---|
| Employment Change | +18.2k | +87.8k | +10.0k |
| Unemployment Rate | 6.5% | 6.6% | 6.6% |
| Employment Rate | 60.8% | 60.7% | — |
| Participation Rate | 65.0% | 65.0% | — |
| Average Hourly Wages (YoY) | 3.3% | 3.0% | — |
| Employment (YoY) | +99k (+0.5%) | — | — |
| Full-Time Employment (YoY) | +131k (+0.8%) | — | — |
EUR/USD Daily Outlook
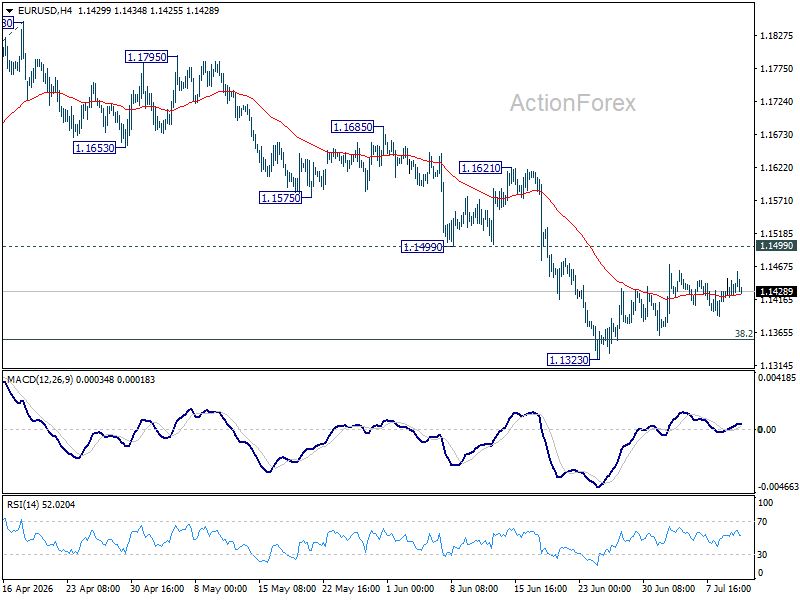
EUR/USD is still bounded in consolidations above 1.1323 and intraday bias remains neutral. . With 1.1499 support turned resistance intact, further decline is expected. On the downside, break of 1.1323 will resume the fall from 1.2081 to 100% projection of 1.2081 to 1.1408 from 1.1848 at 1.1175. However, decisive break of 1.1499 will turn bias back to the upside 1.1621 resistance and above.
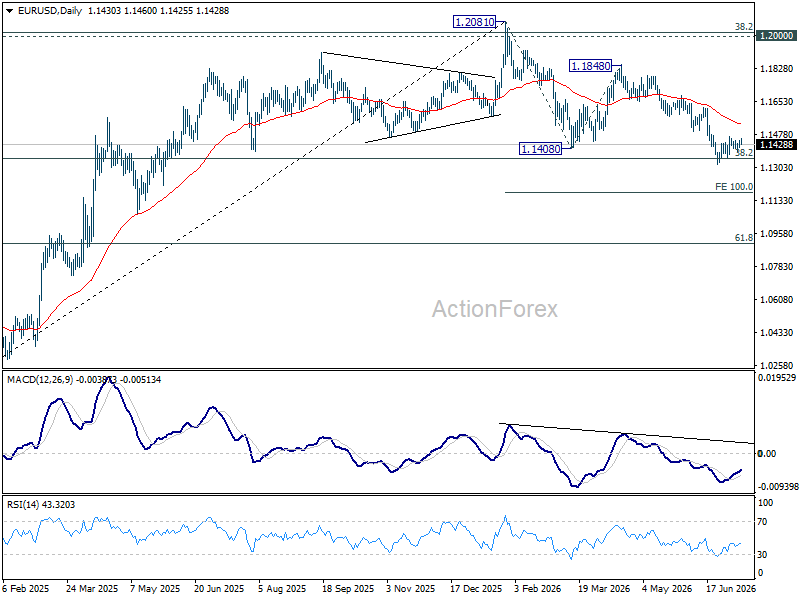
In the bigger picture, focus is back on 38.2% retracement of 1.0176 to 1.2081 at 1.1353. Decisive break there will revive the case of medium term bearish trend reversal after rejection by 1.2 key cluster resistance level. Further fall should be seen to 61.8% retracement at 1.0904. Nevertheless, strong rebound from 1.1353, followed by break of 1.1621 resistance, will retain medium term bullishness.
USD/JPY Daily Outlook
USD/JPY falls sharply today but still it's bounded in range below 162.83. Intraday bias remains neutral and more consolidations would be seen. In case of deeper pullback, downside should be contained by 38.2% retracement of 155.01 to 162.83 at 159.84. On the upside, firm break of 162.83 will resume larger up trend.
In the bigger picture, rise from 139.87 (2025 low) is seen as another rising leg of the long term up trend. Next target is 61.8% projection of 139.87 to 159.44 from 152.25 at 164.34. For now, outlook will remain bullish as long as 155.01 support holds, even in case of deep pullback.