
Sample Category Title
EURUSD Trade Setup Explained: Buying the Dips at the Blue Box Zone
Hello fellow traders. In this technical article, we are going to talk about another Elliott Wave trading setup we got in EURUSD . The pair has completed its correction exactly at the Equal Legs zone, also known as the Blue Box Area. In this article, we’ll break down the Elliott Wave Forecast and explain the logic behind the trading setup in detail.
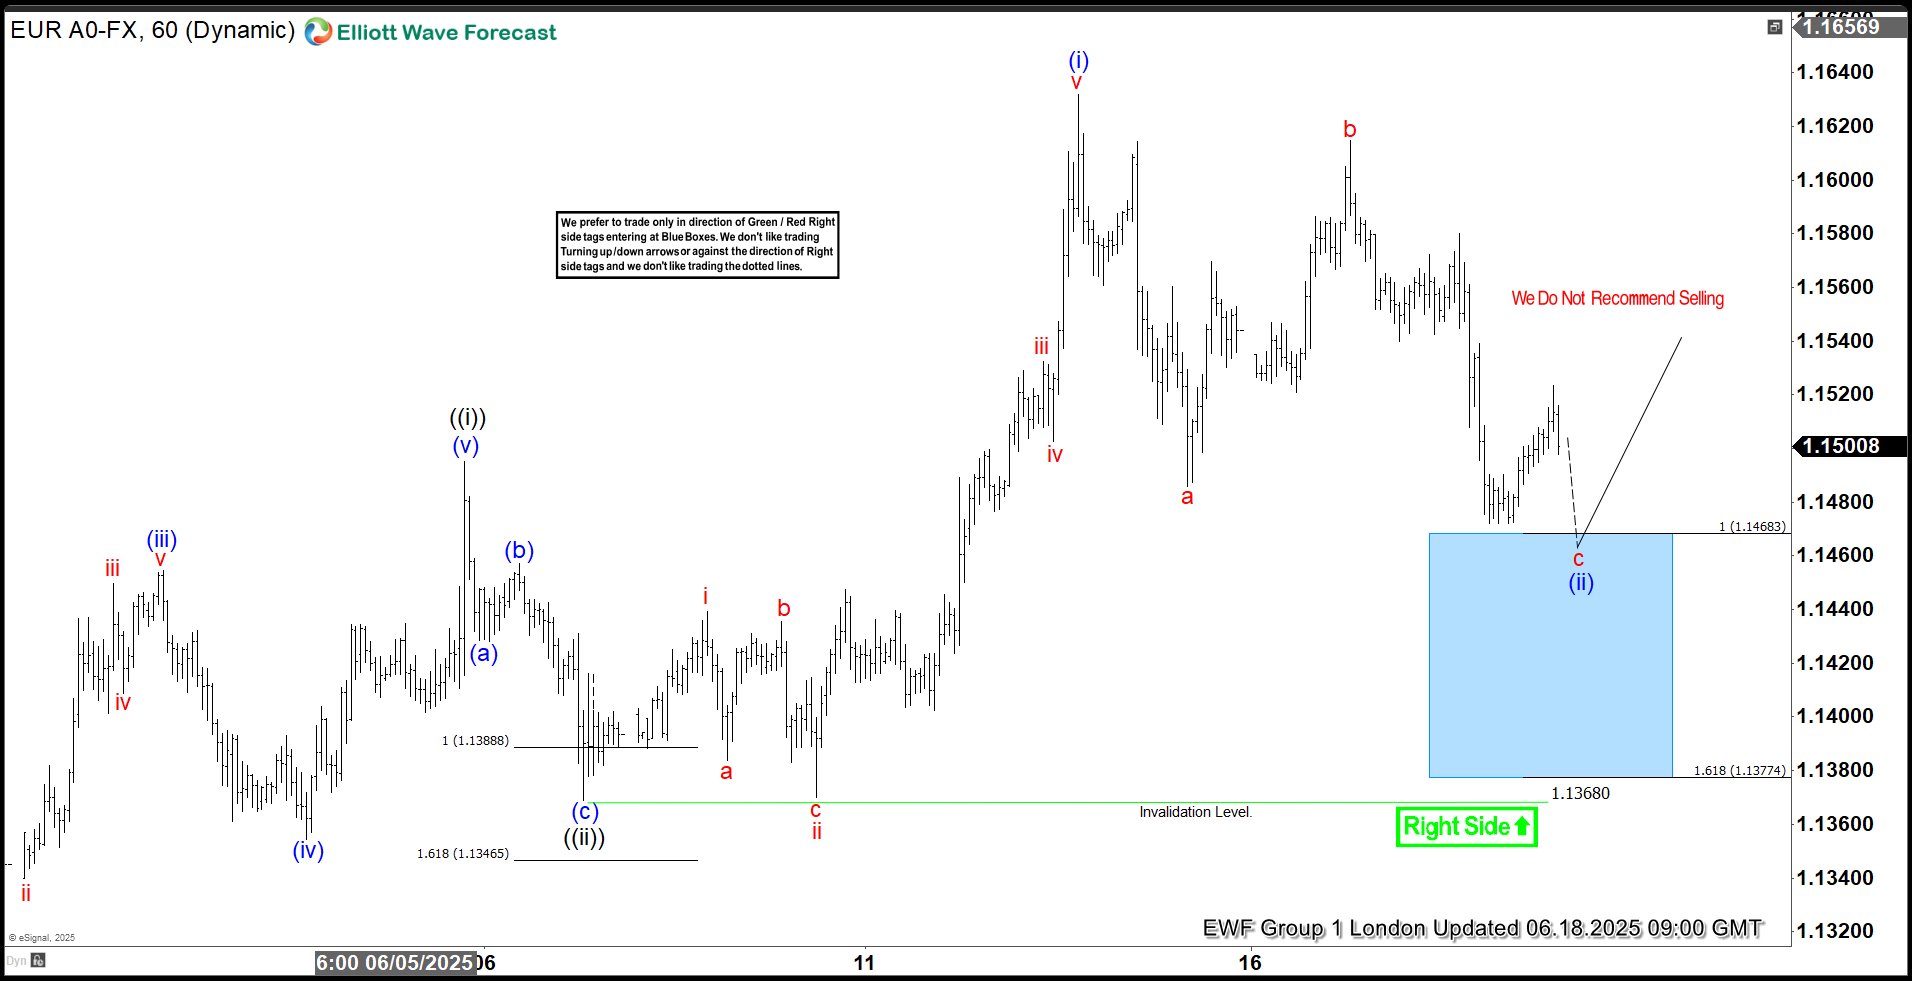
EURUSD Elliott Wave 1 Hour Chart 06.18.2025
The price is showing a lower-low sequence from the peak. As of now, correction looks incomplete. The price action suggests that EURUSD correction is still in progress, and we expect another leg down toward the 1.14683- 1.13774 area, where we are looking to re-enter as buyers.
We recommend members avoid selling EURUSD. As the main trend remains bullish, we anticipate at least a three-wave bounce from the Blue Box area.
Once the price reaches the 50% Fibonacci retracement against the red b connector, we’ll make the position risk-free by moving the stop loss to breakeven and booking partial profits.
Did you know ? 90% of traders fail because they don’t understand market patterns. Are you in the top 10%? Test yourself with this advanced Elliott Wave Test
Official trading strategy on How to trade 3, 7, or 11 swing and equal leg is explained in details in Educational Video, available for members viewing inside the membership area.
Quick reminder on how to trade our charts :
Red bearish stamp+ blue box = Selling Setup
Green bullish stamp+ blue box = Buying Setup
Charts with Black stamps are not tradable. 🚫
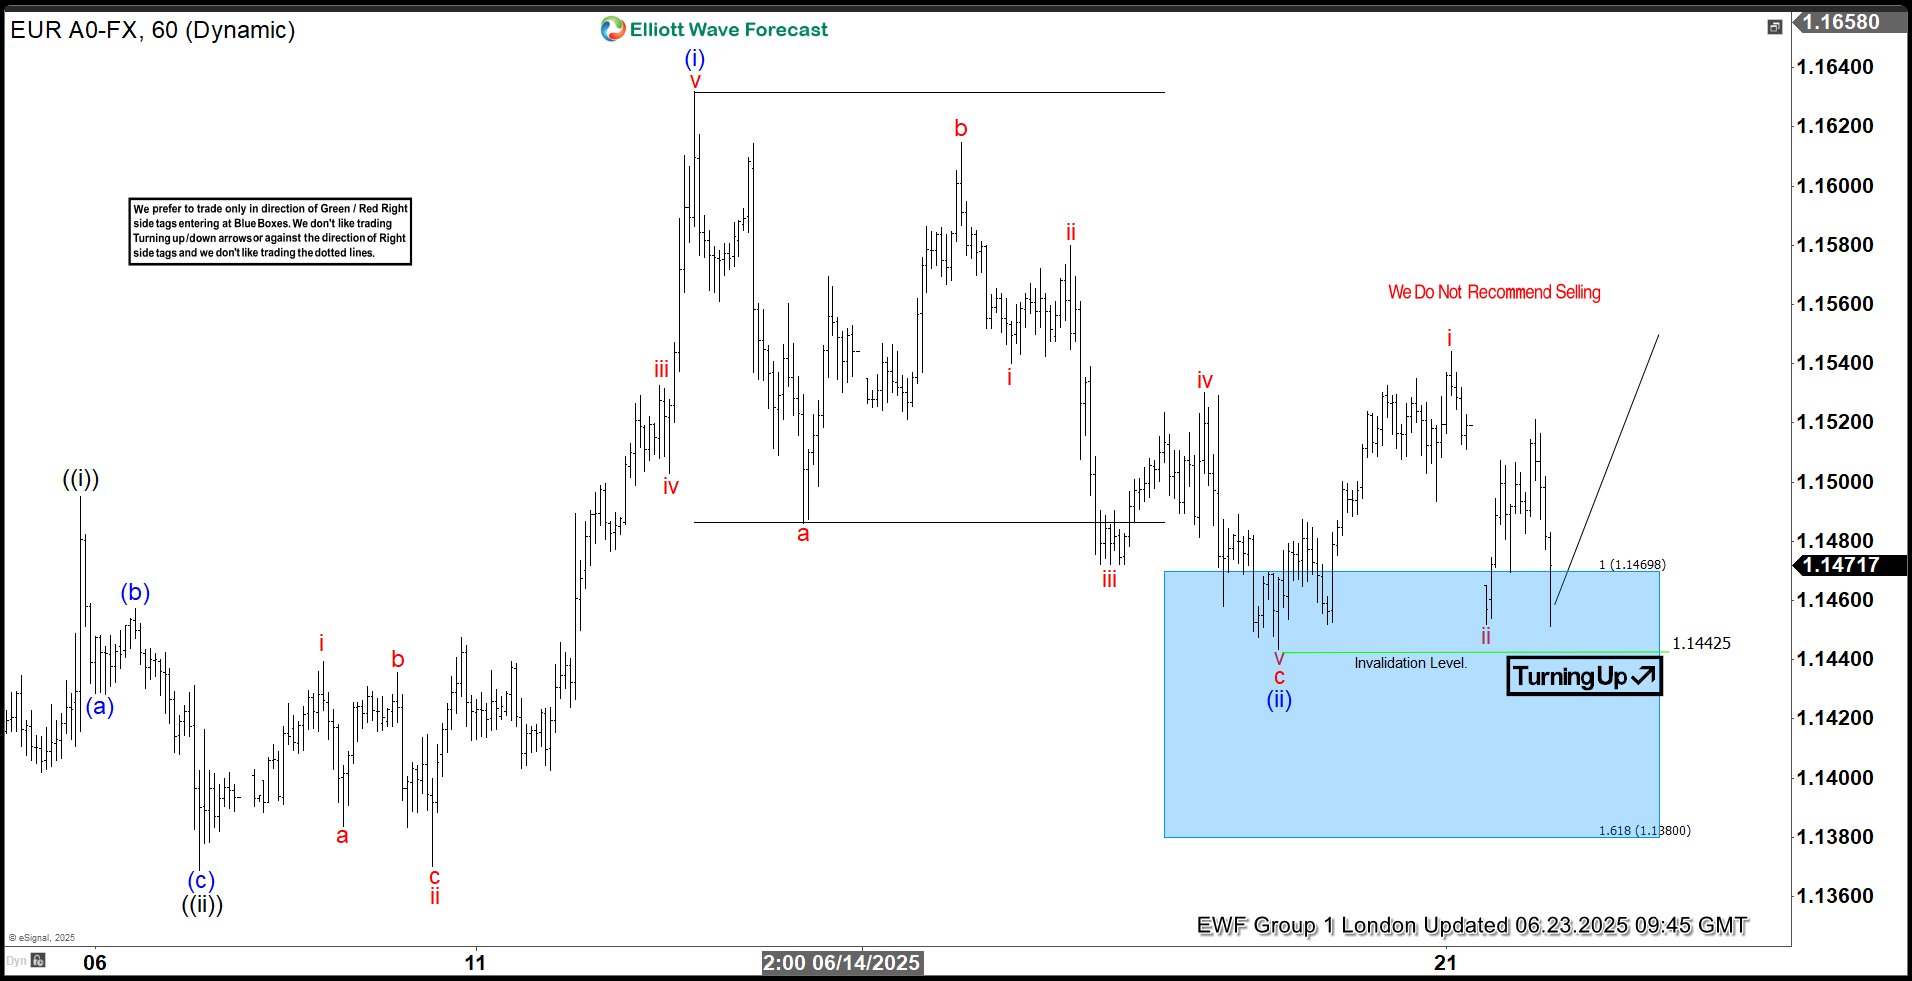
EURUSD Elliott Wave 1 Hour Chart 06.23.2025
EURUSD has made another wave down and completed correction right at the Blue Box area at the 1.14425 low. The pair found buyers as expected, making decent reaction. The bounce reached 50 fibs against the b red connector. Consequently, any long positions from the Blue Box should now be risk-free. We’ve already secured partial profits. Key level comes at 1.14425 low. While above that level more upside should be ideally seen.
S&P 500 Wave Analysis
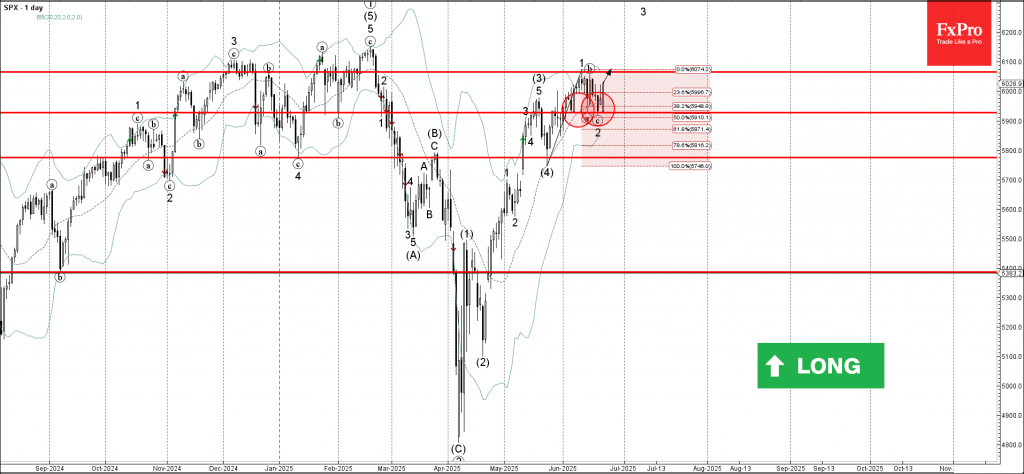
S&P 500: ⬆️ Buy
- S&P 500 reversed from support area
- Likely to rise to resistance level 6065.00
S&P 500 index recently reversed from the support area between the support level 5930.00 (which reversed the price multiple times from the start of June) and the 50% Fibonacci correction of the sharp upward impulse 1 from last month.
The upward reversal from this support area stopped the previous minor ABC correction 2 from the start of June.
S&P 500 index can be expected to rise to the next resistance level 6065.00 (which stopped the previous minor impulse wave 1).
Bitcoin Wave Analysis
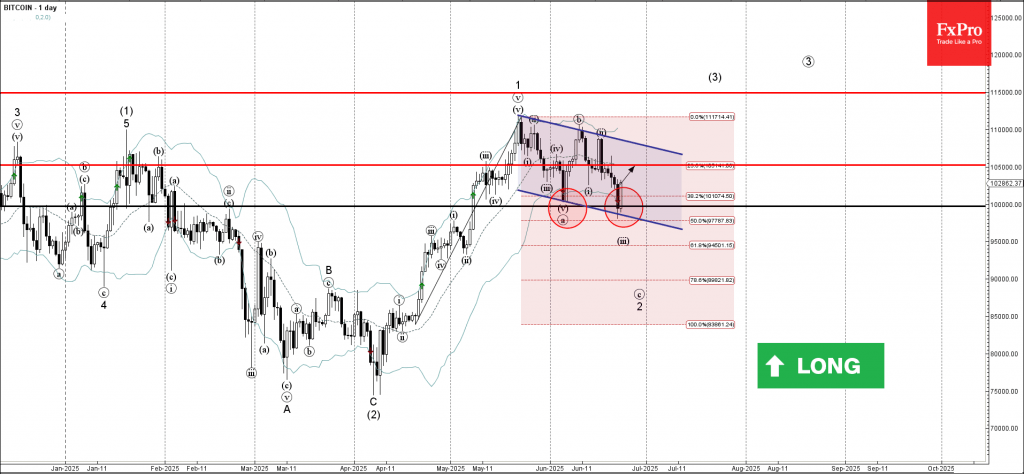
Bitcoin: ⬆️ Buy
- Bitcoin reversed from round support level 100,000
- Likely to rise to resistance level 105,000
Bitcoin cryptocurrency recently reversed from the support area between the round support level 100,000, the lower daily Bollinger Band and the 38.2% Fibonacci correction of the upward impulse from April.
This support area was further strengthened by the support trendline of the daily down channel from May.
Given the clear daily uptrend, Bitcoin cryptocurrency can be expected to rise to the next resistance level 105,000.
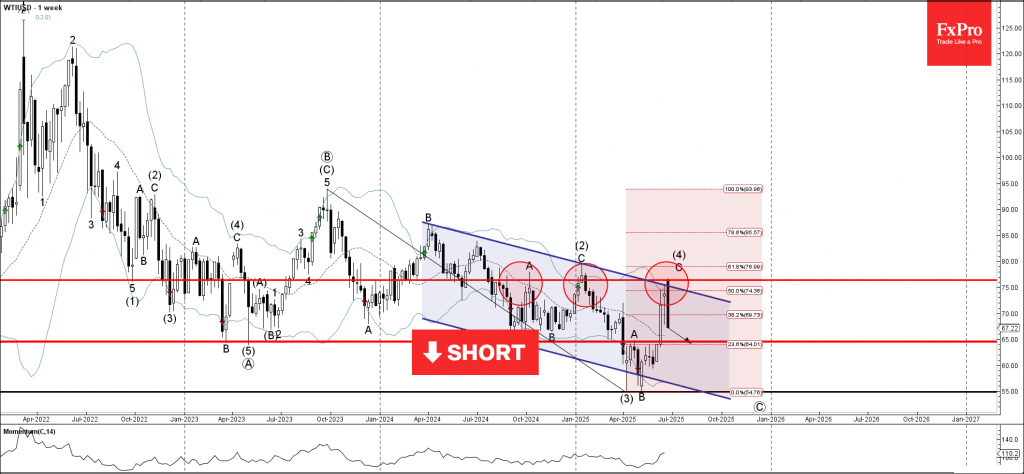
WTI Wave Analysis
WTI: ⬇️ Sell
- WTI reversed from the resistance area
- Likely to fall to support level 65.00
WTI crude oil recently reversed down from the resistance area located between the pivotal resistance level 76.45 (which has been reversing the price from the middle of last year), the upper weekly Bollinger Band and the resistance trendline of the weekly down channel from 2024.
The downward reversal from this resistance zone stopped the C-wave of the earlier weekly ABC correction (4) from April.
Given the clear weekly downtrend, WTI crude oil can be expected to fall to the next support level 65.00 (a former yearly low from 2024).
Fed’s Bowman opens door to July cut if inflation, jobs data cooperate
Fed Vice Chair Michelle Bowman signaled openness to a rate cut as soon as the July FOMC meeting, should incoming data show continued progress on inflation and further signs of labor market fragility.
In a speech today, Bowman noted that recent inflation readings have come in below expectations and appear to be on a “sustained path” toward the 2% target. She downplayed the inflationary impact of recent trade policy changes, stating their effects on core PCE are likely to be "only minimal".
Bowman acknowledged that risks to the Fed’s employment mandate may soon become more pressing, citing recent softness in consumer spending and “signs of fragility” in the labor market.
She emphasized the importance of upcoming economic data—including June’s jobs report and inflation print—as key inputs ahead of the July policy meeting.
“If inflation pressures remain contained,” Bowman said, “I would support lowering the policy rate as soon as our next meeting.”
Is Trump Causing Divisions Within Fed?
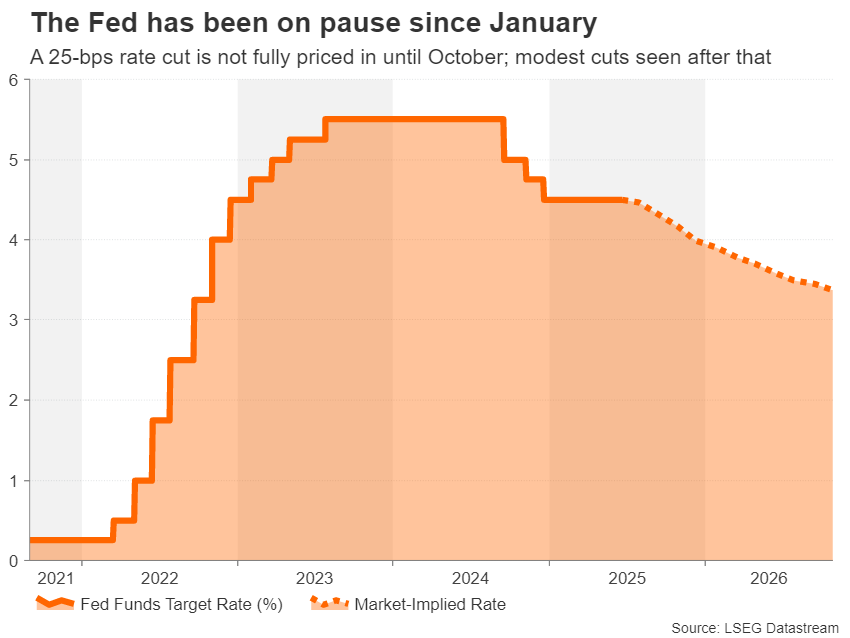
- Fed stays on pause and maintains two rate cuts outlook.
- But opinions within FOMC diverge; hawks may hold the upper hand.
- Are the trade war and Trump’s criticisms causing fractures at the Fed?
Trump not happy with 'Mr. Too-Late' Powell
President Trump has made it no secret that he is not happy with the job that Jerome Powell is doing as the current chair of the Federal Reserve. From name calling to outright demanding a rate cut, Trump’s patience with Powell appears to be running thin. Although, if anyone has earned the right for random outbursts, it is Powell, who’s so far, maintained a dignified silence during the course of Trump’s second term.
If rumours are to be believed, Trump will soon name a nominee for Powell’s successor, even though his term doesn’t end until May 2026. It is not usual for a US president to announce a nomination for the Fed chair so early. But after likely realizing that forcing Powell out of his post could create a constitutional headache for the administration, not to mention a strong backlash by investors, Trump’s best option right now might be to appoint a ‘shadow’ chair.
Are lower yields Trump’s main objective?
It's hard to tell how markets would react to such a move, but presumably, the goal would be to undermine Powell by guiding policy expectations on a different path. If the Fed chair nominee were to signal a lower rate path from the Federal Open Market Committee’s (FOMC) official projections, this could potentially help to bring down Treasury yields.
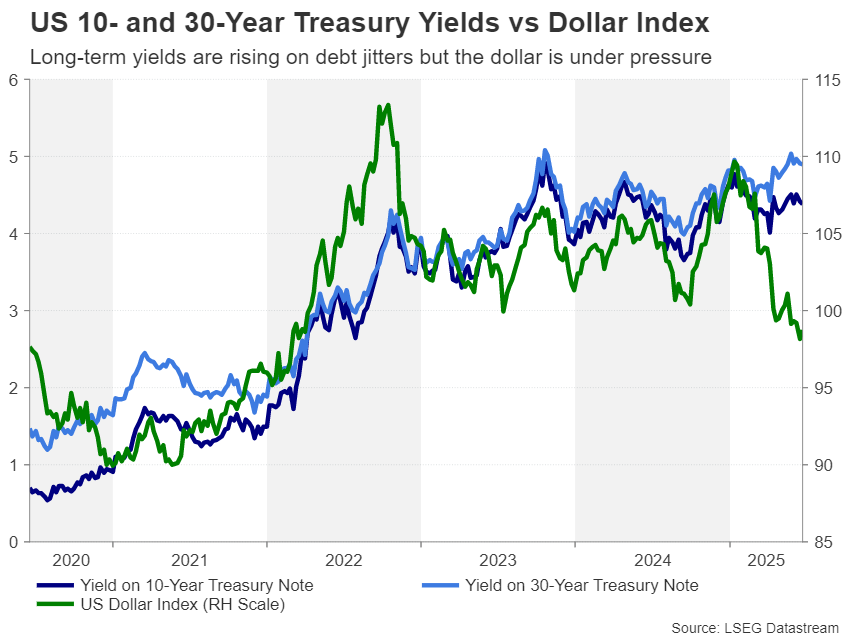
Lower yields, particularly on long-dated Treasuries, could prove crucial for Republicans, who are struggling to agree on big spending reductions as they push through their tax cut agenda, by keeping the cost of debt repayments as low as possible. This is the main frustration that Donald Trump has with Powell, as bond markets have been sending warning signals lately to Capitol Hill to get a grip on the mounting national debt.
However, a substantially more dovish Fed runs the risk of inflaming inflation and inflation expectations, which in turn could push bond yields further up. Therefore, monetary policy that is too loose and not compatible with keeping inflation low can actually lead to higher long-term borrowing costs.
A hawkish turn
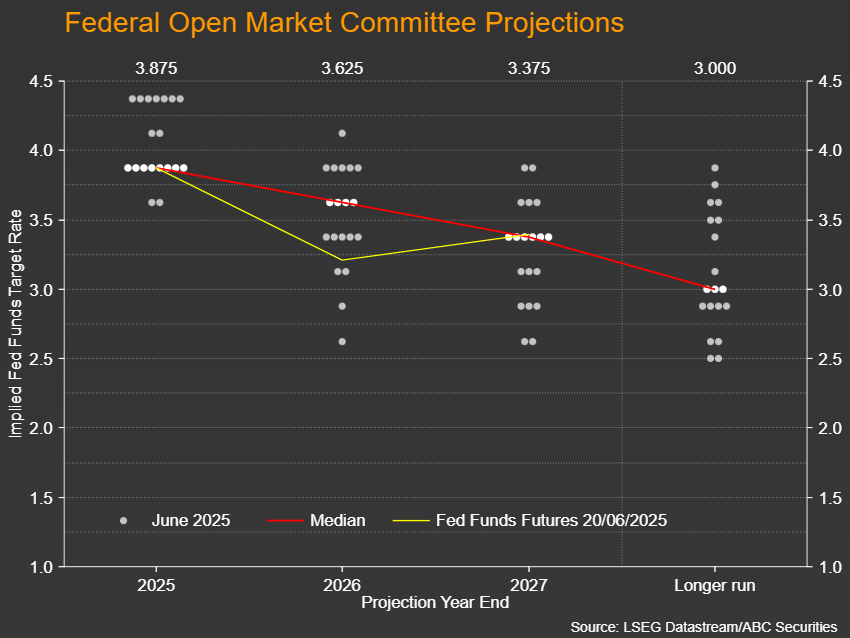
But Trump may be fooling himself in thinking that a different chair would change much when it comes to monetary policy. Whilst the Fed chair can steer policy in a certain direction, it is up to the entire FOMC to vote on policy decisions, and judging by the latest dot plot, it is hard to deny that there’s been a significant hawkish shift at the June meeting compared to March.
A total of 11 FOMC members voted for rate cuts of 50 basis points or more for 2025 at the March meeting, with eight members predicting fewer reductions. But the doves declined slightly to 10 members in June, while the hawks increased to nine, with seven of them preferring to keep rates on hold for the rest of the year. This shift was also evident in the dot plots for 2026 and 2027.
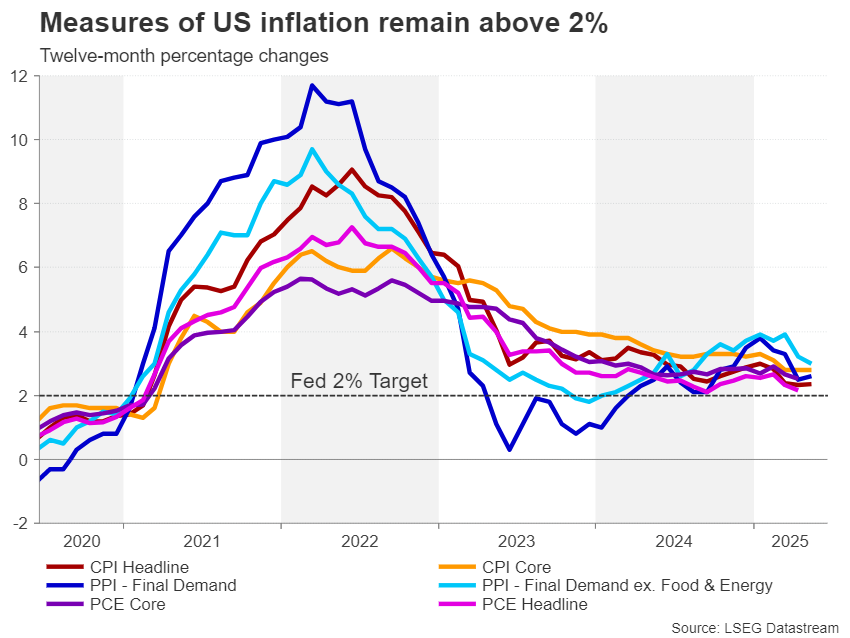
Will there be a summer inflation surge?
Powell was explicit in his post-meeting press briefing in warning that inflation is set to rise during the summer and it appears that many of his colleagues share his concerns. There is a lot of uncertainty as to how much of the higher costs faced by businesses from the tariff hikes will be passed on to the consumer.
Much will depend on what happens on July 9, when the 90-day extension of the reciprocal tariffs expires. If enough trade deals have been agreed by then and Trump decides to offer further extensions to those countries that the US has yet to reach a deal, the Fed is more likely to feel confident that the impact of the tariffs on inflation will be a one-off effect and not hesitate to cut rates on the first sign of trouble in the economy.
Stagflation is the Fed’s worst nightmare
However, if Trump doesn’t get the trade deals he wants and re-imposes some tariffs, policymakers will want to remain on pause for the foreseeable future. The danger here is that if there’s still no agreement with major trading partners like the European Union (EU), Trump is threatening to slap tariffs that are even higher than the original reciprocal levy rates announced on ‘Liberation Day’.
But potentially the bigger problem in this scenario is that the downside risks to the economy would also increase, raising the prospect of stagflation. And this is where real frictions could develop within the FOMC. About half the committee is more worried about the economy, specifically the labour market, which is part of the Fed’s dual mandate, than it is about inflation. While the other half are more concerned in maintaining the Fed’s credibility on inflation.
A balancing act on two fronts
This balancing act is what has put the Fed on pause since the start of 2025. A shadow Fed chair that is more dovish than Powell could tilt the balance in favour of more cuts. However, should the dissent become more visible and louder, this could have a destabilising effect on financial markets, as it would generate significant uncertainty at each meeting as well as knock investor confidence in the Fed’s own forecasts.
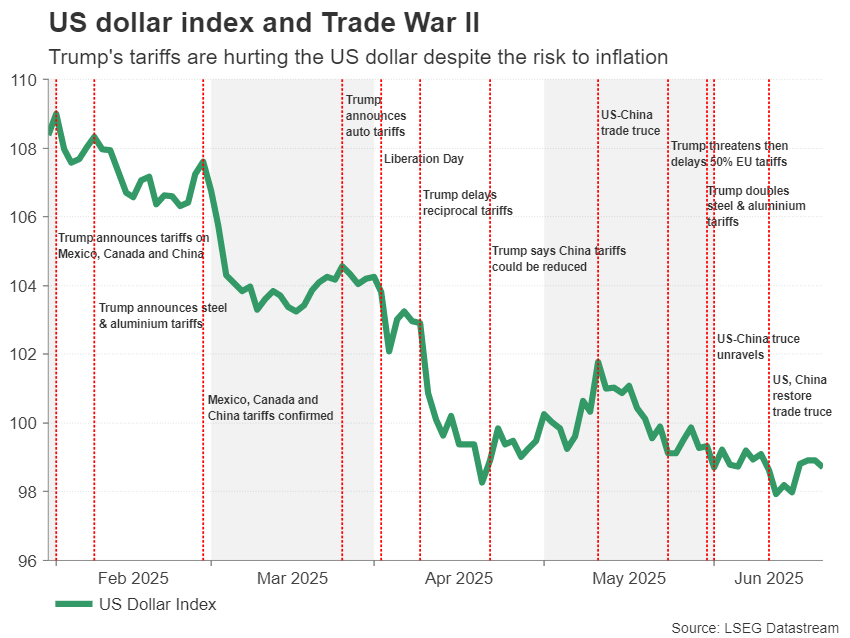
The US dollar has already suffered a heavy blow from Trump’s trade war, losing its shine as the world’s reserve currency. If investors start to lose faith in the Fed too, the dollar’s woes are likely to only worsen, while gold could be the main beneficiary of a fractious Fed and sliding US currency.
Sunset Market Commentary
Markets
Global markets were unable/unwilling to draw firm conclusions from the US joining Israel in attacking Iranian nuclear facilities. The nature/force of the Iranian retaliation now serves as a next event risk for markets. (Asian) equities mostly showed modest losses. Dollar gains initially were rather limited and a spike of Bent oil above $80 p/b soon eased back to the $78 area. European yields initially added 3-4 bps probably as higher oil prices were seen as removing an important factor behind recent mild inflation. Later in the session, markets gradually moved to what in some way looks like a ‘classical risk-off’ positioning, maybe as Israeli attacks on Iran continue. US Treasuries and the dollar (modestly) outperform. US yields in the run-up the US PMI’s are ceding 2.0 -4.0 bps across the curve after opening marginally stronger. German yields also reversed their initial rise, easing between 0.5 bp (2-y) and 2.0 bps (30-y). In this kind of ‘international’ geopolitical uncertainty (with higher oil prices) the dollar and Treasuries apparently still attract some (safe haven?) flows, contrary to what is the case when US trade policy or fiscal sustainability is in focus. This ‘classical’ risk-off move is best illustrated by the moves on FX markets. The dollar gains against the likes of the yen (USD/JPY 147.4 from 146) and the euro (EUR/USD 1.147 after briefly returning north of 1.15 at the start of European dealings). Most smaller, cyclical currencies also suffer against their reference currencies as the case for the likes of the Aussie (0.638), kiwi (0.589) and Canadian dollar (1.379) against their US counterpart. To a lesser extent this also applies for the SEK, (EUR/SEK 11.16), NOK (EUR/NOK 11.67) and CE currencies. EUR/CHF trades little changed near 0.938). The Eurostoxx 50 cedes 0.5%. US indices open marginally softer.
(EMU) PMI’s normally are one of the more timely pointers on the economy, but persistent event risk permanently lowering visibility also causes these indictors lose some of their market relevance. The outcome also didn’t yield any big surprises. The EMU composite index again showed a marginal expansion in business activity (50.2) resulting from a stabilization in services and a modest rise in manufacturing production (51.0). New orders neared stabilization in June after a protracted period of decline. Employment was up marginally, supported by the services sector. The pace of input cost inflation eased for the fourth consecutive month and was softer than the series average. A fall in manufacturing input costs contrasted with continued strong inflation in the service sector and this trend was also visible in selling prices. On the positive side, June saw an improvement in business confidence, with sentiment up to the highest since January. Germany returned to growth (50.4) but France continues to lag (48.5 from 49.3). Overall this still very much looks like a muddling through scenario, with the ECB allowed to take more reactive approach after reducing the policy rate back to neutral (2.0%) early this month.
At the time of finishing this report, the US PMI’s are reported marginally stronger than expected (composite PMÏ 52.8 from 53.0 vs 52.2 expected). Both services (53.1 from 53.7) and manufacturing (52.0 unchanged) indicated ongoing growth. The initial market reaction is limited.
News & Views
UK’s composite June PMI improved from 50.3 to 50.7, suggesting a marginal upturn in business activity which was carried by the services sector (51.3 from 50.9). Manufacturing remained mired in contraction territory but the downturn was less outspoken than in May. Companies reporting a rise in activity referred to improving order books and a partial rebound in client confidence from the April (post-Liberation Day) low point. Global trade tensions and rising geopolitical uncertainty were mentioned as headwinds, in particular by the manufacturing industry. New business intakes across the economy rose, be it fractionally, for the first time since November 2024. Export orders decreased for the eight month running, but those for the goods sector did so at the slowest pace in five months. Employment decreased again and faster than in May on strong cost pressures and subdued demand conditions. Input price pressures subsided in June, especially in the services economy, resulting in the softest rise of output charges since January 2021. Business expectations for the year ahead drifted down from May’s six-month high on elevated global economic and political uncertainty. The PMIs for all of Q2 suggest GDP rising at a mere 0.1% q/q. The pound erased earlier, though minor gains to trade slightly weaker on the day. EUR/GBP trades around 0.8565.
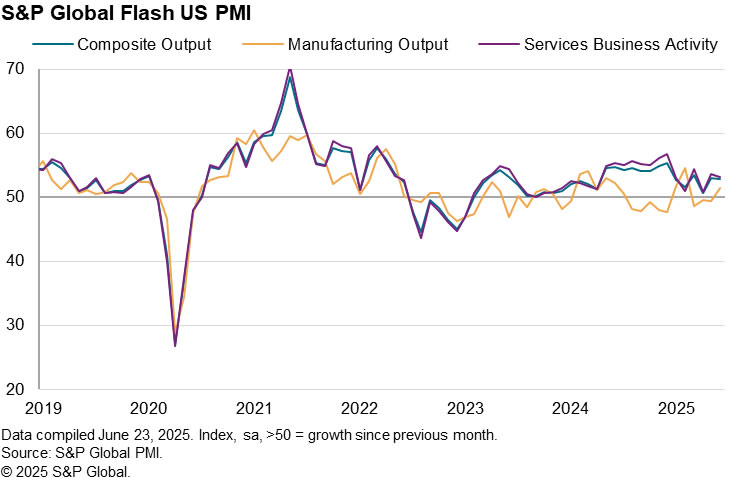
US PMI composite rises to 53.0, resilient growth but inflation surge raises Fed caution
US PMI Composite dipped slightly from 53.0 to 52.8, as PMI Services slipped to 53.1 from 53.7, offsetting a steady Manufacturing reading at 52.0. S&P Global’s Chris Williamson noted that while activity and new orders remained in positive territory, falling exports and heightened uncertainty—particularly around inflation—are starting to weigh on business sentiment.
Williamson pointed to stockpiling activity, especially in manufacturing, as a temporary support to demand, likely driven by concerns over tariffs and future supply disruptions. However, this inventory-driven boost could fade quickly, particularly if cost pressures remain elevated and begin to weigh on broader consumption.
A notable concern is that "inflationary pressures have risen sharply" in the past two months. Goods prices have risen at their fastest pace in three years. Service providers are also feeling the pinch, with food and input-related inflation filtering into final prices.
"The data therefore corroborate speculation that the Fed will remain on hold for some time to both gauge the economy’s resilience and how long this current bout of inflation lasts for," Williamson added.
ECB’s Lagarde sees near-term weakness, but also resilience ahead
ECB President Christine Lagarde acknowledged in a speech that Eurozone faces "weaker prospects" in the near term. Survey data suggest slowing momentum, with higher tariffs and a stronger Euro expected to weigh on exports. Elevated uncertainty is also delaying corporate investment. Risks remain "tilted to the downside", with trade tensions, fragile market sentiment, and geopolitical instability posing ongoing threats to the outlook.
Still, Lagarde emphasized several sources of resilience. A strong labor market, rising real incomes, and robust private sector balance sheets are expected to support consumption. Recent rate cuts are also contributing to easier financing conditions, while increased spending on defence and infrastructure could help offset external headwinds.
"A swift resolution to trade and geopolitical tensions or a further increase in defence and infrastructure spending could spur activity by more than expected," Lagarde said.
On inflation, Lagarde noted the outlook is “more uncertain than usual.” Trade frictions are creating both upward and downward pressures—supply chain fragmentation could lift prices, while weaker global demand may suppress Eurozone export growth.