Sample Category Title
Eurozone PMI composite unchanged at 50.2, inflation risk contained for ECB
Eurozone flash PMIs offered little cause for celebration in June, as the economy continued to tread water. PMI Composite held steady at 50.2. PMI Manufacturing was unchanged in contraction at 49.4. Services ticked back from 49.7 to the 50.0 mark, barely returning to expansion.
According to Hamburg Commercial Bank’s Cyrus de la Rubia, the bloc is “struggling to gain momentum,” with both manufacturing and services showing only marginal progress. Germany showed faint signs of improvement, but France continues to act as a drag. Still, firms remain cautiously optimistic: employment has been broadly stable, and expectations have improved modestly according to the survey.
For ECB, while services inflation remains “slightly tense” due to sticky input costs, this is counterbalanced by disinflation in goods and the dampening effects of a strong Euro and US tariffs. Energy prices—now rebounding due to Middle East tensions—could become a concern, though much of the impact is not yet captured in the current PMI readings.

GBP/USD Dips Below Support, USD/CAD Breaks Higher
GBP/USD started a fresh decline below the 1.3620 zone. USD/CAD is rising and might aim for more gains above the 1.3765 resistance.
Important Takeaways for GBP/USD and USD/CAD Analysis Today
- The British Pound started another decline from the 1.3620 resistance zone.
- There was a break below a connecting bullish trend line with support at 1.3460 on the hourly chart of GBP/USD at FXOpen.
- USD/CAD is showing positive signs above the 1.3720 support zone.
- There is a key bullish trend line forming with support at 1.3740 on the hourly chart at FXOpen.
GBP/USD Technical Analysis
On the hourly chart of GBP/USD at FXOpen, the pair struggled to continue higher above the 1.3620 resistance zone. The British Pound started a fresh decline and traded below the 1.3550 support zone against the US Dollar, as discussed in the previous analysis.
The pair even traded below 1.3500 and the 50-hour simple moving average. Finally, the bulls appeared near the 1.3380 level. There was a recovery wave above the 1.3450 level and the 23.6% Fib retracement level of the downward move from the 1.3622 swing high to the 1.3382 low.
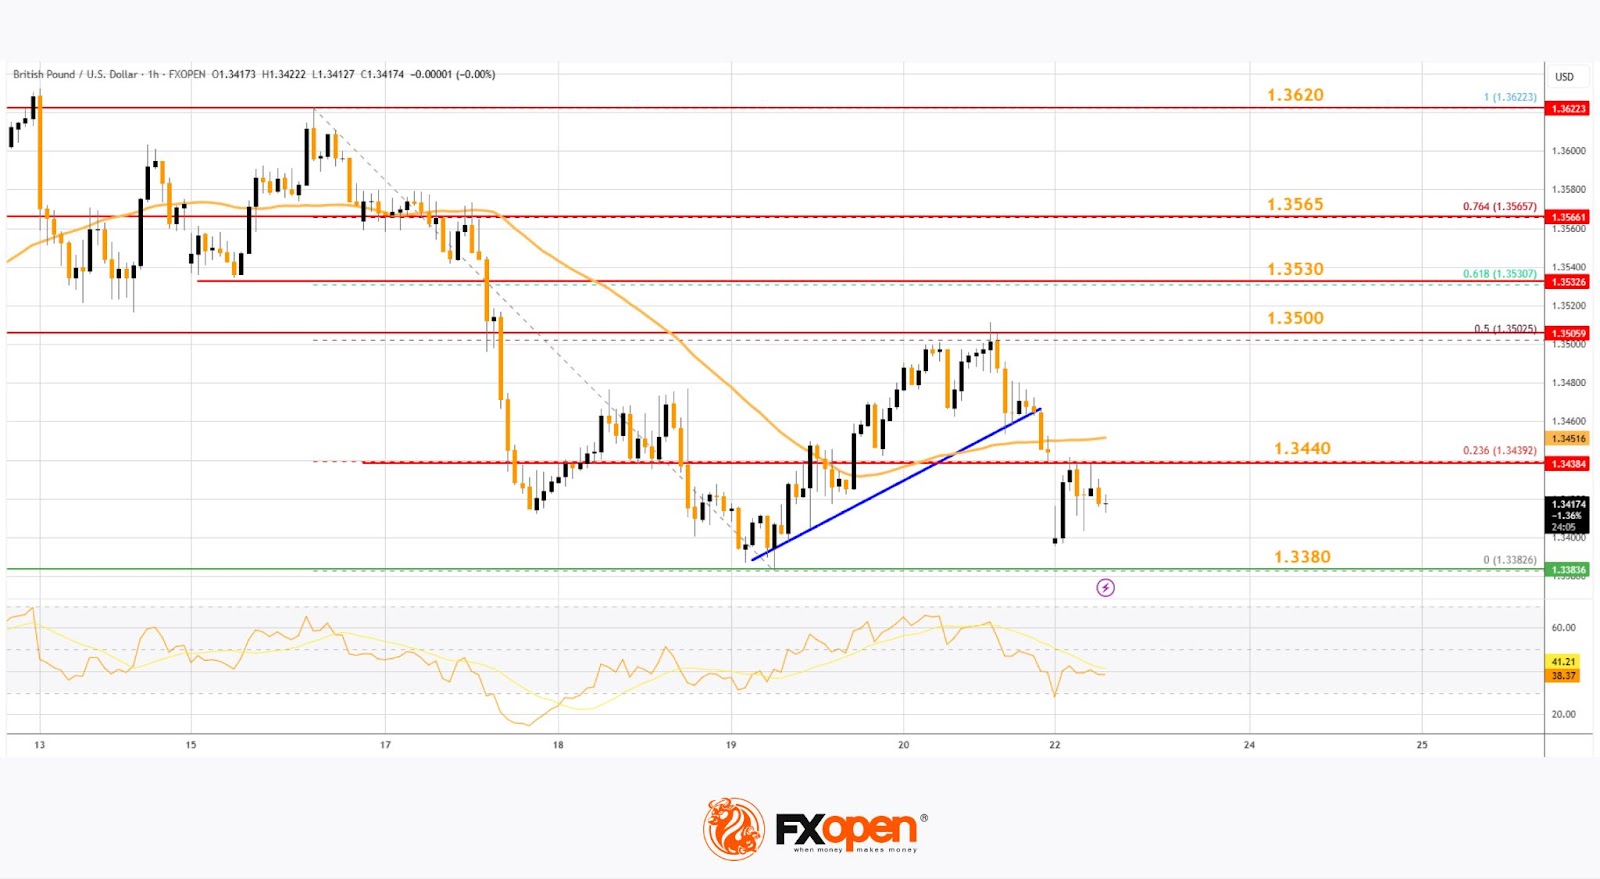
However, the bears were active near the 1.3500 zone and the 50% Fib retracement level. As a result, there was a fresh bearish reaction below a connecting bullish trend line with support at 1.3460.
Initial support on the GBP/USD chart sits at 1.3380. The next major support is at 1.3350, below which there is a risk of another sharp decline. In the stated case, the pair could drop toward 1.3200.
Immediate resistance on the upside is near 1.3440. The first major resistance is near the 1.3500 zone. The main hurdle sits at 1.3530. A close above the 1.3530 resistance might spark a steady upward move. The next major resistance is near the 1.3565 zone. Any more gains could lead the pair toward the 1.3620 resistance in the near term.
USD/CAD Technical Analysis
On the hourly chart of USD/CAD at FXOpen, the pair formed a strong support base above the 1.3540 level. The US Dollar started a fresh increase above the 1.3600 resistance against the Canadian Dollar.
The bulls pushed the pair above the 1.3640 and 1.3700 levels. The pair cleared the 50-hour simple moving average and climbed above 1.3750. A high was formed at 1.3766 and the pair is now consolidating.
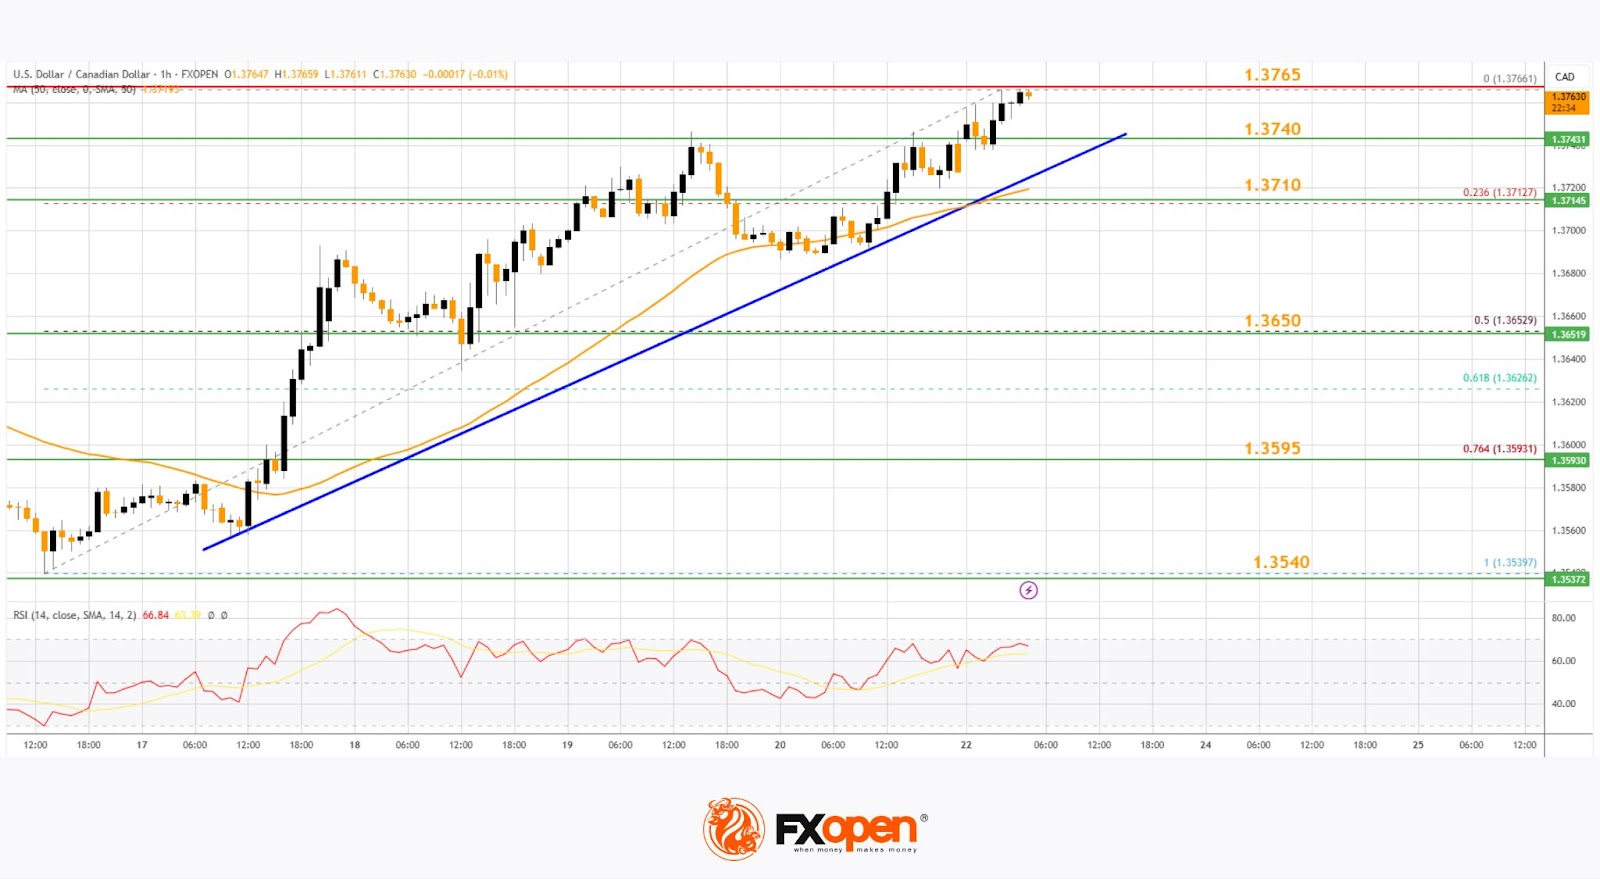
Initial support is near the 1.3740 level. There is also a key bullish trend line forming with support at 1.3740. The next major support is near the 1.3710 level or the 23.6% Fib retracement level of the upward move from the 1.3539 swing low to the 1.3766 high.
The main support sits near the 1.3650 zone on the USD/CAD chart. It is near the 50% Fib retracement level.
A downside break below the 1.3650 level could push the pair further lower. The next major support is near the 1.3595 support zone, below which the pair might visit 1.3540.
If there is another increase, the pair might face resistance near the 1.3765 level. A clear upside break above 1.3765 could start another steady increase. The next major resistance is the 1.3800 level. A close above the 1.3800 level might send the pair toward the 1.3880 level. Any more gains could open the doors for a test of the 1.4000 level.
Trade over 50 forex markets 24 hours a day with FXOpen. Take advantage of low commissions, deep liquidity, and spreads from 0.0 pips. Open your FXOpen account now or learn more about trading forex with FXOpen.
This article represents the opinion of the Companies operating under the FXOpen brand only. It is not to be construed as an offer, solicitation, or recommendation with respect to products and services provided by the Companies operating under the FXOpen brand, nor is it to be considered financial advice.
Oil Price Surges at Monday Open Amid US Strikes on Iran
As shown on the XBR/USD chart, the Brent crude oil price formed a bullish gap at the opening of financial markets this Monday, surpassing last week’s high.
Only three days ago, we drew attention to Donald Trump’s statement that a decision regarding US involvement in the Iran-Israel conflict would be made within two weeks – yet over the weekend, US aircraft dropped bombs on Iran’s nuclear facilities.
Now oil prices are likely to be affected by Iran’s potential move to block shipping traffic through the Strait of Hormuz. According to Reuters, analysts suggest that in such a scenario, the oil price could climb to $100.
Technical Analysis of the XBR/USD Chart
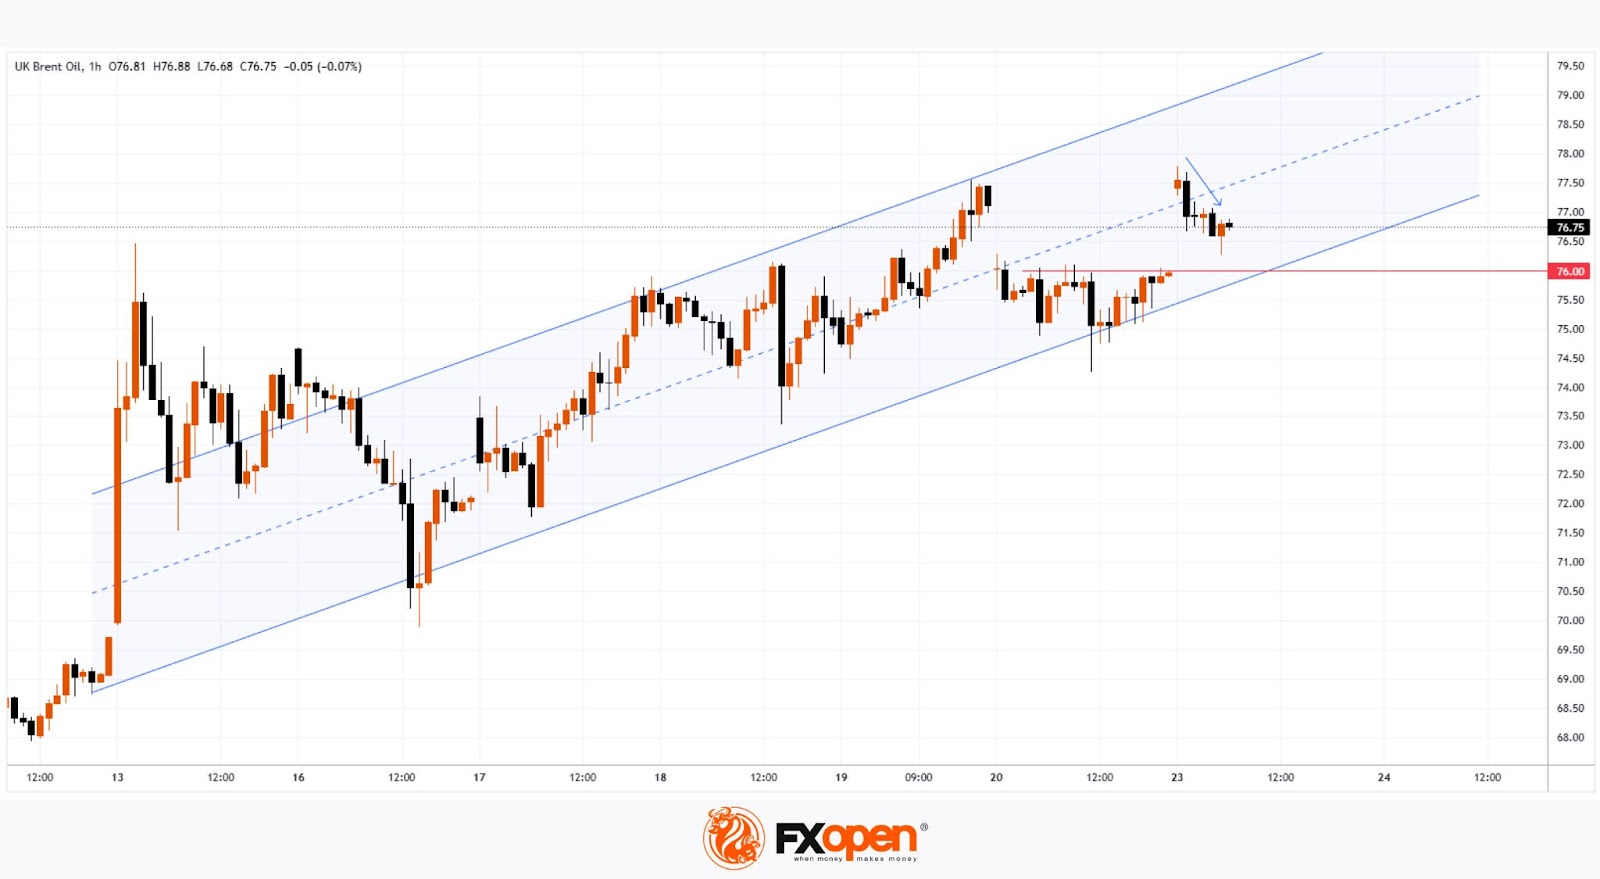
The ascending channel plotted last week remains valid.
The fact that the price is pulling back (as indicated by the arrow) from the high set at the market open suggests the market had already priced in a significant risk of US involvement in the Iran-Israel military conflict.
Key points:
→ Technical support in the near term may be provided by the area where the lower boundary of the blue channel intersects with the $76 level (which acted as resistance at the end of last week).
→ Ultimately, fundamental factors and official statements will play a decisive role in oil price movements. It’s worth noting that, following the strikes on its territory, Iran is threatening retaliation against the US.
Start trading commodity CFDs with tight spreads. Open your trading account now or learn more about trading commodity CFDs with FXOpen.
This article represents the opinion of the Companies operating under the FXOpen brand only. It is not to be construed as an offer, solicitation, or recommendation with respect to products and services provided by the Companies operating under the FXOpen brand, nor is it to be considered financial advice.
Bitcoin Price Tests $100k Level for Resilience
The Israeli attack on Iran on 13 June, followed by retaliatory strikes and belligerent rhetoric from officials, has acted as a bearish driver for the cryptocurrency market. US bomber strikes on Iran over the weekend further worsened the situation for coin holders.
Over the weekend, the price of Bitcoin fell by around 10% from its early June peak, reaching its lowest point in one and a half months. Other cryptocurrencies displayed even stronger bearish momentum on their charts.
Amid rising geopolitical tensions and the prospect of prolonged US involvement in a Middle Eastern conflict, the US dollar has traditionally strengthened – which has also put pressure on the BTC/USD rate.
As a result, the Bitcoin price briefly dipped below the key psychological level of $100k but has since rebounded, effectively testing this level’s strength. How might events unfold from here?
Technical Analysis of the BTC/USD Chart
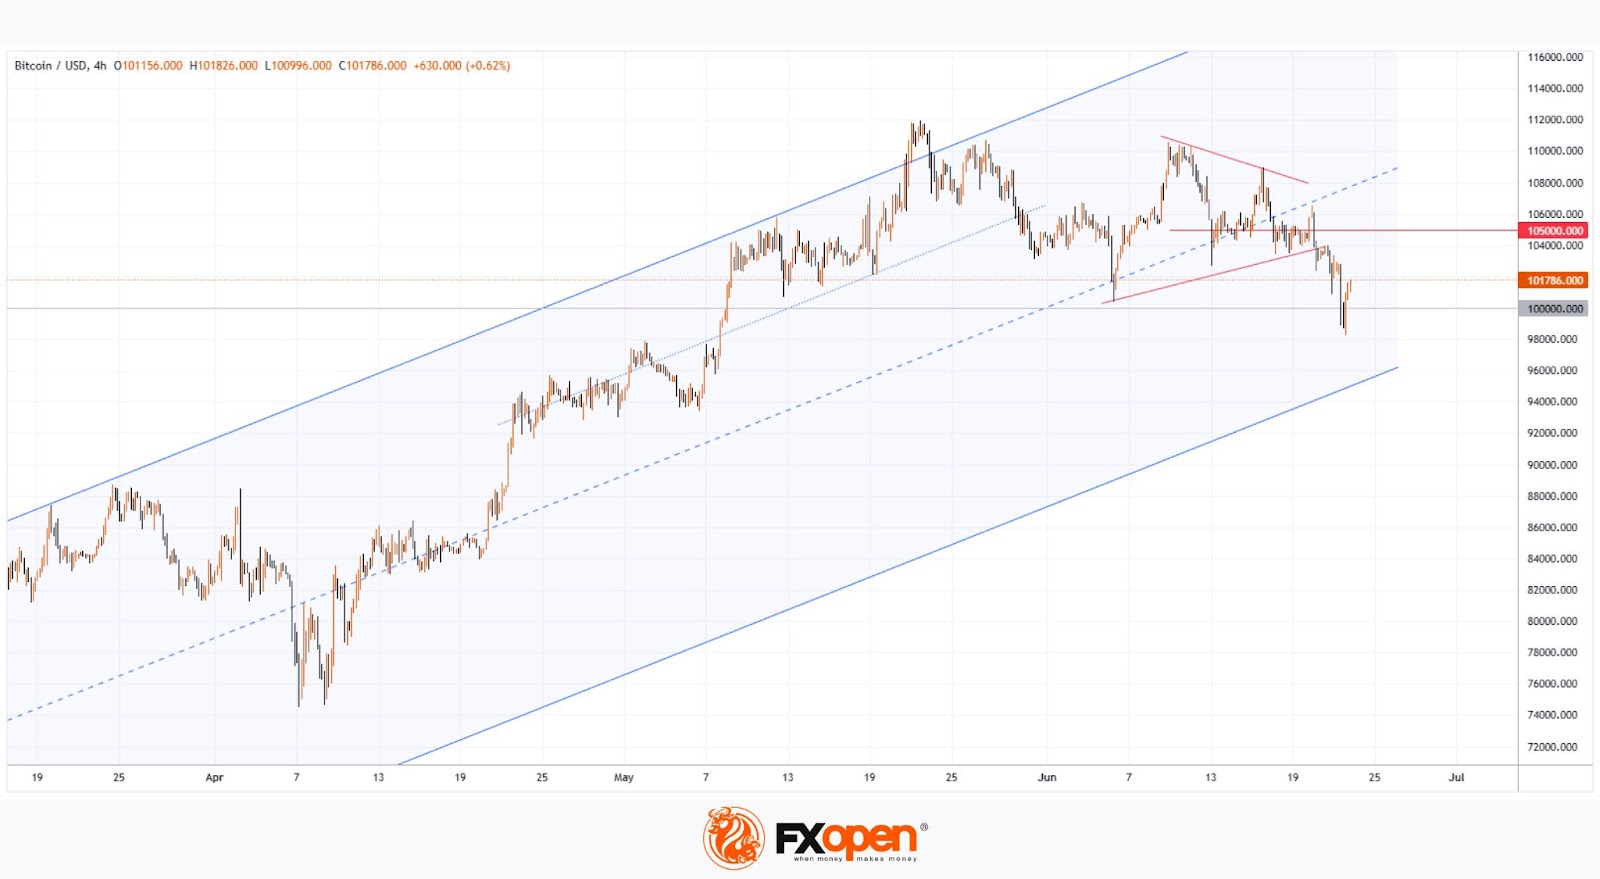
The chart shows that Bitcoin’s price movements have formed an ascending channel (marked in blue). In mid-June, a contracting triangle pattern (marked in red) appeared around the channel’s median line – this can be interpreted as a sign of balance and agreement between buyers and sellers near the $105k level.
However, that balance has now been disrupted, with the bulls retreating. It is reasonable to assume that the $103k level, where the bears broke through the lower boundary of the red triangle, will act as resistance going forward.
Should the military conflict in the Middle East escalate, another bearish assault on the psychological $100k mark on the BTC/USD chart is not out of the question – for now, it appears to be holding as a strong support level.
FXOpen offers the world's most popular cryptocurrency CFDs*, including Bitcoin and Ethereum. Floating spreads, 1:2 leverage — at your service. Open your trading account now or learn more about crypto CFD trading with FXOpen.
*Important: At FXOpen UK, Cryptocurrency trading via CFDs is only available to our Professional clients. They are not available for trading by Retail clients. To find out more information about how this may affect you, please get in touch with our team.
This article represents the opinion of the Companies operating under the FXOpen brand only. It is not to be construed as an offer, solicitation, or recommendation with respect to products and services provided by the Companies operating under the FXOpen brand, nor is it to be considered financial advice.
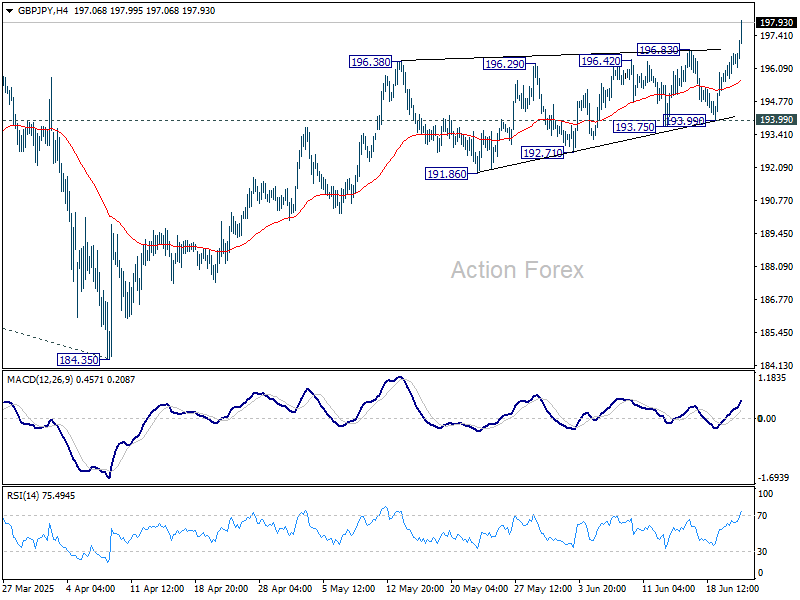
GBP/JPY Daily Outlook
Daily Pivots: (S1) 195.72; (P) 196.21; (R1) 196.96; More...
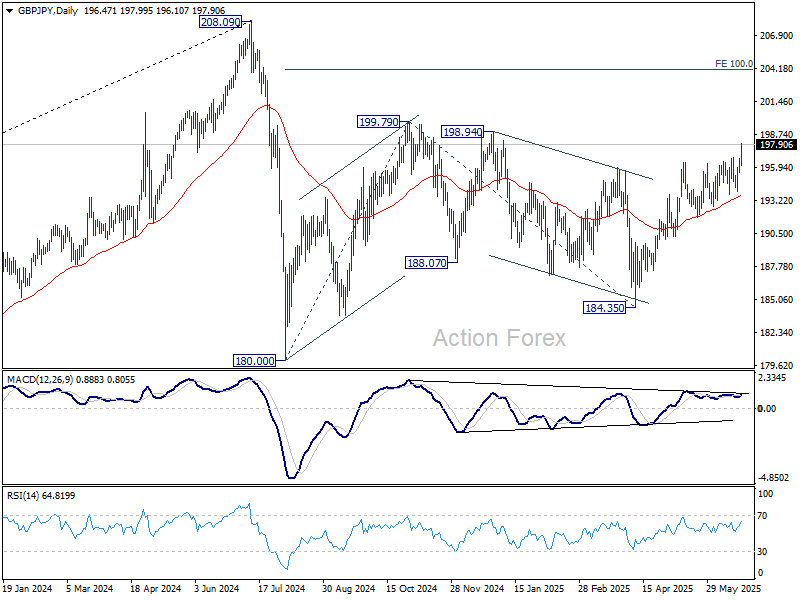
GBP/JPY's rise from 184.35 resumed by breaking through 196.83 today and intraday bias is back on the upside for 199.79 resistance. Break there will target 100% projection of 180.00 to 199.79 from 184.35 at 204.14. For now, near term outlook will stay bullish as long as 193.99 support holds, in case of retreat.
In the bigger picture, price actions from 208.09 are seen as a correction to rally from 123.94 (2020 low). Strong support should be seen from 38.2% retracement of 123.94 to 208.09 at 175.94 to contain downside. However, sustained break of 175.94 will bring deeper fall even still as a correction.
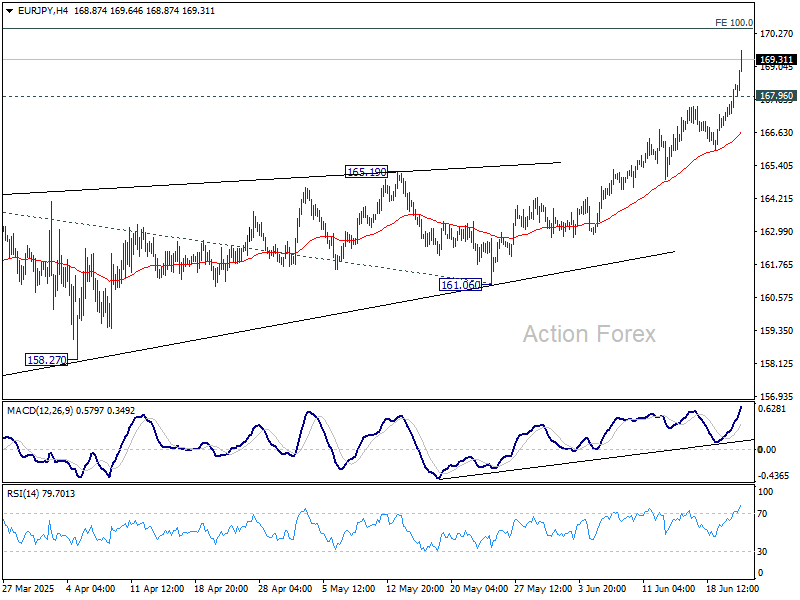
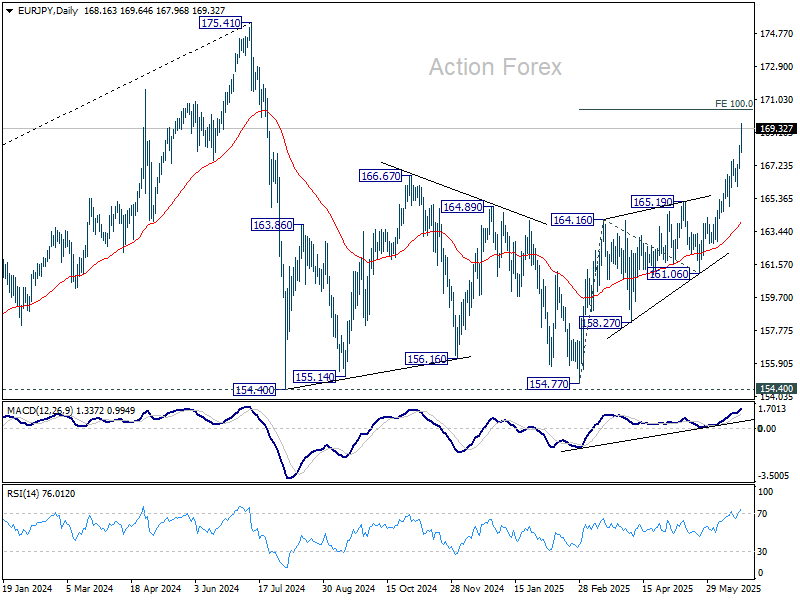
EUR/JPY Daily Outlook
Daily Pivots: (S1) 167.48; (P) 167.94; (R1) 168.80; More...
EUR/JPY's rally accelerates further today and intraday bias stays on the upside. Next target is 100% projection of 154.77 to 165.19 from 161.06 at 170.45. On the downside, below 167.96 minor support will turn intraday bias neutral and bring consolidations. But outlook will remain bullish as long as 165.19 resistance turned support holds, in case of retreat.
In the bigger picture, price actions from 175.41 are seen as correction to up trend from 114.42 (2020 low). Strong support should be seen from 38.2% retracement of 114.42 to 175.41 at 152.11 to contain downside. However, sustained break of 152.11 will bring deeper fall even still as a correction.
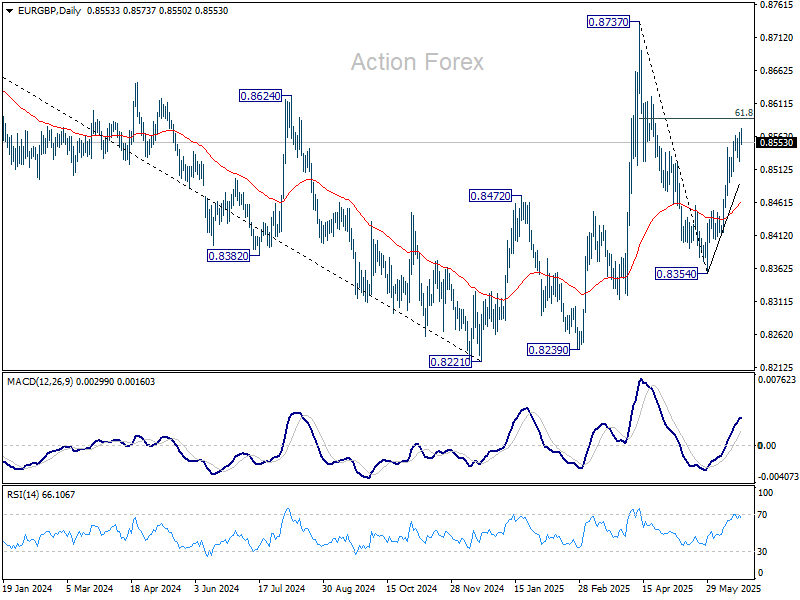
EUR/GBP Daily Outlook
Daily Pivots: (S1) 0.8538; (P) 0.8553; (R1) 0.8581; More...
Intraday bias in EUR/GBP remains on the upside as rise from 0.8354 is in progress for 61.8% retracement of 0.8737 to 0.8354 at 0.8591. Firm break there will pave the way to 0.8373 resistance. On the downside, below 0.8524 minor support will turn intraday bias neutral again.
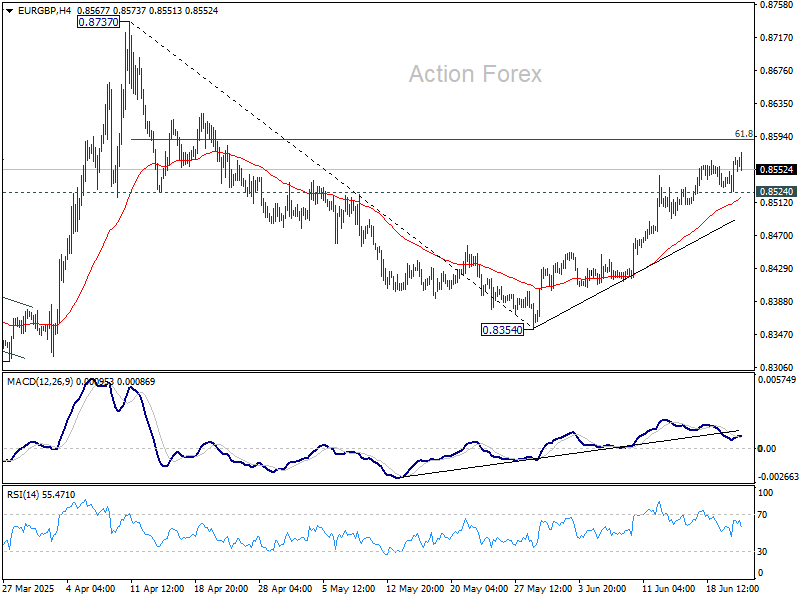
In the bigger picture, price actions from 0.8221 medium term bottom are merely forming a corrective pattern to the down trend from 0.9267 (2022 high). Nevertheless, there is no clear momentum to break through 0.8201 key support (2022 low) yet. Hence, range trading is expected between 0.8221/8737 for now.
EUR/AUD Daily Outlook
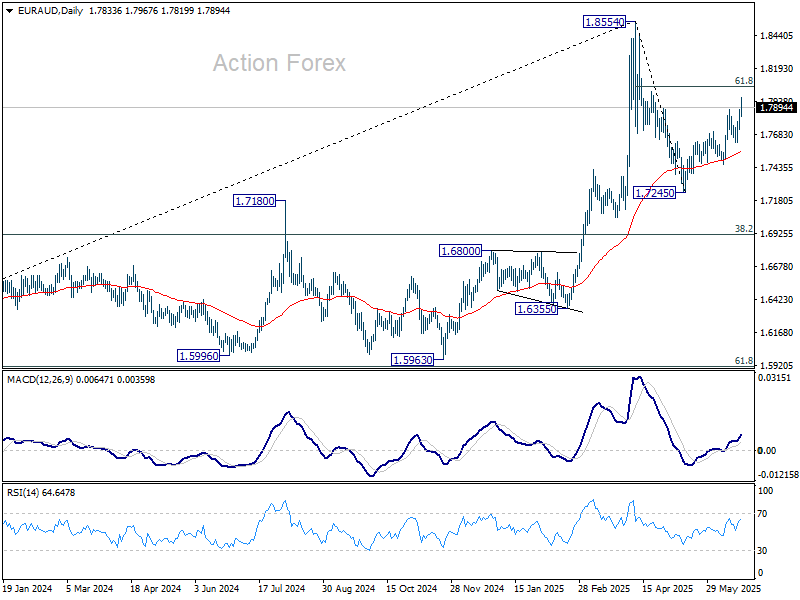
Daily Pivots: (S1) 1.7769; (P) 1.7825; (R1) 1.7921; More...
EUR/AUD's rise from 1.7245 resumed by breaking through 1.7880 and intraday bias is back on the upside. Next target is 61.8% retracement of 1.8554 to 1.7245 at 1.8054. Firm break there will pave the way to 1.8554. For now, further rally is expected as long as 1.7626 support holds, in case of retreat.
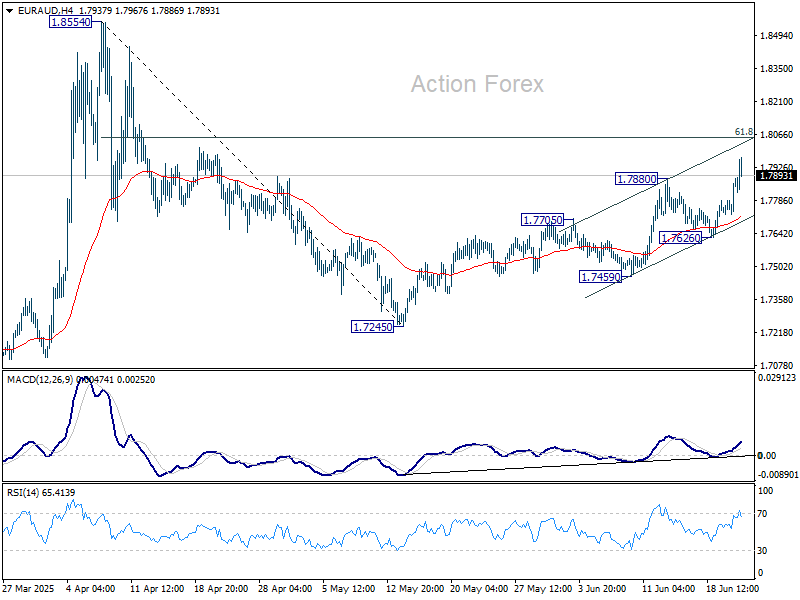
In the bigger picture, price actions from 1.8554 medium term are currently seen as a corrective pattern. While deeper pullback might be seen, downside should be contained by 38.2% retracement of 1.4281 (2022 low) to 1.8554 at 1.6922 to bring rebound. Up trend from 1.4281 is expected to resume at a later stage.
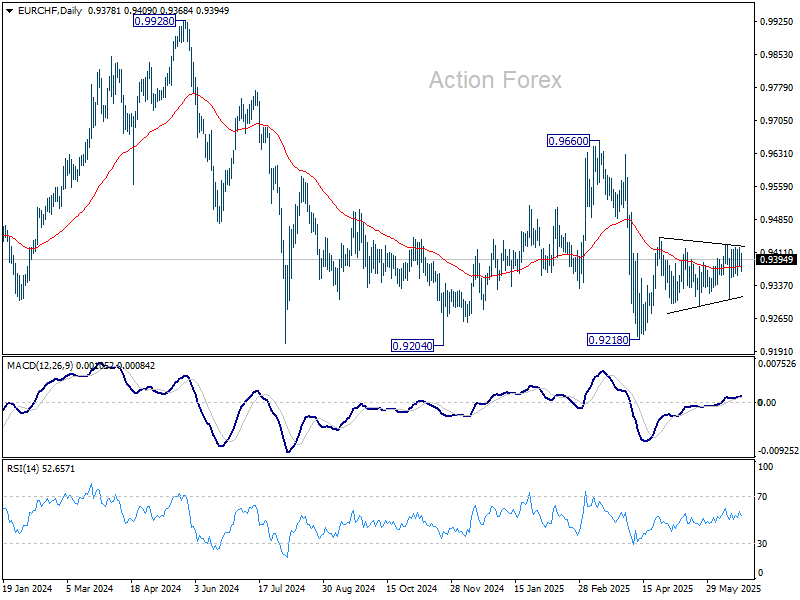
EUR/CHF Daily Outlook
Daily Pivots: (S1) 0.9392; (P) 0.9411; (R1) 0.9444; More....
Intraday bias in EUR/CHF remains neutral as range trading continues. On the upside, break of 0.9428/45 resistance zone will resume the rebound from 0.9218. On the downside, break of 0.9291 will bring retest of 0.9218 low instead.
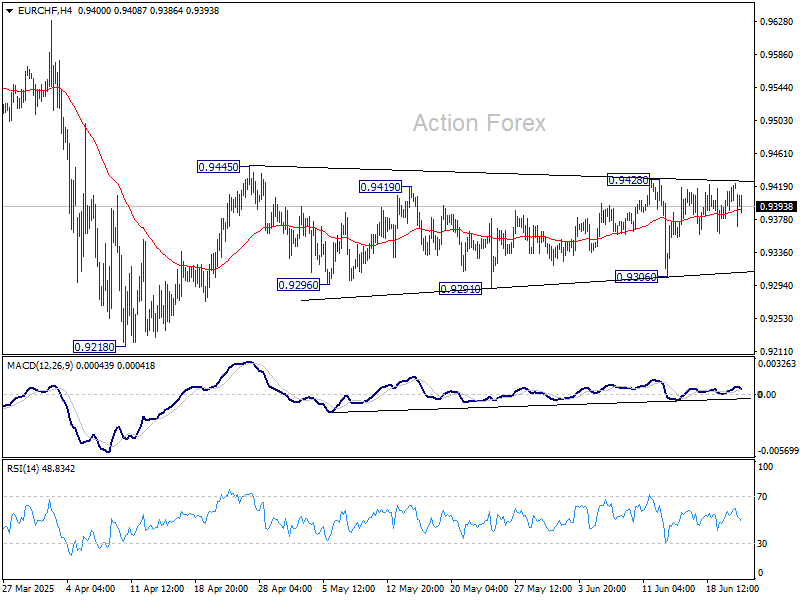
In the bigger picture, prior rejection by long-term falling channel resistance (now at 0.9511) retains medium term bearishness. That is, down trend from 1.2004 (2018 high) is still in progress. Firm break of 0.9204 (2024 low) will confirm resumption. This will remain the favored case as long as 0.9660 resistance holds.
EUR/USD Daily Outlook
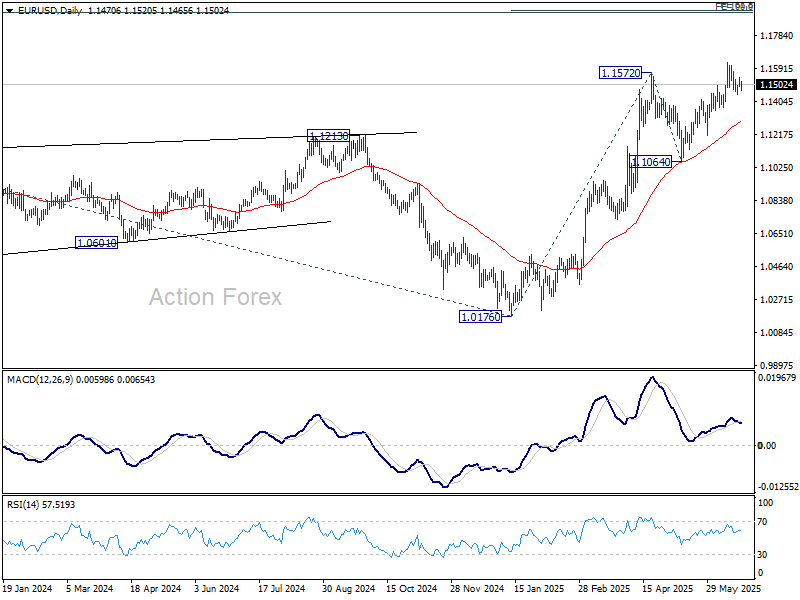
Daily Pivots: (S1) 1.1492; (P) 1.1518; (R1) 1.1548; More...
EUR/USD is staying in consolidations below 1.1630 and intraday bias remains neutral. With 1.1372 support intact, further rally is expected. Break of 1.1572 will extend the rise from 1.0176. Next target is 61.8% projection of 1.0176 to 1.1572 from 1.1064 at 1.1927. However, break of 1.1372 support will indicate short term topping, and turn bias to the downside for deeper pullback.
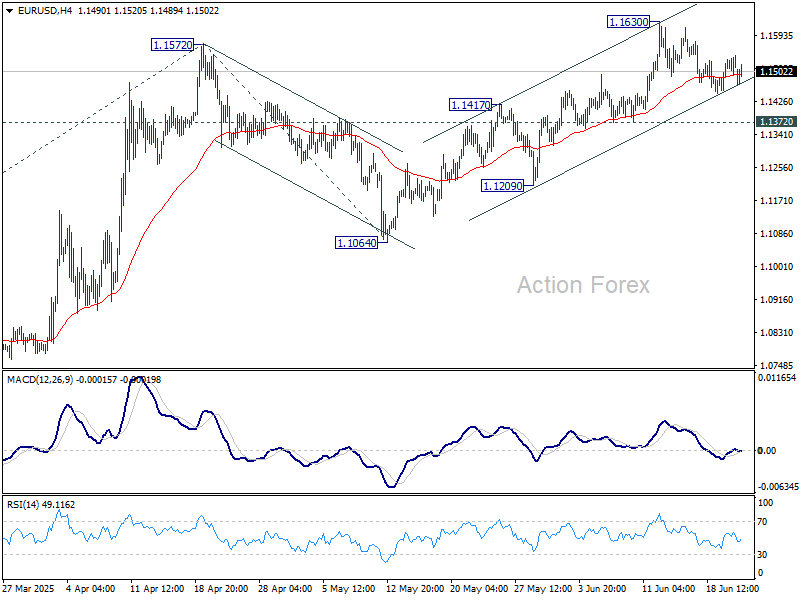
In the bigger picture, rise from 0.9534 long term bottom could be correcting the multi-decade downtrend or the start of a long term up trend. In either case, further rise should be seen to 100% projection of 0.9534 to 1.1274 from 1.0176 at 1.1916. This will now remain the favored case as long as 1.1604 support holds.