

Sample Category Title
Eco Data 4/2/19
[php_everywhere instance="1"]
U.S. Manufacturing Activity Accelerates in March
The Institute for Supply Management (ISM) manufacturing index improved by 1.1 points to 55.3 in March. This is a better outturn than the consensus view of a roughly flat print.
Three of the five subcomponents that comprise the headline index improved in March. Employment led the way higher, surging 5.2 points to 57.5. New orders rose by +1.9 points to 57.4, and production gained one point to hit 55.8. Inventories (-1.6 points to 51.8) and supplier deliveries (-0.7 to 54.2) were the only two components of the headline index that decelerated in March.
After firming somewhat in prior months, the trade components of the report weakened in March. New export orders dropped 1.1 points to 51.7, and import orders shed 4.2 points, dropping to 51.1 – the lowest level observed since January 2017.
Prices paid rose 4.9 points to 54.3, accelerating for the first time since last October. We caution that large price moves are not unusual, given volatile commodity prices and the fact that the index is not seasonally adjusted. Since November, reduced price pressures have reflected declines in the price of aluminum and steel products (prices have now normalized near pre-tariff levels), and crude oil/gas.
Sixteen of eighteen manufacturing industries reported growth in March, unchanged from February. Apparel, leather, and allied products, and paper products were the only two industries that reported a contraction in March.
Key Implications
Today's report suggests that U.S. manufacturing activity remains firmly in expansion mode. Its resilience is remarkable given months of slumping manufacturing activity elsewhere. Although activity has decelerated from last summer's highs, the details in today's report are supportive of ongoing health in the months ahead. The rebound in new orders and production suggest that February's pullback may have been due to temporary factors such as inclement weather. That said, survey respondents pointed to weather as a factor that continued to hamper activity in March, particularly in homebuilding and related industries. Aside from some concerns about Brexit and the progress of U.S. trade negotiations with China, the general mood of respondents remains optimistic. Although electronic component shortages are easing, a shortage of skilled labor has returned as a concern in some industries.
In other good news, this morning's Markit PMI manufacturing surveys suggest that the global manufacturing slump may be bottoming out. China's manufacturing sector registered an expansion for the first time in four months as easier financing and positive progress on U.S. trade talks helped improve sentiment in March. Similar improvements were recorded in ASEAN economies (Thailand, Myanmar, Indonesia, Vietnam) as altogether the region returned to expansion. While emerging market economies registered improvements, Japan, Korea, and the Euro Area continued to record a contraction in manufacturing activity in March. All told, beginning in the second quarter of 2019 we anticipate that a gradual recovery in advanced economies, in combination with a sustained improvement in emerging market economies, should lift global economic activity up from its three quarter slump.
MARKET WRAP: European Markets Closed On A Strong Note
Despite the weak economic data out of Europe, traders pushed the European markets higher.
Stocks
- The S&P 500 Index jumped 0.79 percent as of 16:00 London time, while the Nasdaq Composite Index rose 0.86 percent and the Dow Jones Industrial Average increased 0.9 percent.
- The Stoxx Europe 600 gained 1.09 percent.
- The MSCI Emerging Market Index scored 1 percent.
Currencies
- The Dollar Spot Index dropped 0.09 percent, breaking its five consecutive trading days rally.
- The euro jumped 0.3 percent to $1.1220 despite the weak eurozone economic data
- The British pound jumped 0.87 percent to $1.3149 ahead of the key Brexit vote.
Bonds
- The yield on 10-year Treasuries jumped three basis points to 2.47 percent.
- Germany’s 10-year yield scored two basis points to negative 0.05 percent.
- Britain’s 10-year yield rose almost one basis point to 1.01 percent.
Commodities
- West Texas Intermediate increased 1.1 percent to $60.95 a barrel.
- Gold still below 1300 mark but gained 0.3 percent to $1,296 an ounce.
Elliott Wave: GBP/USD In A Three-Wave Recovery
GBPUSD is nicely recovering from the 1.300 support zone, where a higher degree wave 4) correction found its base. Current sharp rally we now labelled as sub-wave A of a three-wave recovery which may unfold within higher degree wave 5). In this case wave 5) is expected to unfold three (A-B-C) waves, because we are observing an EW ending diagonal of a higher degree on higher time frame charts. As we know an EW ending diagonal has a 3-3-3-3-3 structure. That said, possible resistance for sub-wave A of 5) can be seen around the 1.315/1.319 zone.
GBPUSD, 1h
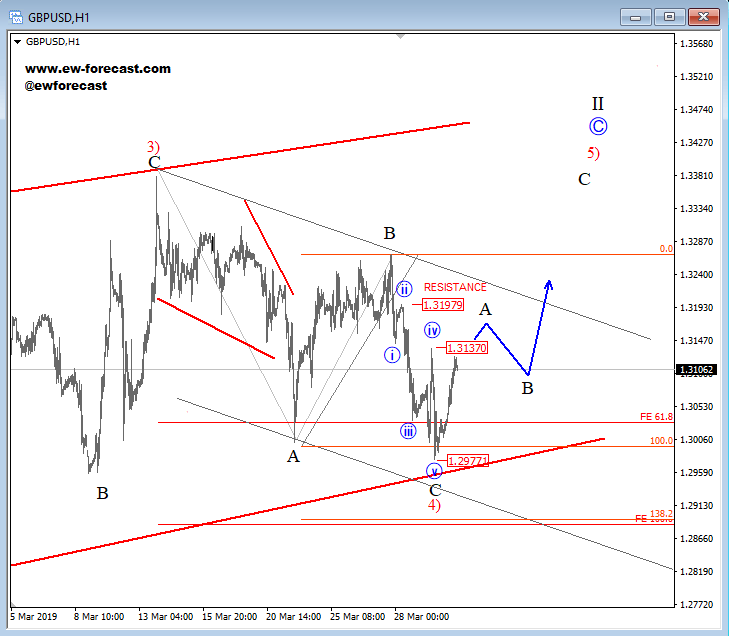
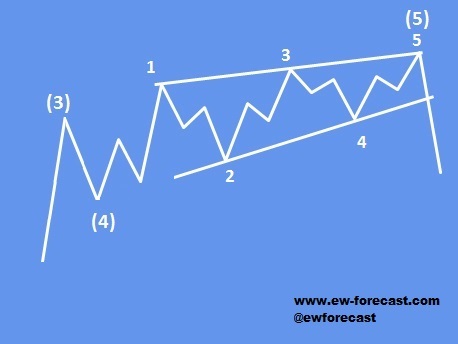
An ending diagonal is a special type of pattern that occurs at times when the preceding move has gone too far too fast, as Elliott put it. A very small percentage of ending diagonals appear in the C wave position of A-B- C formations. In double or triple threes, they appear only as the final “C” wave. In all cases, they are found at the termination points of larger patterns, indicating exhaustion of the larger movement.
- structure is 3-3-3-3-3
- a wedge shape within two converging lines
- wave 4 must trade into a territory of a wave 1
- appears primarily in the fifth wave position, in the C wave position of A-B- C and in double or triple threes as the final “C” wave
Ending diagonal pattern:
Recession Update: Should We Worry?
"Success is a journey, not a destination. The doing is often more important than the outcome." – Arthur Ashe
Executive Summary
The yield on the 10-year Treasury fell below the effective federal funds rate last week, resulting in an inversion of the yield curve. The recent inversion has brought heightened market sensitivity of an imminent recession and has caused analysts to question the reliability of the yield curve as a reliable recession predictor. We updated our models to estimate potential risks of a recession in the short-term (next six months) as well as in the medium-term (next couple of years). Our preferred Probit model suggests a low probability of a recession in the next six months (about 7%). The ordered Probit model—which predicts the probability of a recession as well as the strength of a recovery/expansion—shows a low possibility of a recession and trend-like growth for the first half of 2019. Essentially, according to both models there's little recession risk for the short-term.
In 2017, we developed a new framework to predict recessions up to two years ahead. The predictive power of our framework is significantly greater than yield curve inversion.1 Since 1954, our proposed method predicted all recessions, while the inverted yield curve failed to predict the recessions during 1954-1965. The proposed framework identifies a threshold between the fed funds rate and the 10-year Treasury yield. When the threshold is breached, the risk of a recession increases.
Most of our models suggest minimal short-term recession risk. Although, the yield curve Probit model estimates a 21% probability of a recession, it remains well below the historical threshold. The yield curve would need to invert significantly and remain inverted for weeks, if not months, before it would be a reliable recession signal. The yield curve inverted for at least six consecutive months prior to the past three recessions. Therefore, the probability of a recession remains low, in our view.
To predict recessions, the new framework of our model depends on interest rate hikes. The Federal Open Market Committee (FOMC) remained dovish at its March 20 meeting, as a majority of voting members predicted that the FOMC would keep rates on hold this year. Therefore, we do not foresee a recession in the medium-term. Our GDP forecast for this year is 2.4% and for 2020 is 2.2%. We will continue to monitor the upcoming data for recession signals and will release an update if we notice any significant change to our current recession outlook.
Forecasting Recession Risks for the Short-Term
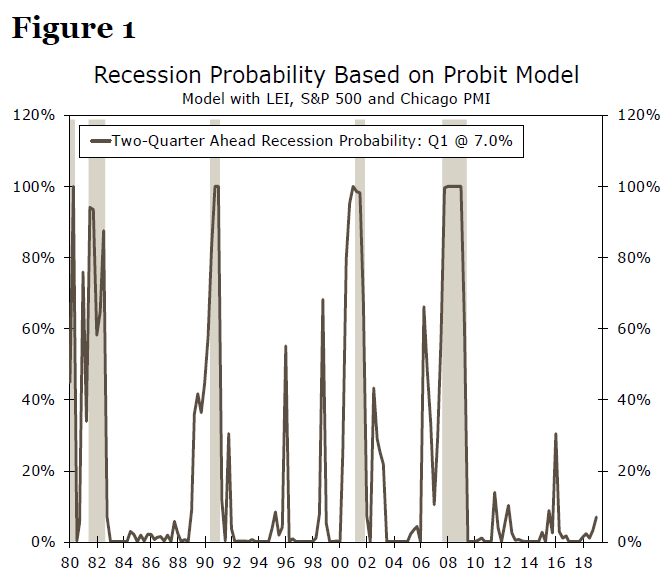
Using a handful of predictors, a Probit model estimates the probability of a recession in the future. Our official model built in 2007 utilizes the index of Leading Economic Indicators (LEI), the S&P 500 index and the Chicago-PMI employment index as predictors. Our model predicted (in real time) a 58% probability of a recession in Q3-2007.2 In addition, our Probit model did not indicate a recession during 2010-2012 allowing us to avoid joining the "double-dip" camp.
Using data through February 2019, our model suggests a meager 7.0% chance of a recession in the short-term (Figure 1). The key predictor of the model, the LEI, did not show signs of negative growth. A negative LEI value may indicate weakness in the economy. Furthermore, given the positive momentum of the LEI (average growth rate is 0.25% for the past 12 months), it would be very difficult to imagine a recession within the next six months.
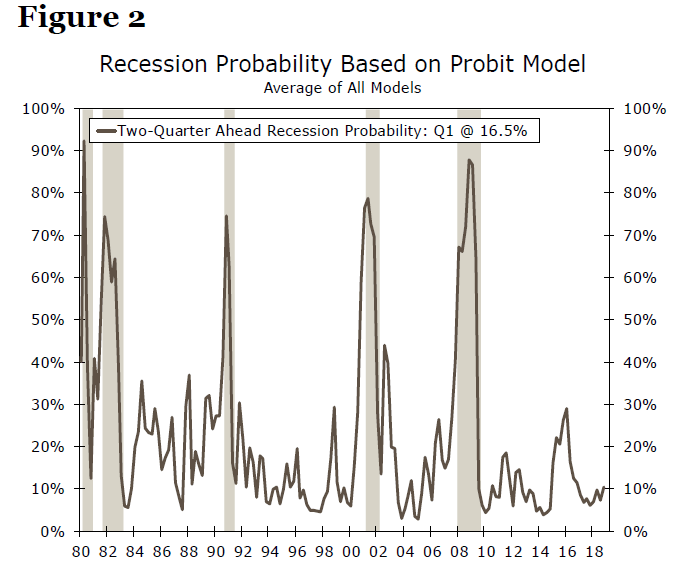
In addition to our official Probit model, we built six different Probit models in 2016 to capture the risk of a recession.3 Each model utilizes information from different sectors of the economy to estimate the potential risk posed. The average probability of all models is a low 17%, which represents the potential risk of a recession (Figure 2). Overall, our Probit models suggest low recession risk in the short-term. Nevertheless, there is always the possibility of an unforeseen shock.
The Yield Curve Has Inverted, But No Recession Worries
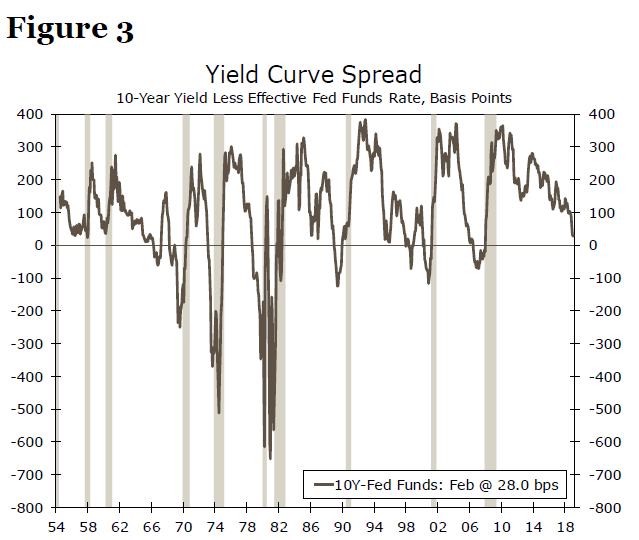
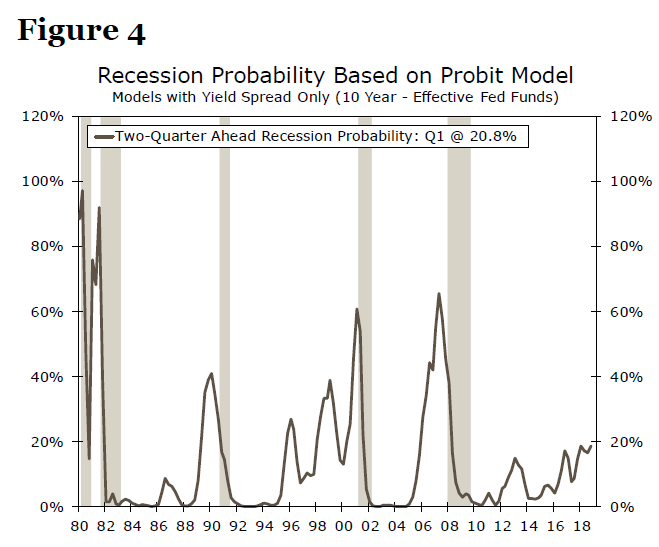
For the first time since the Great Recession, the yield curve has fallen into negative territory raising concerns of an upcoming recession. The yield curve inverted prior to the past seven recessions (Figure 3). However, the spread remained positive in 1954-1964 and that period experienced two recessions. Including data up to February 2019, the yield curve Probit model estimated a 21% probability of a recession, marking the highest estimate since the Great Recession (Figure 4). However, it's still lower than the past recessions' probabilities as a result of the shallow depth and short duration of the current inversion.4 For the past three recessions, the yield curve remained negative for at least six consecutive months before a recession start date. Essentially, if the yield curve were to remain inverted for about six months the probability of a recession could be boosted to a historical high. For now the yield curve Probit model does not necessarily signal that a recession is around the corner.
Predicting Trend-Like Growth for the Near-Term
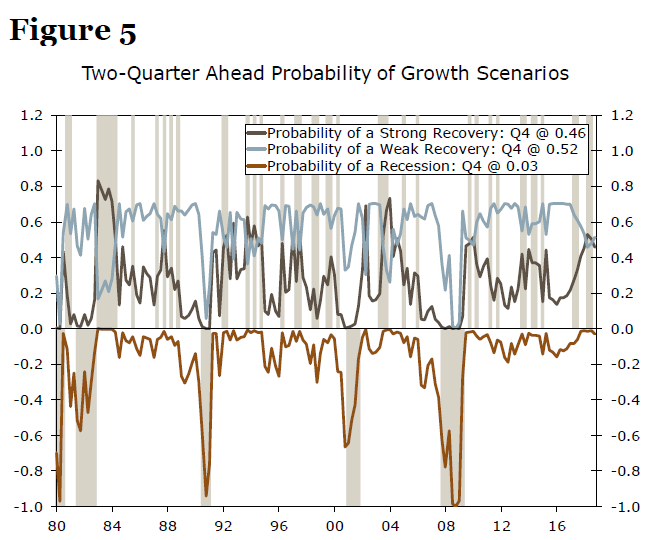
Economies evolve over time meaning that monetary policy adjustments need to be made to support the expected economic enviroment. For example, the Great Recession ended in June 2009 and the first interest rate hike by the FOMC occurred in December 2015. When compared to historical standards, the painfully slow economic recovery was a major reason for the ultra-accommodative monetary policy stance, even after the recession ended. Therefore, it is important to predict the pace of a recovery/expansion (weaker versus stronger) in addition to the timing of a recession. A weaker recovery prediction (such as the recovery from the Great Recession) suggests a continuation of accommodative monetary policy, as opposed to a stronger recovery forecast, which may support a change in monetary policy. Therefore, we built an ordered Probit framework that simultaneously predicts the probability of a recession and the strength of a recovery/expansion. The model successfully predicted all recessions and pace of recoveries since the 1980s in a simulated, out-ofsample experiment.5 The most recent estimate of the model (based on Q4-2018) suggests a higher chance (52% probability) of trend-like growth, around 2%-2.5% real GDP growth for the first half of 2019 (Figure 5).
Despite the current expansion, trend-like growth is expected for 2019. Typically, economies produce slower growth rates in the late phase of the business cycle, as resource utilization is close to peak level. Therefore, the current 2.9% growth for 2018 may lose some steam. Our GDP growth forecast for 2019 is 2.4% and 2.2% for 2020.
What About the Medium-Term?
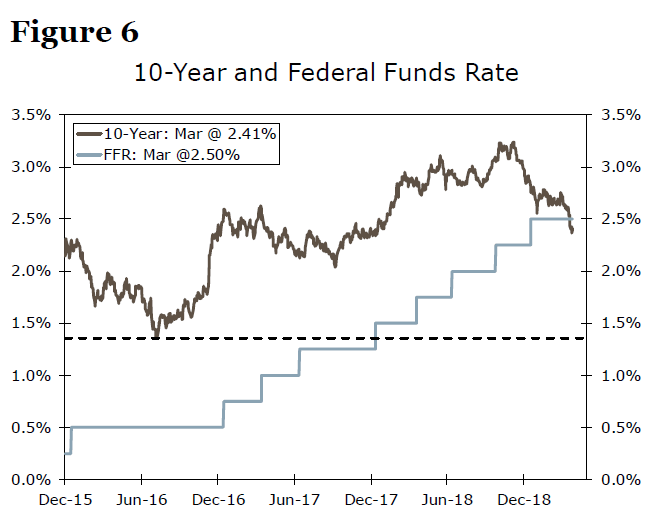
Keynes coined the phrase, "in the long run we are all dead." While Keynes is correct, the medium-term economic outlook is important for decision makers. To estimate medium-term recession risks, we developed a framework in 2017. Our proposed framework identifies a threshold between the fed funds rate and the 10-year Treasury yield. The threshold is breached when the fed funds rate touches or crosses the lowest level of the 10-year Treasury yield in that cycle. When this occurs, the risk of a recession increases. Our framework has successfully predicted each recession since 1954 with an average lead time of 17 months, and several quarters before the yield curve inverted. Therefore, it serves as an effective tool in predicting recessions, and we do not need to wait for the yield curve to invert to predict a recession.
In the current monetary cycle, the threshold was set by the lowest 10-year Treasury yield, 1.36%, on July 5, 2016. At this time, the fed funds rate was at just 0.50%. In December 2017 the FOMC hiked rates to 1.50% for the first time in the cycle, thereby crossing the Treasury yield threshold set in 2016 (Figure 6). Historically speaking, when the threshold is met, a recession or monetary policy change occurs within the next 17 months. Is this time different?
The FOMC has Changed the Monetary Policy Stance
While this time may be different for the inversion of the yield curve as a reliable recession predictor, this time is not different for our framework. The robustness of the framework holds true in real time. At its March meeting, the FOMC changed its monetary policy stance from raising the fed funds rate to a "patient" stance. The market-implied consensus is that the FOMC may not raise rates in 2019 as fed funds futures put a zero probability of a rate hike in 2019 and instead a 76% probability of a rate cut by next year.
In prior long economic expansions, monetary policy shifted due to a "mid-cycle softening" and the FOMC reduced interest rates to boost the economy. This phenomenon occurred in the 1960s, 1980s and 1990s. Therefore, in the current expansion (which is currently the second longest expansion on record), the FOMC may repeat the past exercise of changing its monetary policy stance to fight a mid-cycle economic slowdown. As FOMC members have said that they are data dependent, incoming economic and financial data will affect future FOMC decisions. By the same token, we are monitoring the upcoming data to gauge signals, which could affect our recession call.
Conclusion
Our models suggest there is very low recession risk for the first half of 2019. The ordered Probit model predicts trend-like growth for the upcoming quarters. In the near-term, both the preferred and ordered models propose fundamentals are strong. Our official call for 2019 is a healthy economy experiencing trend-like growth of 2.4%. We will be evaluating the upcoming data and will publish a report if we notice significant developments either against or in favor of our recession call. Furthermore, decision makers should carefully monitor the upcoming data to gauge signs of changes in the momentum of the economy.
1 For more detail about the new methodology see "Do We Need to Wait for a Yield Curve Inversion to Predict a Recession? No." (September 08, 2017).
2 For a detail discussion about Probit models see out report "Recession Talks in the Spotlight: Should We Worry?" (February 24, 2016).
3. Please see footnote 2 for the reference to the report.
4 The Model predicted a 55% probability in Q1-2007, 61% in Q1-2001 and 41% in Q1-1990.
5 For more detail about the Ordered Probit model see our report, "Predicting the Probability of Recession and Strength of Recovery: An Ordered Probit Approach." (July 19, 2016)
Sunset Market Commentary
Markets
Global core bonds lost ground today as risk sentiment flourished. Chinese manufacturing PMI was strong. Investors embraced the results, leading bourses higher with Chinese outperforming (up to +3%). The uptick in sentiment pushed core bonds down before the EU opening. The final reading of the March EMU PMI’s and the EMU consumer inflation data for March (0.8% MoM vs. 0.9% expectations and down from 1.0% in February) printed weaker than expected, preventing German Bunds from more losses. The German yield curve is bear steepening with changes up to +4.0 bps (30-yr). US Treasuries opened lower too and moved with a cautious downward bias afterwards. February retail sales disappointed but they were outbalanced by a strong upward revision of the February result, keeping the market impact limited. Investors awaited the more forward-looking March ISM Manufacturing index. The confidence gauge surprised on the upside (infra), further pushing US Treasuries down. The US yield curve is moving higher with changes in the range of +5.1 bps (30-yr) to +6.2 bps (10-yr). Peripheral spreads over the German 10-yr yield are stable, with Greece (-5 bps) outperforming.
EUR/USD was well supported today, profiting from a benign risk environment that emerged from better than expected Chinese (manufacturing PMI’s). The common currency showed little interest in even worse final German, French and EMU manufacturing PMI’s. Slowing core/headline inflation to a mere 0.8% MoM/1.4% YoY (vs. 0.9%/1.5% expected) had virtually no impact either. The pair peaked at 1.1250 before partially paring gains around noon. Attention shifted to the US with lower-than-expected retail sales (Feb). The (dollar negative) reaction was short-lived as beefed up January data (up to 0.6% points!) compensated for missed estimates. A strong March manufacturing ISM supported the dollar further afterwards. The indicator printed better than anticipated (55.3 vs. 54.2 in February). The pair is currently trading at 1.120, close to opening levels. USD/JPY jumped above 111 after the release.
The brexit impasse is clearly having real economic effects as today’s UK PMI’s showed. The issue is still far from resolved with parliament holding for a second time a day of indicative votes later today, after an inconclusive first round. MP’s have proposed 9 alternatives (down from 18 in the first round) to May’s deal, some of them very similar the ones proposed last week. It is up to Speaker of the House Bercow which ones will eventually get discussed and voted on. May is awaiting tonight’s outcome before deciding on her next steps (a fourth try?). Sterling meanwhile is trading a pattern similar to last week. EUR/GBP slips (sterling advances) ahead of the parliamentary voting. The couple stabilized at 0.857. The risk is real though that tonight’s results fail to clear the brexit path going forward. Even in the case of a parliamentary majority for any of the alternatives, it is still up to May to decide whether or not to comply with the outcome. Even more important, any deal other than May’s requires EU approval. We are therefore cautious to buy into current sterling strength.
News Headlines
UK’s manufacturing PMI confidence (55.1) crushed markets estimates of 51.2. The rebound however is less cheering then it looks. British manufacturers stepped up preparations for potential disruptions related to (a disorderly) Brexit. Output, employment and new orders rose at increased rates as they and their clients are building safety inventories, according to IHS Markit.
US ISM manufacturing confidence recovered more than expected in March (55.3 vs. 54.5) as February’s weather related effects faded. High profile subcomponents also showed solid gains, with new orders rising from 55.5 to 57.4 and employment increasing sharply from 52.3 to 57.5.
US Retail Sales: Two Steps Up and One Step Back
A mixed report on retail sales puts the 3-month annualized rate of decline in control group sales in a spot usually associated with recession. Our take: look through recent weakness and focus on fundamentals.
February Retail Sales Slip; January Better than First Thought
Retail sales fell 0.2% in February, but that comes on the heels of a revision, which more than tripled the first estimate for sales growth in January. There were few categories that saw increased sales in February. Gas stations saw a modest pick-up, though that likely is just a reflection of higher prices at the pump. Auto sales and online sales were higher as well, but most other categories were in the red to varying degrees.
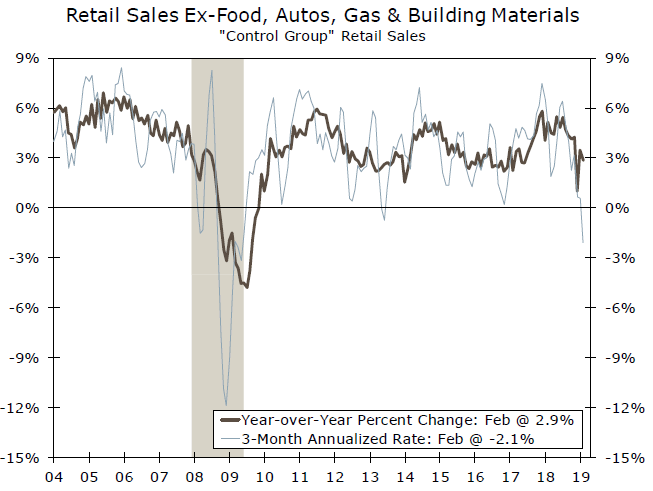
The control group, which feeds into estimates for personal consumption expenditures in the GDP report, fell 0.2% in February. But evidence of the upward revision to January were evident here as well, lifting the increase in January control group sales to 1.7%—the biggest one-month pop in 17 years. Still, if you look at the middle chart, in the past 15 years we have not seen the 3-month annualized rate go this far into negative territory outside of a recession.
The retail sales numbers have been extraordinarily choppy in recent months and the government shutdown occurred right in the middle of what appears to be an inflection point for the consumer. We may not be flying blind, but this may be a time when you discount the official data. The significant revisions in the data offer some justification for that approach recently.
So which is it? Are we just in a soft patch or is this the beginning of a more worrying retrenchment in consumer spending? Our sense is that this weakness is temporary. By a number of metrics, the job market is as good as it has been since the turn of the century. The stock market, while certainly jittery, is just a few percentage points from all-time highs, which has lifted household wealth considerably over the past decade. These are not the conditions we would look for to identify a sustained retrenchment in consumer spending.
There are many potential culprits for the recent weakness: the government shutdown which spooked financial markets, the polar vortex which kept consumers indoors and the timing and size of tax refunds. All of these factors are already fading, and we are on the record as saying that tax refunds may be later, but won't be meaningfully different from prior years.
None of this is to say that we see the consumer through rose-colored glasses. We do worry about student loan debt and the long term albatross that will be for a generation of U.S. consumers. We do expect a slowing in the pace of personal consumption growth as the business cycle ages. But, the softness indicated by last week's personal income and spending report and corroborated today by this mostly negative retail sales report overstates the weakness, and we expect both confidence and sales to rebound in a more meaningful way as the year progresses.
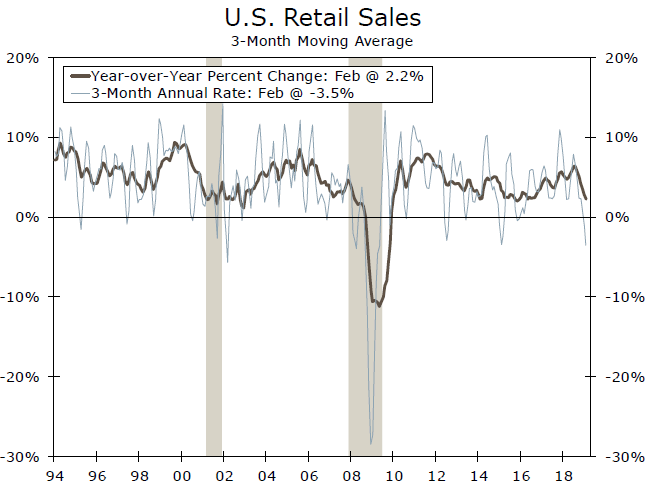
US: Retail Sales Unexpectedly Fall in February
- Retail sales fell 0.2% (m/m) in February, disappointing expectations for a 0.2% gain. On a more positive note, January's headline print was revised up 0.5 percentage point to 0.7%. All told, limited headway has been made over the last several months, with overall sales still near June 2018 levels.
- Sales improved in three of the four more volatile categories. Strongest month-on-month gains were recorded in autos & auto part dealers (+0.7%), and at gasoline stations (+1%) reversing some of last month's weakness. After a few weak months, sales at food services and drinking places rose a modest 0.1% in February. On the other hand, receipts at building materials, garden equipment & supply dealers fell -4.4%, fully reversing January's gain.
- Excluding the above categories (gas, autos, building materials, and food services), sales in the so-called 'control group' used in calculating GDP also fell 0.2% in February. Receipts fell in six of the nine categories in the control group, with declines between -0.3% (general merchandise) and -1.6% (miscellaneous). Health (+0.6%), sporting goods (+0.5%), and non-store retailers (+0.9%) continued to build on last month's gains. On a more positive note, sales in the control group were bumped up 0.1 and 0.6 percentage points in December and January, respectively.
Key Implications
- With the end of the government shutdown in late January, Americans were expected to return to malls and store in slightly better spirits. But, the miss on the sign in today's headline print (-0.2% vs. +0.2%) seems like a cruel April Fool's joke. The silver lining in today's report were the sizable upward revisions to January, both to overall and control-group sales.
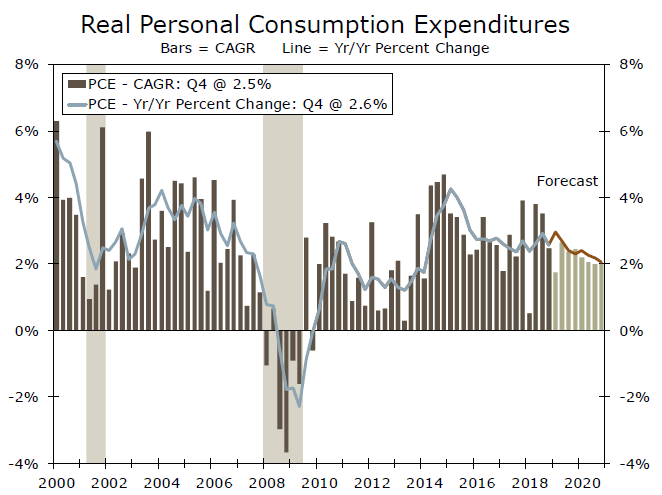
- Today's report leaves the tracking for first quarter consumer spending broadly unchanged at between 0.5% and 1% (annualized). First-quarter consumption has tended to come in soft over the last few years, with 'residual seasonality' likely playing a role. After layering on the negative effect of the government shutdown, this year's first-quarter weakness is really no surprise.
- A robust labor market should continue to shore up spending in the months ahead, with large payroll gains expected to make a comeback in March (data to be released this Friday). A notable pullback in interest rates recently and a steady Fed, will be an added tailwind. In this vein, while potential potholes, such as trade skirmishes, could weigh on confidence and spending plans, consumption should cruise at slightly above 2% annualized pace in the second half of this year, with the deceleration relative to last year's pace reflecting a fading boost from tax cuts.
ISM manufacturing rose to 55.3, employment jumped to 57.5
US ISM manufacturing index rose to 55.3 in March, up from 54.2 and beat expectation of 54.3. Price paid component rose to 54.3, up from 49.4. Employment component jumped notably to 57.5, up from 52.3.
ISM noted that
- Comments from the panel reflect continued expanding business strength, supported by gains in new orders and employment.
- Demand expansion continued, with the New Orders Index returning to the high 50s, the Customers' Inventories Index improving but remaining too low, and the Backlog of Orders Index softening to marginal expansion levels.
- Consumption (production and employment) continued to expand and regained its footing with a combined 6.2-percentage point gain from the previous month's levels, recovering most of February's loss.
- Inputs — expressed as supplier deliveries, inventories and imports — were lower this month, primarily due to inventory consumption exceeding inputs, resulting in a combined 2.3-point decline in the Supplier Deliveries and Inventories indexes that contributed negatively to the PMI.
- Imports expansion declined to near-zero expansion levels.
- Overall, inputs continue to reflect an easing business environment, but to a lesser extent than in February, confirmed by the Prices Index returning to expansion.
- Exports orders continue to expand, but at marginal levels.
- Prices reversed two months of contraction by returning to a robust mid-50s level.
- The manufacturing sector continues to expand, demonstrated by improvements in the PMI® three-month rolling average, which is consistent with overall manufacturing growth projections.
ECB Draghi said substantial stimulus remains essential, de Guindos said weaker growth will weigh on inflation
In ECB annual report published today, President Mario Draghi maintained that "substantial monetary policy stimulus remains essential to ensure the continued build-up of domestic price pressures over the medium term". Also,"In view of the persistence of uncertainties related to geopolitical factors, the threat of protectionism and vulnerabilities in emerging markets, the conduct of monetary policy in the euro area will continue to require patience, prudence and persistence."
In presenting the report, Vice President Luis de Guindos warned that "the effect of the adverse factors weighing on growth is expected to unwind over time." And, "weaker growth momentum will leave its mark on domestic price pressures, slowing the adjustment of inflation towards our aim".