
Sample Category Title
USD/JPY Daily Outlook
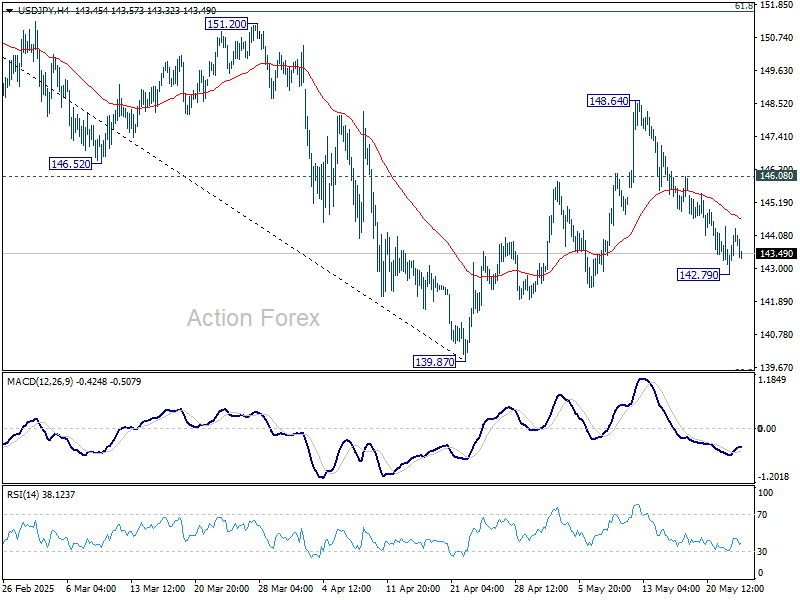
Daily Pivots: (S1) 143.08; (P) 143.75; (R1) 144.68; More...
Intraday bias in USD/JPY is turned neutral with current recovery, and some consolidations would be seen above 142.79 temporary low. Risk will stay on the downside as long as 146.08 minor resistance holds. Rebound from 139.87 could have completed as a correction to 148.64 already. Below 142.79 will target a retest on 139.87 low.
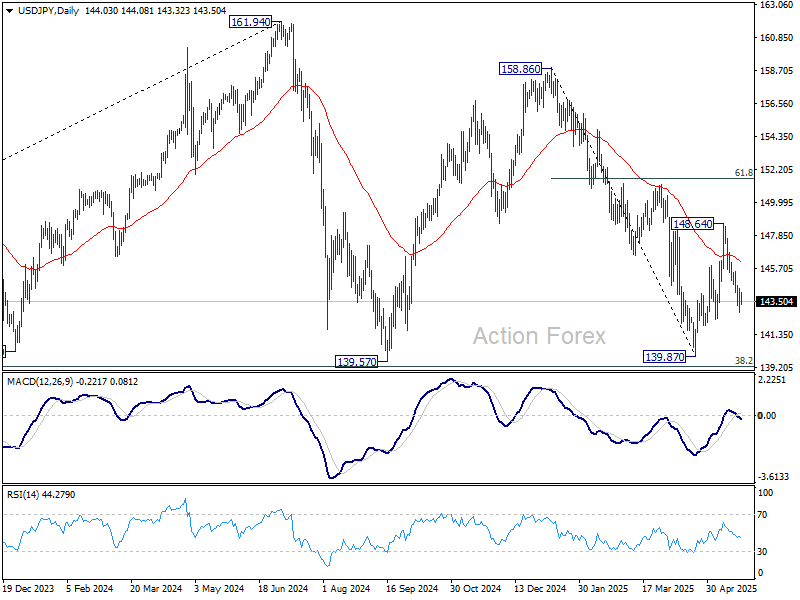
In the bigger picture, price actions from 161.94 are seen as a corrective pattern to rise from 102.58 (2021 low), with fall from 158.86 as the third leg. Strong support should be seen from 38.2% retracement of 102.58 to 161.94 at 139.26 to bring rebound. However, sustained break of 139.26 would open up deeper medium term decline to 61.8% retracement at 125.25.
GBP/USD Daily Outlook
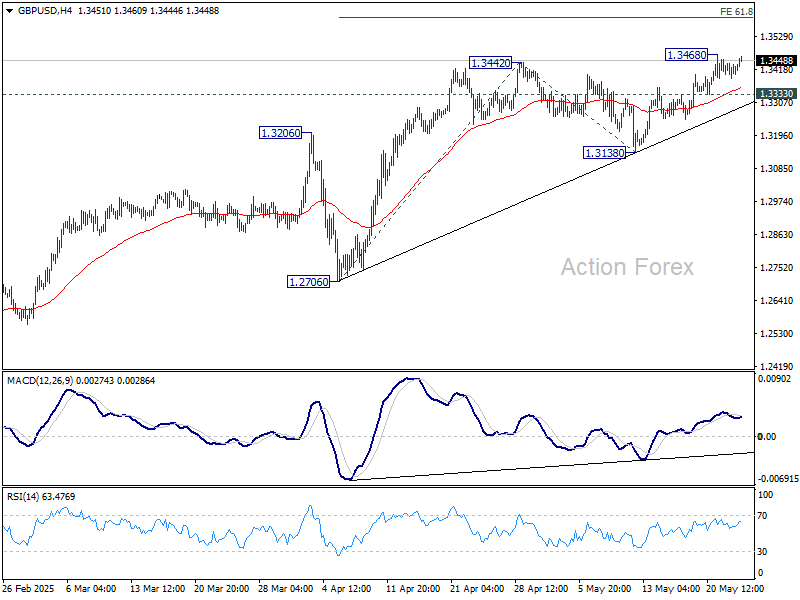
Daily Pivots: (S1) 1.3393; (P) 1.3417; (R1) 1.3443; More...
Intraday bias in GBP/USD stays neutral and further rally is expected with 1.3333 support intact. Above 1.3468 will extend larger up trend to 61.8% projection of 1.2706 to 1.3442 from 1.3138 at 1.3593, and then 100% projection at 1.1.3874. However, break of 1.3333 will turn bias back to the downside for 1.3138 support instead.
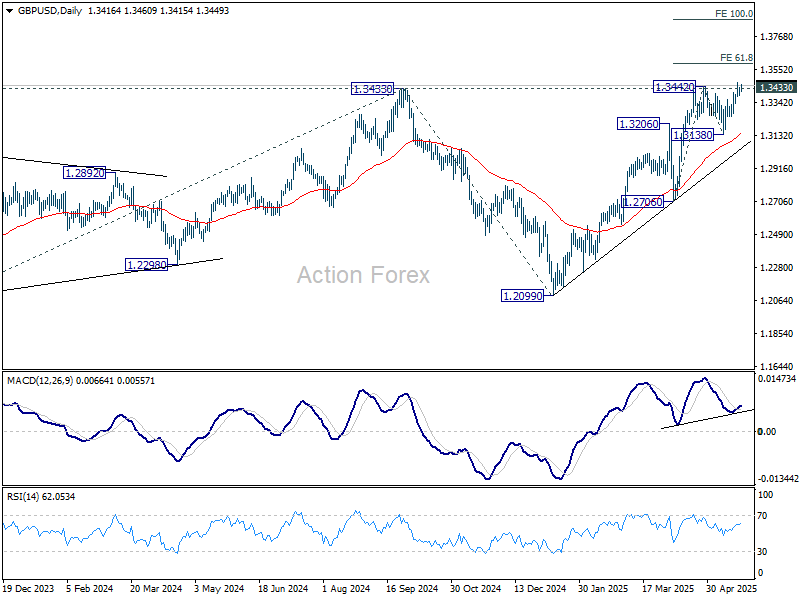
In the bigger picture, up trend from 1.3051 (2022 low) is still in progress. Decisive break of 1.3433 (2024 high) will confirm resumption. Next medium term target is 61.8% projection of 1.0351 to 1.3433 from 1.2099 at 1.4004. Nevertheless, sustained trading below 55 D EMA (now at 1.3124) will delay the bullish case and bring more consolidations first.
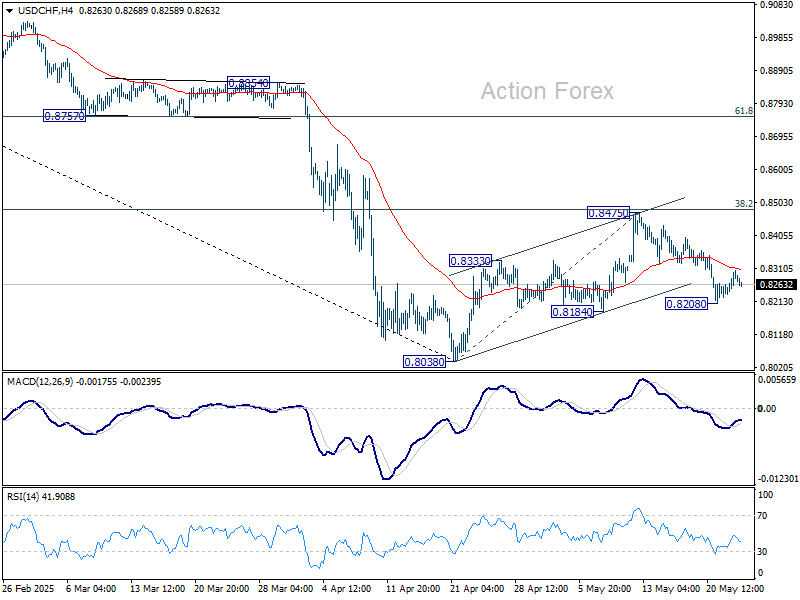
USD/CHF Daily Outlook
Daily Pivots: (S1) 0.8246; (P) 0.8277; (R1) 0.8319; More….
Intraday bias in USD/CHF remains neutral at this point. Risk will stays on the downside as long as 0.8475 resistance holds. Corrective rebound from 0.8038 should have completed already. Below 0.8208 will bring retest of 0.8038 first. Firm break there will resume larger down trend to 61.8% projection of 0.9200 to 0.8038 from 0.8475 at 0.7757 next.
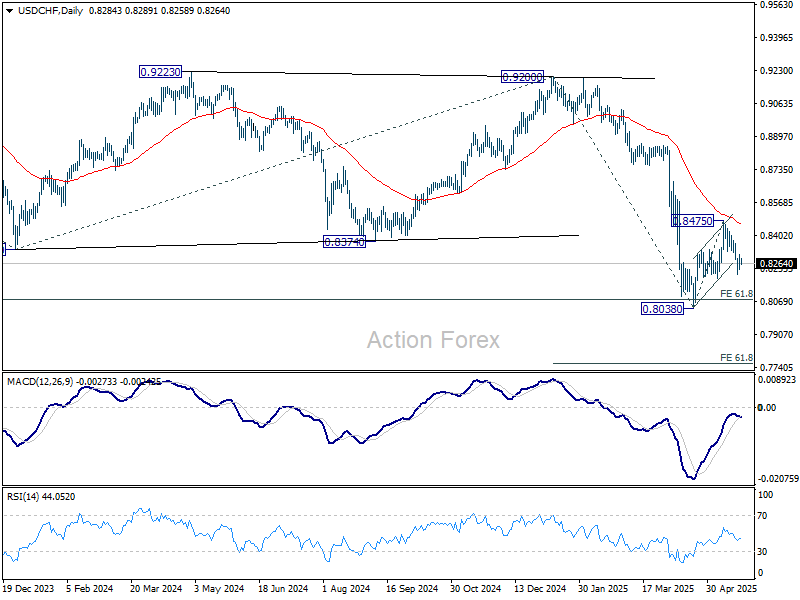
In the bigger picture, long term down trend from 1.0342 (2017 high) is still in progress and met 61.8% projection of 1.0146 (2022 high) to 0.8332 from 0.9200 at 0.8079 already. In any case, outlook will stay bearish as long as 55 W EMA (now at 0.8765) holds. Sustained break of 0.8079 will target 100% projection at 0.7382.
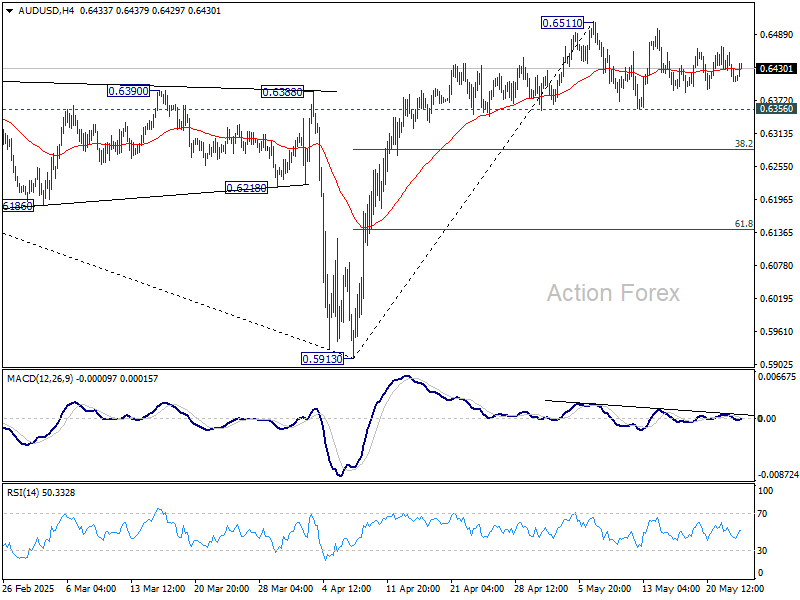
AUD/USD Daily Report
Daily Pivots: (S1) 0.6392; (P) 0.6425; (R1) 0.6444; More...
No change in AUD/USD's outlook as sideway trading continues. Intraday bias stays neutral and further rise is in favor with 0.6356 support intact. One the upside, break of 0.6511 will resume the rise from 0.5913 and target 61.8% retracement of 0.6941 to 0.5913 at 0.6548. However, firm break of 0.6356 will bring deeper pullback to 38.2% retracement of 0.5913 to 0.6511 at 0.6283 first.
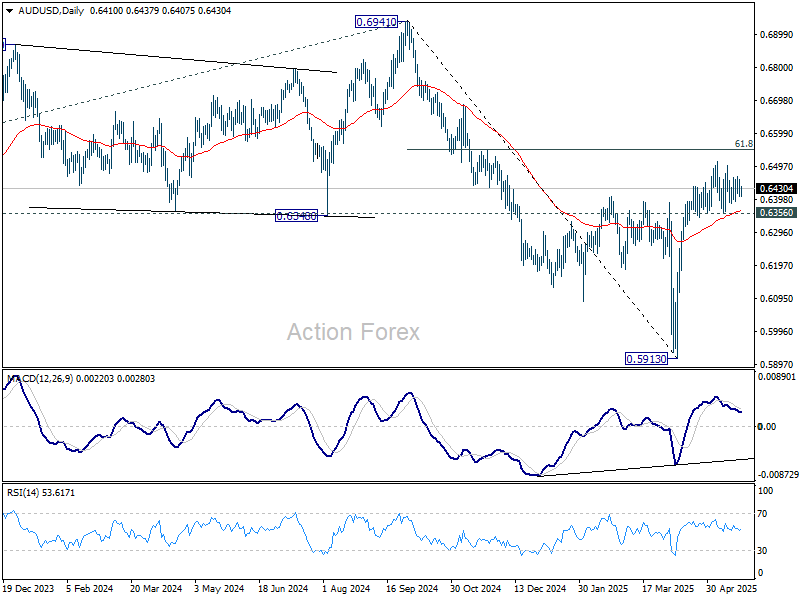
In the bigger picture, as long as 55 W EMA (now at 0.6438) holds, down trend from 0.8006 (2021 high) should resume later to 61.8% projection of 0.8006 to 0.6169 from 0.6941 at 0.5806. However, sustained trading above 55 W EMA will argue that a medium term bottom was already formed, and set up further rebound to 0.6941 resistance instead.
US Bond Selloff Cools, But Risks Prevail
The selloff in US equities eased yesterday as pressure in the bond space declined. But the news is far from reassuring for a sustainable relief: US politicians continue to turn a blind eye to the stress building in the sovereign bond space. The House of Representatives passed Trump’s ‘beautiful’ tax bill yesterday—with just one vote. But one vote is all it takes to send the bill to the Senate, which is narrowly controlled by the same Republicans who proposed it.
In case you missed it, the bill aims to cut spending on social welfare and climate-friendly programs in order to fund tax cuts. The thing is, even if it gets through the Senate, it still has to pass the bond market test. Investors in US Treasuries are increasingly uncomfortable with the country’s ballooning debt, and may not be willing to finance Trump’s budget ambitions without demanding higher yields.
Unsurprisingly, appetite for US solar stocks is going from bad to worse. Enphase—the star of the 2020-2022 solar rally—plunged nearly 20% yesterday following the US vote to cut clean energy tax credits.
Meanwhile, US yields have eased slightly. The 10-year yield fell 10 basis points from its high of 4.62% to trade just above 4.50% this morning, likely on the back of dip-buying interest from investors keen to lock in a 4.5% return. The 30-year yield, on the other hand, expanded to 5.15% and is now consolidating around the 5% mark. Still, the crisis is far from over. The risk of another selloff lingers, as higher yields continue to pressure US equity valuations—mathematically, the higher the yields, the lower the present value of future cash flows.
The S&P 500 erased its early-session gains and closed slightly down. The Dow Jones ended the day flat, while small and mid-cap stocks recorded slightly deeper losses—likely weighed down by stronger-than-expected S&P Global PMI numbers, which showed improvement in both manufacturing and services activity in May. This may reflect the temporary relief to tariff pressures, though price pressures continued to rise.
As a result, the US dollar was better bid during the Thursday session, though selling pressure returned in Asia. In contrast, Europe’s PMI data disappointed. Both services and composite PMIs unexpectedly slipped below the 50 threshold—into contraction territory—possibly due to lingering tariff uncertainties. Bundesbank President Joachim Nagel warned earlier this week that the German economy could stagnate this year, with better prospects next year as government spending kicks in. But for now, the slow pace of recovery remains a concern for investors who were more optimistic at the start of the year.
Still, the euro is performing well against a basket of G7 currencies. It’s gaining against the dollar, the British pound (as the UK also grapples with budget issues), the Aussie, the Kiwi, the Canadian dollar, and even the Japanese yen—though not against the Swiss franc. This relative strength is partly because the euro is increasingly being seen as a reasonable alternative to the US dollar as a reserve currency.
Also, lower energy prices are a welcome relief for German economy, which has lagged due to the European energy crisis in recent years. A sustained decline in energy prices could help lift growth prospects and support the euro—especially if inflation remains under control and the European Central Bank (ECB) remains supportive. In this context, the widening yield differential between the US and the Eurozone is driving a rise in ‘reverse Yankee’ issuance—US companies, particularly those with European operations, are now issuing euro-denominated bonds to benefit from lower borrowing costs. According to Bloomberg, European corporate bonds are averaging around 3.18% in yield, compared to 5.3% in the US. This improving appetite for European debt adds another leg of support to the euro.
In commodities, crude oil prices took another hit yesterday after reports emerged that OPEC+ is considering a sizable production hike in July—reportedly 411,000 barrels per day—to meet growing demand. However, demand prospects remain uncertain amid ongoing trade tensions... So this move may be an attempt to appease Donald Trump, who has long lobbied for lower energy prices, or possibly to penalize member states that have repeatedly breached their quotas. Either way, OPEC appears less willing to cut supply to support prices. Consequently, US crude fell to $60.60 per barrel yesterday. While there is psychological support around the $60 level, the failure to breach the 50-day moving average earlier this week suggests that geopolitical tensions alone are not enough to push prices sustainably higher—unless they escalate into something far worse, which we obviously don’t hope for.
From a technical perspective, US crude remains in a bearish trend below $65.30 per barrel, the 38.2% Fibonacci retracement that marks the divide between a year-to-date downtrend and a potential medium-term bullish reversal. Any escalation in Middle East tensions could trigger a spike in prices. Such geopolitically driven rallies may present interesting tactical opportunities, but they are likely to be short-lived. If the weekend brings any bad news and Monday opens with a jump, it would be wise to set profit targets.
Euro Area PMIs Falter, as US Show Robust Growth
In focus today
In the euro area, focus turns to the initial wage growth data for Q1, specifically the ECB's indicator of negotiated wages. We anticipate a significant decline in wage growth from the 4.1% y/y recorded in Q4. This is attributed to reduced actual pressures and the base effect from substantial inflation-compensating one-offs provided to employees in Q1 2024, as indicated by the ECB's wage tracker.
In Sweden, Q1 unemployment figures from the Labour Force surveys have shown significant volatility. April data, releasing today, is expected to show an improvement from January's 9.6% to 8.9%, but an increase from March's 8.1%. Employment is expected to decline, reflecting the drop in new vacancies observed in late April.
Economic and market news
What happened overnight
In Japan, core inflation rose to 3.5% y/y, exceeding expectations and reaching its fastest pace in over two years, driven by reduced energy subsidies and rising food prices. Excluding fresh food and fuel costs, the index increased to 3.0% y/y, underscoring the BoJ's predicament of balancing price pressures from persistent food inflation against growing headwinds from Trump's tariffs.
What happened yesterday
In the euro area, PMIs came out dovish, with composite dropping below 50 to 49.5, largely due to a disappointing drop in services to 48.9 (cons: 50.3, prior: 50.1). This is concerning, given that services constitute 73% of the economy and have been the primary growth driver in recent years. Meanwhile, manufacturing showed resilience, improving to 49.4, with the output index staying above 50 due to rising domestic and international orders, indicating minimal impact from trade uncertainty.
Similar trends were observed in France and Germany, where services underperformed, recording lower-than-expected figures at 47.7 and 47.2, respectively, while manufacturing remained strong. In Germany, the IFO figures highlighted increased business expectations, with optimism driven by lower interest rates and anticipated large projects, outweighing trade war concerns.
In the US, PMI data showed robust growth, with manufacturing rising to 52.3 (prior: 50.2) and services increasing to 52.3 (prior: 50.8). The manufacturing index benefited from front-loading, while the stockpiling sub-component hit a record-high in May.
The US House, led by Republicans, narrowly passed Trump's tax bill with a 215-214 vote, advancing it to the Senate, where passage may face greater challenges and could take weeks.
In Norway, the Norges Bank Expectations survey aligns with market expectations, showing 2025 wage growth forecasts at 4.4%, matching the central wage norm and Norges Bank's forecast. Notably, wage growth expectations for 2026 remain unchanged at 3.7%, below Norges Bank's forecast of 4.0%. Short-term inflation expectations rise, but the five-year decline eases pressure on Norges Bank. Profitability expectations turn negative indicating weaker sequential growth, yet the employment diffusion index has shown a positive trend.
Equities: Equity markets ended lower yesterday, largely reflecting spillover effects from the weak US session on Wednesday. This meant that the underperformance was most notable in cash markets across Europe, Japan, and broader Asia, whereas US equities managed to hold broadly flat. Given that the US is mostly driven by cyclical sectors, we observed a marginal cyclical outperformance yesterday. Volatility edged slightly lower with the VIX ticking down again, and across asset, we had a modest bid returning to the dollar. Meanwhile, US long-end yields, which had touched 5.15% on the 30-year, eased slightly into the close. In the US yesterday, Dow 0.0%, S&P 500 -0.04%, Nasdaq +0.3%, and Russell 2000 -0.1%. Looking to this morning, Asian equities are mostly higher, with a constructive tone prevailing in both Japan and China despite Japanese inflation data coming out slightly on the high side this morning. Futures markets in Europe and the US are little changed.
FI&FX: US yields initially rose yesterday but staged a reversal from late afternoon with the 10Y UST moving from a peak of 4.62% to 4.52% and the 30Y UST from a peak of 5.15% yesterday to 5.04%, trading sideways overnight. Today is light in terms of Tier 1 data so attention will be on the US Senate where several Republican members have demanded major changes to vote in favour of the tax bill. Despite the reversal in US yields, EURUSD has again moved above the 1.13-mark overnight after touching below 1.1260 yesterday. EURSEK edged somewhat higher yesterday and current level around 10.88 is not significantly misaligned with our short-term fair value. EURNOK remained stable overnight, in the lower part of the 11.50-11.54 interval seen since yesterday.
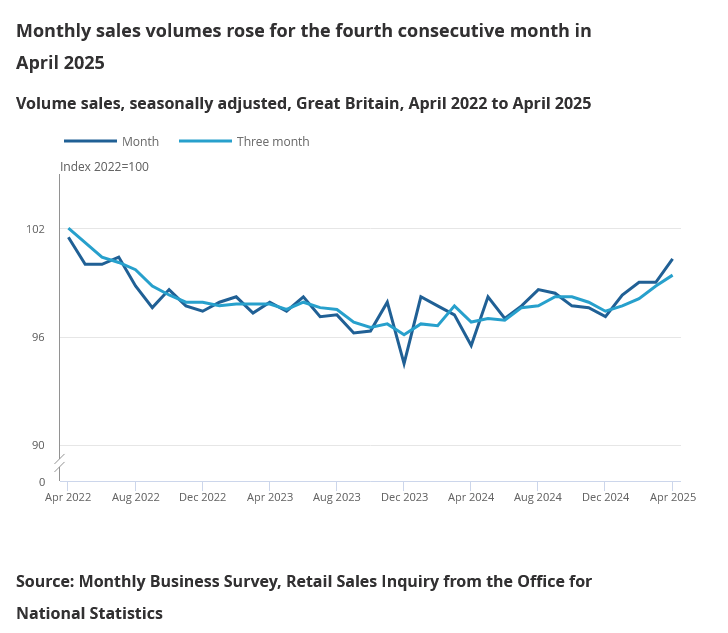
UK retail sales beat expectations with 1.2% mom growth, strongest annual gain since 2022
UK retail sales volumes jumped by 1.2% mom in April, significantly above the expected 0.3% mom gain. This marks the fourth consecutive monthly increase, with volumes now at their highest level since July 2022. Food store sales led the rise with a sharp 3.9% rebound, attributed largely to favorable weather conditions, offsetting declines seen in February and March.
On a broader basis, sales volumes grew 1.8% over the three months to April compared to the prior three-month period, the strongest gain since July 2021. Year-on-year, volumes rose 2.6%, the largest increase since March 2022.
USD/CAD Daily Outlook
Daily Pivots: (S1) 1.3840; (P) 1.3864; (R1) 1.3883; More...
Intraday bias in USD/CAD remains mildly on the downside at this point. Deeper decline should be seen for retesting 1.3479 low, or further to 1.3727 key fibonacci level. Nevertheless, break of 1.3888 minor resistance will turn bias back to the upside, to extend the corrective pattern from 1.3749 with another rising leg.
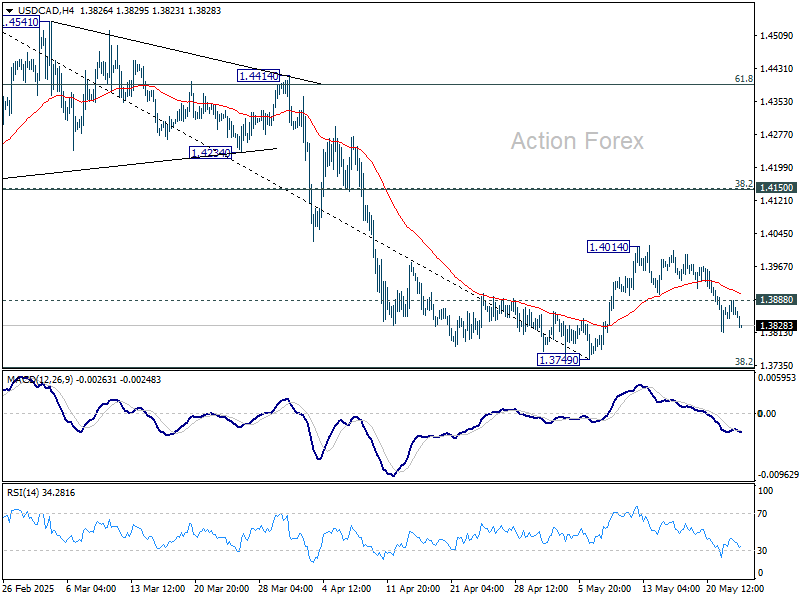
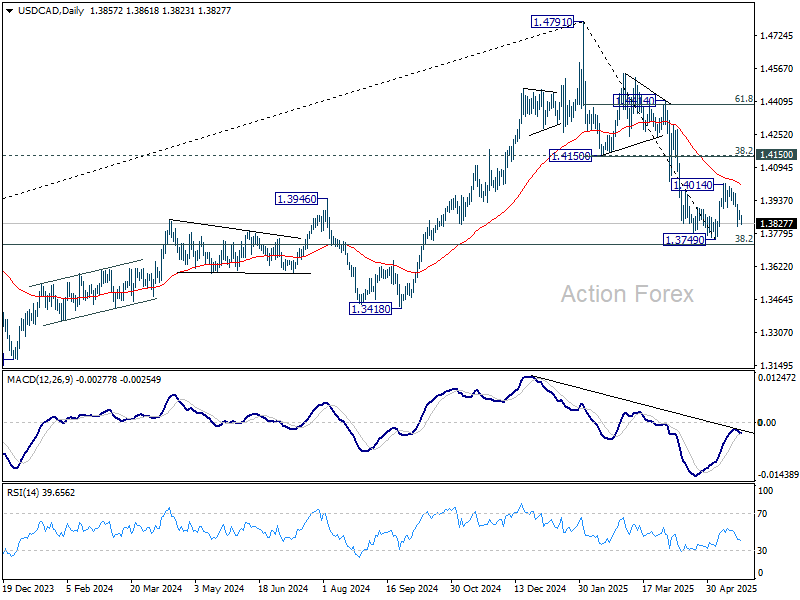
In the bigger picture, price actions from 1.4791 medium term top could either be a correction to rise from 1.2005 (2021 low), or trend reversal. In either case, further decline is expected as long as 1.4150 resistance turned support holds. Firm break of 38.2% retracement of 1.2005 (2021 low) to 1.4791 at 1.3727 will pave the way back to 61.8% retracement at 1.3069.
Focus Turns to Fragile Trade Progress as Dollar Lags in Cautious Markets
Dollar is once again under pressure in a relatively calm Asian session, as broader financial markets appear to have stabilized following the earlier bout of volatility driven by US deficit and debt concerns. Wall Street closed the day nearly flat with little direction, while US 10-year Treasury yield held above the 4.5% level after recent volatility. In Asia, risk appetite is returning modestly, with regional equities trading slightly higher.
The spotlight, however, has shifted back to the slow-moving trade negotiations between the US and several of its major partners. Japan is intensifying its engagement with the US on tariff talks, with top negotiator Ryosei Akazawa said to make a fourth visit to Washington on May 30, just one week after this weekend’s third round. Akazawa is seeking a direct meeting with US Treasury Secretary Scott Bessent, who won’t attend the upcoming session. Prime Minister Shigeru Ishiba also held a 45-minute phone call with US President Donald Trump at the latter's request, though Ishiba said Trump made no concessions on Japan’s demand for complete tariff elimination.
On the European front, the Financial Times reported that US Trade Representative Jamieson Greer plans to deliver a strong message to European Trade Commissioner Maros Sefcovic. Washington views Brussels' recent “explanatory note” as insufficient and continues to push for unilateral tariff reductions on US goods. Without meaningful concessions, the US is prepared to impose additional 20% reciprocal tariffs on EU exports.
Meanwhile, US-China communication channels remain open but unclear. A call between Chinese Vice Foreign Minister Ma Zhaoxu and US Deputy Secretary of State Christopher Landau yielded “substantial progress” in Beijing’s phrasing, though neither side confirmed whether tariff issues were addressed. Earlier, Vice Premier He Lifeng emphasized China’s willingness to open its markets further to US firms, a potentially strategic signal of compromise from Beijing amid slow progress elsewhere.
Currency markets continue to reflect a defensive stance. Yen remains the top performer for the week, followed by Euro and Swiss Franc. Dollar lags as the weakest currency, alongside Aussie and Kiwi. Sterling and the Canadian Dollar are holding in mid-pack.
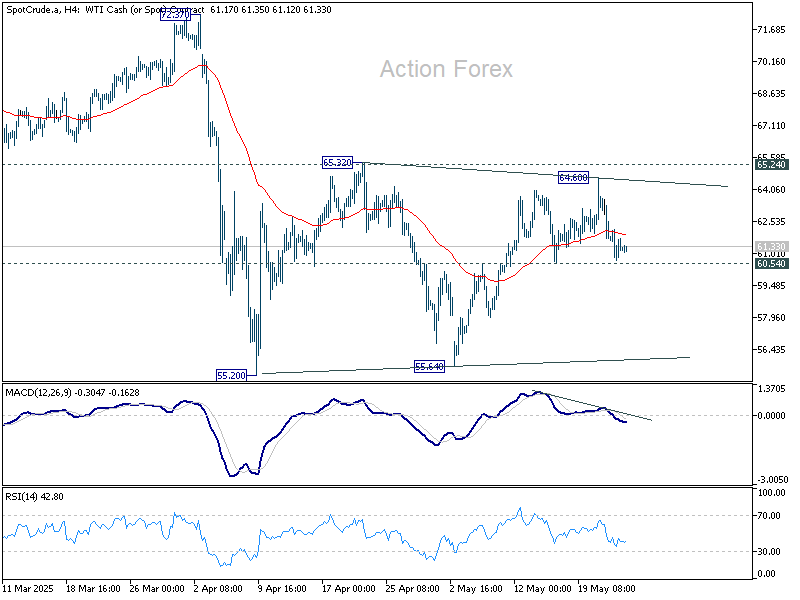
Technically, WTI crude oil reversed quickly after a brief spike to 64.60 earlier in the week. Overall outlook is that price actions from 55.20 low are merely a corrective pattern. Firm break of 60.54 support will suggest that the consolidation has completed with three waves to 64.60. Retest of 55.20/55.64 support zone should then be seen next.
In Asia, at the time of writing, Nikkei is up 0.58%. Hong Kong HSI is up 0.77%. China Shanghai SSE is up 0.03%. Singapore Strait Times is down -0.20%. Japan 10-year JGB yield is down -0.007 at 1.555. Overnight, DOW fell -0.00%. S&P 500 fell -0.04%. NASDAQ rose 0.28%. 10-year yield fell -0.043 to 4.553.
Looking ahead, retail sales data from the UK and Canada are the main focuses of the day.
Sticky inflation persist as Japan’s core CPI climbs to 3.5%
Japan’s inflation pressures remained elevated in April, with the core CPI (excluding fresh food) rising from 3.2% yoy to 3.5% yoy, beating expectations of 3.4% yoy and marking the highest level since January 2023. This keeps core inflation above the BoJ’s 2% target for over three years.
Core-core CPI, which excludes both food and energy, also ticked up from 2.9% yoy to 3.0% yoy, suggesting broader underlying price momentum. Headline CPI held steady at 3.6% yoy.
There were notable upward drivers in inflation. Energy prices surged 9.3% yoy, up from March’s 6.6% yoy. Food prices (excluding fresh items) jumped 7.0% yoy, up from 6.2% yoy. In particular, rice prices soared by 98.4% yoy, a seventh consecutive record high, reflecting persistent supply shortages.
However, services inflation, closely watched by BoJ as a wage-sensitive component, edged slightly lower to 1.3% from 1.4%, tempering some of the hawkish signals.
NZ retail sales rise 0.8% qoq in Q1, but ex-auto growth modest
New Zealand retail sales volumes rose a stronger-than-expected 0.8% qoq in Q1 to NZD 25B, offering a positive surprise relative to market expectations of flat growth.
According to Stats NZ, 10 of the 15 major retail industries saw increased activity, led by a 3.1% jump in motor vehicle and parts retailing and a 3.7% rise in pharmaceutical and other store-based sales. Clothing and accessories also saw a healthy 3.2% gain.
Despite the upbeat headline, underlying momentum appears less robust when excluding the volatile auto sector. Core retail sales rose just 0.4% qoq, sharply missing expectations of a 1.5% qoq rise.
Economic indicators spokesperson Michelle Feyen noted that growth was "modest" and broad-based.
USD/CAD Daily Outlook
Daily Pivots: (S1) 1.3840; (P) 1.3864; (R1) 1.3883; More...
Intraday bias in USD/CAD remains mildly on the downside at this point. Deeper decline should be seen for retesting 1.3479 low, or further to 1.3727 key fibonacci level. Nevertheless, break of 1.3888 minor resistance will turn bias back to the upside, to extend the corrective pattern from 1.3749 with another rising leg.
In the bigger picture, price actions from 1.4791 medium term top could either be a correction to rise from 1.2005 (2021 low), or trend reversal. In either case, further decline is expected as long as 1.4150 resistance turned support holds. Firm break of 38.2% retracement of 1.2005 (2021 low) to 1.4791 at 1.3727 will pave the way back to 61.8% retracement at 1.3069.
Sticky inflation persist as Japan’s core CPI climbs to 3.5%
Japan’s inflation pressures remained elevated in April, with the core CPI (excluding fresh food) rising from 3.2% yoy to 3.5% yoy, beating expectations of 3.4% yoy and marking the highest level since January 2023. This keeps core inflation above the BoJ’s 2% target for over three years.
Core-core CPI, which excludes both food and energy, also ticked up from 2.9% yoy to 3.0% yoy, suggesting broader underlying price momentum. Headline CPI held steady at 3.6% yoy.
There were notable upward drivers in inflation. Energy prices surged 9.3% yoy, up from March’s 6.6% yoy. Food prices (excluding fresh items) jumped 7.0% yoy, up from 6.2% yoy. In particular, rice prices soared by 98.4% yoy, a seventh consecutive record high, reflecting persistent supply shortages.
However, services inflation, closely watched by BoJ as a wage-sensitive component, edged slightly lower to 1.3% from 1.4%, tempering some of the hawkish signals.