
Sample Category Title
(ECB) Monetary policy accounts
Account of the monetary policy meeting of the Governing Council of the European Central Bank held in Frankfurt am Main on Wednesday and Thursday, 16-17 April 2025
22 May 2025
1. Review of financial, economic and monetary developments and policy options
Financial market developments
Ms Schnabel recalled that President Trump’s announcement on 2 April 2025 of unexpectedly high tariffs had sparked a sharp sell-off in global equity markets and in US bond markets, leading to a surge in financial market volatility. The severity of the tariffs and the manner in which they had been introduced had led to a breakdown of standard cross-market correlations, with a sell-off of US equities occurring at the same time as a sell-off of Treasuries in the context of a marked depreciation of the US dollar against major currencies.
Movements in euro area risk-free rates reflected the opposing impacts of the historic German fiscal package and the global trade conflict. At the long end of the yield curve, the expected positive growth impulse from fiscal policy, as well as expectations of tighter monetary policy in the future, had been the dominant factors, pulling up nominal and real interest rates. At the short end of the yield curve, the decline in inflation compensation, driven mainly by falling inflation risk premia, had been larger than the rise in real yields, leading to a decline in nominal rates. These developments reflected both the negative fallout from tariffs and lower commodity prices. Investors expected the ECB to react to the evolving situation by lowering rates more than had previously been anticipated, but to start raising them again in the coming year. Amid the market turbulence, euro area bond markets had continued to function smoothly, and the bond supply had been absorbed well in the context of strong investor demand and well-functioning dealer intermediation. On the back of the sharp correction in stock prices and the marked appreciation of the euro exchange rate, financial conditions in the euro area had tightened, despite lower nominal short-term rates.
Turning to market developments since the previous Governing Council meeting, President Trump’s announcement on 2 April 2025 had led the VIX volatility index to temporarily reach levels not seen since the COVID-19 pandemic. Within a few days the S&P 500 index had dropped by 12%, triggering sharp corrections in stock markets around the world, including in the euro area. Despite a rebound after the pausing of “reciprocal” tariffs on 9 April 2025, the US benchmark equity index had lost 8% in the year to date while euro area stock markets were almost back to the levels seen at the start of the year. Stocks in trade-sensitive US sectors had been hit much harder than other stocks, and they had also dropped by much more than their euro area counterparts.
The market turbulence had spilled over to government bond markets, but the reaction had differed markedly between the euro area and the United States. US government bond yields had risen at the same time as the US equity sell-off, which was highly unusual because Treasury bonds normally benefited from safe-haven flows. US ten-year asset swap spreads had likewise risen sharply, which was also unusual. Meanwhile, Bund yields had declined and the spread between the Bund and overnight index swap (OIS) rates had narrowed substantially as German government bonds had continued to perform their role as a safe-haven asset.
The risk-off sentiment had also affected the dynamics of the US dollar exchange rate, but this too had reacted differently from what would normally have been expected. In January 2025 the EUR/USD exchange rate had hit a low of 1.02, but the euro’s downward trend had been reversed around the time of the announcement in early March 2025 of the reform of the German debt brake, with a positive growth narrative for Europe emerging in light of higher defence and infrastructure spending. The euro exchange rate had received a second major boost after the 2 April tariff announcement in the United States. This strong upward move had not been driven, as was usually the case, by changes in the yield differential, which had moved in the opposite direction, but by US dollar weakness as investors had revised down their US growth expectations. Over recent weeks the US dollar had thus not benefited from the widespread risk-off mood.
Recent developments had been reflected in global portfolio flows. The March 2025 round of the Bank of America Fund Manager Survey had recorded the strongest shift out of US equities on record, with 45% of managers reporting that they had reduced their positions. At the same time, a significant share of fund managers had reported that they had changed their positioning in favour of euro area equities. This marked a significant shift of perspectives away from US exceptionalism towards Europe being seen as the bright spot among major economies, given the expected fiscal boost in Germany and the pick-up in European defence spending.
Dynamics in risk-free bond markets illustrated the opposing impacts of the German fiscal package and the tariff announcements over recent weeks. In the euro area, the overall increase in longer-term nominal interest rates had been driven by a rise in real rates, indicating that market participants viewed the German fiscal package as fostering long-term growth. Real rates had kept rising during the tariff tensions, as investors had continued to expect, on balance, an improved growth outlook for the euro area. By contrast, inflation compensation had decreased across the yield curve after increasing only briefly in response to the German fiscal package.
Ms Schnabel then turned to the drivers of developments in euro area inflation compensation. On the one hand, bond market investors were pricing in higher inflation compensation owing to the expansionary German fiscal measures to be implemented over the next decade. On the other hand, concerns about the trade war had pulled inflation compensation lower, more than compensating for the impact of the German fiscal package on short to medium-term maturities. One important driver of the downward revision had been the sharp drop in oil prices in the wake of the tariff announcements and rising fears of a global recession.
Market participants currently expected the ECB to implement a faster and deeper easing cycle towards a terminal rate of around 1.7% in May 2026. However, the ECB was expected to start raising rates again in 2026 in a J-curve pattern, with rate expectations picking up notably over longer horizons.
In corporate bond markets, credit spreads had increased globally in response to the risk-off sentiment and the sharp sell-off in risk asset markets. However, the surge in US investment-grade corporate bond spreads had been more pronounced compared with developments in their euro area counterparts.
Sovereign spreads had remained resilient over the past few weeks. The marked rise in the Bund yield after the announcement of the German fiscal package in March 2025 had not translated into an increase in sovereign spreads, which had even declined slightly at that time. The benign reaction of euro area government bond markets over recent weeks could be explained by expectations of positive economic spillovers from Germany to the rest of the euro area, possible prospects of increased European unity and, in the case of Italy, positive rating action.
Government bond issuance in the euro area had continued to be absorbed well as investor demand had remained robust, with primary and secondary markets continuing to function smoothly. Higher volatility in government bond markets had not led to a meaningful deterioration in liquidity conditions, unlike in previous stress episodes. Hence, the turbulence in US Treasury markets had not had repercussions for the functioning of euro area sovereign bond markets.
Ms Schnabel concluded by considering the implications of recent market developments for overall financial conditions. Since the March monetary policy meeting financial conditions had tightened, mainly owing to lower equity prices and a stronger nominal effective exchange rate of the euro, which had more than compensated for the easing impulse stemming from lower nominal short-term interest rates. Real rates had gradually shifted up across the yield curve. Overall, recent market developments might not only be a reflection of short-term market disturbances but also of a broader shift in global financial markets, with the euro area being one potential beneficiary.
The global environment and economic and monetary developments in the euro area
Starting with inflation in the euro area, Mr Lane stated that the disinflation process was well on track. Inflation had continued to develop as expected, with both headline inflation in the Harmonised Index of Consumer Prices (HICP) and core inflation (HICP inflation excluding energy and food) declining in March. Headline inflation had declined to 2.2% in March, from 2.3% in February. Energy inflation had decreased to -1.0%, in part owing to a sharper than expected decline in oil prices, while food inflation had increased to 2.9% on the back of higher unprocessed food prices. Core inflation had declined to 2.4% in March, from 2.6% in February. While goods inflation remained stable at 0.6%, there had been a marked downward adjustment in services inflation, which had dropped to 3.5% in March from 3.7% in February, confirming the more muted repricing momentum in some services that had been expected.
Most exclusion-based measures of underlying inflation had eased further in March. The Persistent and Common Component of Inflation (PCCI), which had the best predictive power for future headline inflation, had decreased to 2.2% in March from 2.3% in February. Domestic inflation was unchanged in March after declining to 3.9% in February, down from 4.0% in January. The differential between domestic inflation and services inflation reflected the significant deceleration of inflation in the traded services segment seen in the recent data.
Wage growth was moderating. The annual growth rate of compensation per employee had declined to 4.1% in the fourth quarter of 2024, down from 4.5% in the third quarter and below the March 2025 projection of 4.3%. Negotiated wage growth had also come in at 4.1% in the fourth quarter of 2024. According to the April round of the Corporate Telephone Survey, leading non-financial corporations in the euro area had reduced their wage growth expectations for 2025 to 3.0%, down from 3.6% in the previous survey round. Respondents to the Survey on the Access to Finance of Enterprises had marked down their wage growth expectations for the next 12 months to 3.0%, from 3.3% in the last survey round. Looking ahead, the ECB wage tracker also pointed to a substantial decrease in annual growth of negotiated wages between 2024 and 2025, with one-off payments becoming a less dominant component of salary increases. Wage expectations reported in the Survey of Professional Forecasters and the Consensus Economics survey also signalled an easing of labour cost growth in 2025 compared with last year (between 0.7 and 1.0 percentage point), which was broadly in line with the March projections.
Looking ahead, inflation was expected to hover close to the inflation target of 2% for the remainder of the year. Core inflation, and in particular services inflation, was expected to decline until mid-2025 as the effects from lagged repricing faded out, wage pressures receded, and past monetary policy tightening continued to feed through. Surveys confirmed this overall picture, while longer-term inflation expectations had remained well anchored around the 2% target. At the same time, market participants had markedly revised down their expectations for inflation over shorter horizons, with the one-year forward inflation-linked swap rates one year ahead, two years ahead and four years ahead declining by around 20 basis points to 1.6%, 1.7% and 1.9% respectively.
Global growth was expected to have maintained its momentum in the first quarter of the year, with the global composite output Purchasing Managers’ Index (PMI) released on 3 April averaging 52.0. The manufacturing PMI had been recovering and stood above the threshold indicating expansion, while the services PMI had lost some momentum in advanced economies. However, global growth was likely to be negatively affected by the US-initiated increases in tariffs and the resulting financial market turmoil, which had come against the backdrop of already elevated geopolitical tensions.
Triggered by concerns about global demand, oil and gas prices, along with other commodity prices, had declined sharply since 2 April. Compared with the assumption for the March projections, Brent crude oil prices were now approximately 10% lower in US dollar terms and 18.3% lower in euro terms. Gas prices stood 37% below the value embedded in the March projections. The euro had strengthened over recent weeks as investor sentiment had proven more resilient towards the euro area than towards other economies, with the EUR/USD exchange rate up 9.6% and the nominal effective exchange rate up 5.5% compared with the assumptions for the March projections.
Euro area economic growth had slowed to 0.2%, quarter on quarter, in the fourth quarter of 2024, down from 0.4% in the third quarter. This figure was 0.1 percentage points higher than had been foreseen in the March projections. As projected, growth had been entirely driven by domestic demand. The economy was also likely to have grown in the first quarter of the year, and manufacturing had shown signs of stabilisation. The initial tariff announcements by the United States in early 2025 had so far seemed not to have materially dampened economic sentiment and might even have led to some frontloading of trade. However, some more recent surveys indicated a decline in sentiment. These included the latest Consumer Expectations Survey, the ZEW Indicator of Economic Sentiment and the Sentix Economic index.
The labour market remained resilient. The unemployment rate had edged down to 6.1% in February. At the same time, labour demand was cooling. The job vacancy rate had remained unchanged at 2.5% in the fourth quarter of 2024 and now stood 0.8 percentage points below its peak in the second quarter of 2022. Total job postings and new postings were 16% and 26% lower respectively compared with a year ago. Additionally, fewer firms had reported that labour was a limiting factor for production. The employment PMI had remained broadly neutral in March at 50.4, pointing to stable employment conditions in the first quarter of 2025.
Fiscal policies were identified as another potential source of resilience. Newly announced government measures were expected to have a relatively limited impact on the fiscal stance of the euro area compared with the assessment included in the March projections. But the scope for infrastructure investment and climate transition investment, as well as spending on defence in the largest euro area economy, had been substantially increased as a result of the loosening of the German debt brake, together with enhanced flexibility for greater spending on defence across euro area countries as a result of EU initiatives.
The economic outlook was clouded by exceptional uncertainty, however. Downside risks to economic growth had increased. The major escalation in global trade tensions and the associated uncertainty were likely to lower euro area growth by dampening exports and investment. Deteriorating financial market sentiment could lead to tighter financing conditions and increased risk aversion, and could make firms and households less willing to invest and consume. Geopolitical tensions, such as Russia’s unjustified war against Ukraine and the tragic conflict in the Middle East, also remained a major source of uncertainty. At the same time, an increase in defence and infrastructure spending would add to growth.
Increasing global trade disruptions were adding more uncertainty to the outlook for euro area inflation. Falling global energy prices and the appreciation of the euro could put further downward pressure on inflation. This could be reinforced by lower demand for euro area exports owing to higher tariffs and by a re-routing of exports into the euro area from countries with overcapacity. Adverse financial market reactions to the trade tensions could weigh on domestic demand and thereby also lead to lower inflation. By contrast, a fragmentation of global supply chains could raise inflation by pushing up import prices. A boost in defence and infrastructure spending could also raise inflation over the medium term. Extreme weather events, and the unfolding climate crisis more broadly, could drive up food prices by more than expected.
Turning to the monetary and financial analysis, risk-free interest rates had declined in response to the escalating trade tensions. However, the risk-free ten-year OIS rate was about 20 basis points higher than at the cut-off date for the March projections. Bank bond spreads had increased by nearly 30 basis points. Credit spreads had increased by 23 basis points for investment-grade corporate bonds and by as much as 95 basis points for the high-yield segment. The Eurostoxx index had fallen by around 4.8% since the cut-off date for the March projections, while indicators of market volatility had increased.
The latest information on the availability and cost of credit for the broader economy predated the market tensions but continued to indicate a gradual normalisation in credit conditions, though with some mixed evidence. The interest rate on new loans to firms had declined by 15 basis points in February, to 4.1%, which was about 120 basis points below its October 2023 peak. However, interest rates on new mortgages had increased by 8 basis points in February, to 3.3%, which was around 70 basis points below their November 2023 peak. Loan growth was picking up at a moderate pace. Annual growth in bank lending to firms had increased to 2.2% in February, from 2.0% in January, amid marked month-on-month volatility. Corporate debt issuance had been weak in February, but the annual growth rate had stabilised at 3.2%. Lending to households had edged up further to 1.5% on an annual basis in February, from 1.3% in January, led by mortgages. According to the latest bank lending survey for the euro area, which had been conducted between 10 and 25 March 2025, credit standards had tightened slightly further for loans to firms and consumer credit in the first quarter, while there had been an easing of credit standards for mortgages. This evidence resonated with the results of the Survey on the Access to Finance of Enterprises, which also showed almost unchanged availability of bank loans to firms in the first quarter, owing to concerns about the economic outlook and borrower creditworthiness, compounded by high uncertainty.
Monetary policy considerations and policy options
In summary, the incoming data confirmed that the disinflation process remained well on track. Both headline and core inflation in March had come in as expected. In particular, the projected drop in services inflation in March had been confirmed in the data and underpinned confidence in the underlying downward trajectory. The more forward-looking indicators of underlying inflation remained consistent with inflation settling at around the target in a sustained manner, with domestic inflation also coming down on the back of lower labour cost growth, which was decelerating somewhat faster than had been expected. The euro area economy had been building up some resilience against global shocks, but the outlook for growth had deteriorated materially owing to rising trade tensions. Increased uncertainty was likely to reduce confidence among households and firms, and the adverse and volatile market response to the recent trade tensions was likely to have a tightening impact on financing conditions and thereby further weigh on the euro area economic outlook.
Based on this assessment, Mr Lane proposed lowering the three key ECB interest rates by 25 basis points. In particular, lowering the deposit facility rate – the rate through which the Governing Council steered the monetary policy stance – was rooted in its updated assessment of the inflation outlook, the dynamics of underlying inflation and the strength of monetary policy transmission. A further cut at the present meeting was important in ensuring that inflation stabilised at the target in a sustainable manner, while also avoiding the possibility that external adverse shocks to the economic outlook could be exacerbated by too high a level of the policy rate.
Looking ahead, it remained more important than ever to maintain agility in adjusting the stance as appropriate on a meeting-by-meeting basis and to not pre-commit to any particular rate path.
2. Governing Council’s discussion and monetary policy decisions
Economic, monetary and financial analyses
Regarding global conditions, members stressed that the outlook for global growth was highly uncertain. In reaction to the frequent – and often contradictory – tariff announcements and retaliation over the last few weeks, the International Monetary Fund was currently revising its World Economic Outlook. Since the Governing Council’s last monetary policy meeting the euro had appreciated by 4.2% in nominal effective terms and by 6.4% against the US dollar, driven by market expectations of a narrowing growth differential between the euro area and the United States and possibly by a broad-based investor reassessment of the risk attached to exposures to the United States. Energy and food commodity prices had also declined sharply owing to growth concerns as the trade war intensified. The combined effect of a weakening dollar and declining oil and gas prices meant that, in euro terms, oil prices had fallen by 18.3% and gas prices by 37% since the March Governing Council meeting. Macroeconomic data did not yet reflect fully the ongoing trade war, which would only show through more clearly in the data during the second quarter of 2025. The composite output PMI for global activity excluding the euro area had remained broadly stable in March.
Global trade was expected to slow significantly. This reflected lower imports primarily from the United States, China, Mexico and Canada – all countries with sizeable reciprocal trade relations. In the first quarter trade had still been strong owing to a rebound at the beginning of the year, in part driven by a frontloading of imports in anticipation of future tariffs. However, high-frequency and more timely data (based on vessel movements) had already started weakening, in particular for US imports. Private sector forecasts for US growth in 2025 had started trending down in the run-up to the 2 April tariff announcement. However, that event, together with the deterioration in financial conditions that followed, had led to a further downward revision to US GDP growth prospects for this year, as the high uncertainty around US policies was expected to hold back investment and economic activity. In this context the impact of the confidence channel was regarded as particularly important. While most economists had assumed that with higher tariffs and a trade war the US dollar would appreciate, the latest developments pointed to adverse confidence effects and the self-defeating nature of tariffs weakening the dollar. Private sector forecasts for Chinese growth in 2025 had also been revised down since early April, as the contribution from net exports – a key source of support for Chinese growth in 2024 – was expected to decline significantly this year. The Chinese Government’s announcement of additional fiscal support to boost consumption was seen as likely to only partially offset the loss of international trade.
In general, protectionism and policy unpredictability were seen as the ultimate sources of distress. This raised the question of whether the impact of these factors could unwind when the policy approach that had generated them might reverse. Indeed, the view was expressed that mutually beneficial trade agreements could be reached, leading to a much more benign outcome. At the same time, it was argued that, first, a complete unwinding of the 2 April tariff policy announcement was unlikely and, second, even in the event of a complete policy turnaround, it was questionable whether the world economy could return to its previous status quo.
The recent strong appreciation of the euro was largely explained by portfolio rebalancing due to growing concerns among investors about US economic policies and the risks that these posed to large exposures to the United States. Overall, the current state of the world economy was not regarded as being at an equilibrium, and it might take several years before the global economy reached a new equilibrium. For a long time the world had been in a configuration centred on the United States running large current account deficits, with optimistic consumers, high private sector investment rates and a large fiscal deficit.
Looking ahead, two polar scenarios could be seen. One was a stabilisation of the situation, whereby the US current account deficit was structural and largely financed by capital inflows. In this situation, the ongoing portfolio rebalancing across currencies would eventually reverse in favour of the United States, leading to a renewed real appreciation of the US dollar, partly driven by relative price adjustments. However, recent events had eroded trust in the US system, and it was challenging to envisage how it might be restored.
The other possible direction that the global order could take was a continuation of current rebalancing trends. Such a situation could lead temporarily to much higher US inflation as a result of the combined effects of tariffs and a potentially weaker exchange rate. More generally, the new equilibrium could entail high tariffs, an increase in home bias – for trade balance or security reasons – and a more fragmented world. This more fragmented environment was likely to be characterised by stronger inflationary pressures. In addition, the move to a new equilibrium would involve costly adjustment dynamics, as firms, households and governments would have to re-optimise in light of the new constellation, but also owing to the high levels of uncertainty in the transition period. In the meantime, the erosion of confidence in the US economy and in the global order of international trade and finance was expected to result in a higher global cost structure arising from protectionist policies and a higher risk premium arising from unpredictability. An intermediate scenario was also possible, in which the euro would become increasingly attractive, thus expanding its international role as a reserve currency.
Overall, even if it was known with certainty where the new equilibrium lay, there would still be major adjustment dynamics along the way. In addition, as global supply chains had been shaped over the years to best adapt to the old equilibrium, they would need to adjust to the new one, with a likely loss of market value for those firms that had been most engaged in the old global order. Throughout this process there would be path dependence in the dynamics of the economy.
With regard to economic activity in the euro area, members concurred that the economic outlook was clouded by exceptional uncertainty. Euro area exporters faced new barriers to trade, although the scope and nature of those barriers remained unclear. Disruptions to international commerce, financial market tensions and geopolitical uncertainty were weighing on business investment. As consumers became more cautious about the future, they might hold back from spending, thus delaying further the more robust consumption-led recovery that the staff projections had been foreseeing for a number of projection rounds.
At the same time, the euro area economy had been building up some resilience against the global shocks. Domestic demand had contributed significantly to euro area growth in the fourth quarter of 2024, with business investment and private consumption growing robustly in spite of the already high uncertainty. The manufacturing output PMI had risen above 50 in March for the first time in two years, while the services business activity PMI had remained in expansionary territory, with relatively solid industrial production numbers confirming information from the soft indicators. While the trade conflict was a significant drag on foreign demand, the expected fiscal spending would counter some of those effects. The economy was likely to have grown in the first quarter of the year, and manufacturing had shown signs of stabilisation. Unemployment had fallen to 6.1% in February, its lowest level since the launch of the euro. Looking ahead, a strong labour market, higher real incomes and the impact of an easier monetary policy stance should underpin spending.
For the near term, it was argued that the likely slump in trade and the surge in uncertainty were hitting the euro area at a critical juncture, when the recovery was still weak and fragile. It was seen as becoming increasingly clear that the impact of the trade shock might be very strong in terms of activity in the United States, with potentially substantial spillovers to the euro area. Even with the additional spending on defence and infrastructure, it was likely that, on balance, euro area growth would be worse in 2025 than previously expected. Incorporating the impact from the most recent escalation of trade tensions, potential retaliatory measures from the EU and the financial market turbulence of recent weeks could weaken activity in 2025 significantly. As a result, it was suggested that the probability of a recession over the next four quarters in the euro area and the United States had increased measurably.
However, it was also argued that, while complicated, the situation still had upside potential. First, the strong market reaction might impose some discipline on the US Administration. Second, there was room for mutually beneficial trade agreements which would de-escalate the severity of the tariff increase threatened in the 2 April announcement. Regarding the fallout for growth, the ultimate effects of the new trade frictions would crucially depend on the substitutability of items imported by the United States. The bulk of exports from the euro area to the United States comprised pharmaceuticals, machinery, vehicles and chemicals, and these were highly differentiated products which were difficult to substitute away from in the short run. This rigidity would limit the drag on the euro area’s foreign demand. Moreover, the almost prohibitive tariffs between China and the United States were seen as likely to redirect demand towards euro area firms.
A further factor that could attenuate the repercussions of trade frictions and uncertainty was the announcement of the German fiscal package and the step-up in European defence spending, which would raise domestic demand. This new factor was seen as unmitigated good news, as it would help to revive the European growth narrative and foster confidence in the euro area. What mattered was not only the direct effects of fiscal spending on demand and activity, but also the expected crowding-in of private investment in anticipation of the future fiscal stimulus. In the Corporate Telephone Survey, firms were already reporting that they were planning to enhance capacity in view of the defence and infrastructure initiatives. The Survey on the Access to Finance of Enterprises also pointed to greater optimism among firms on investment. Construction was set to recover further. It was therefore argued that the negative impact of tariffs could be seen as more or less the same size as the positive impact coming from the fiscal expansion in Germany. Of course, the time profiles of the impacts of the two major shocks – tariff increases and fiscal stimulus – were different. In the short term the negative effects on demand would dominate, as additional investment in defence and infrastructure would take time to come on stream and support growth.
At the same time, the view was expressed that even in the medium term defence spending would not be a clear game changer, because it would not only materialise with a delay, but would likely lift euro area GDP growth by at most a couple of tenths of a percentage point. In any case, the fiscal stimulus was still uncertain in terms of its scale and modalities of implementation. In this context, it was noted that the reaction of the markets to the fiscal announcement from Germany suggested that the euro area economy was likely to respond to the new fiscal impulse with an increase in GDP and only a very mild increase in inflation. This demonstrated that the euro area economy was not seen as constrained by structural problems.
Overall, members assessed that downside risks to economic growth had increased. The major escalation in global trade tensions and associated uncertainties would likely lower euro area growth by dampening exports, and it might drag down investment and consumption. Deteriorating financial market sentiment could lead to tighter financing conditions, increase risk aversion and make firms and households less willing to invest and consume. Geopolitical tensions, such as Russia’s unjustified war against Ukraine and the tragic conflict in the Middle East, also remained a major source of uncertainty. At the same time, an increase in defence and infrastructure spending would add to growth.
In view of all the uncertainties surrounding the outlook, the view was expressed that for the coming meetings of the Governing Council it was important to develop alternative scenarios. These should factor in the prevailing very high level of uncertainty and assist in identifying the relevant channels and quantifying the impact on growth, jobs and inflation. In addition to scenario analysis, it was important to use high-frequency and unconventional sources of information to better understand the direction the economy was taking. There was also a need to broaden the set of indicators to be monitored, given the challenges in interpreting some of the standard statistics which were influenced and distorted by special factors such as the frontloading of orders and the associated build-up of inventories.
A silver lining in the turbulent situation that Europe was facing was a strong impetus for European policymakers to swiftly implement the structural reforms set out in the reports by Mario Draghi and Enrico Letta. If effective, such concrete action had the potential to become a major tailwind for the euro area economy in the future, amplifying the stimulating effect of the additional fiscal spending that was planned in Germany. At the same time, it was cautioned that, to reap all the benefits from reform, Europe had to act quickly and on an ambitious scale.
The important policy initiatives that had been launched at the national and EU levels to increase defence spending and infrastructure investment could be expected to bolster manufacturing, which was also reflected in recent surveys. In the present geopolitical environment, it was even more urgent for fiscal and structural policies to make the euro area economy more productive, competitive and resilient. The European Commission’s Competitiveness Compass provided a concrete roadmap for action, and its proposals, including on simplification, should be swiftly adopted. This included completing the savings and investment union, following a clear and ambitious timetable, which should help savers benefit from more opportunities to invest and improve firms’ access to finance, especially risk capital. It was also important to rapidly establish the legislative framework to prepare the ground for the potential introduction of a digital euro. Governments should ensure sustainable public finances in line with the EU’s economic governance framework and prioritise essential growth-enhancing structural reforms and strategic investment.
With regard to price developments, members concurred with the assessment presented by Mr Lane. In spite of all remaining uncertainties, the recent inflation data releases had been broadly in line with the March ECB staff projections, with respect to both headline and core inflation. This suggested that inflation was on course for the 2% target, with long-term inflation expectations also remaining well anchored. Taking the February and March inflation data together, there was now much more confidence that the baseline scenario for inflation in the March projections was materialising. This held even without the appreciation of the euro or the decline in oil prices and commodity prices that had taken place since the finalisation of the projections.
Looking ahead, it was argued that inflation would likely be lower in 2025 than foreseen in the March projections if the exchange rate and energy prices remained around their current levels. Recent market-based measures of inflation expectations also indicated that inflation might be falling faster than previously assumed. Inflation fixings now implied that investors expected inflation (excluding tobacco) to remain just below 2% in 2025 and to decline to around 1.2% in early 2026, before returning to around 1.6% by mid-2026. This signalled that risks to price stability might now be tilted to the downside, especially in the near term. The latest information also suggested that wage growth was moderating at a slightly faster pace than previously expected. Over a longer horizon, the tighter financial conditions, including the appreciation of the euro, the sharp drop in oil and gas prices and the headwinds from weaker economic activity, were seen as important new factors dampening inflation. There was now a risk that inflation could fall well below 2% at least over the remainder of the current year. Trade diversion and price concessions by Chinese exporters could also compound the ongoing depreciation of the renminbi and exert further downward effects on inflation, if not countered by measures by the European Commission. If there were to be retaliation against the tariffs imposed on US imports from the euro area, the direct inflationary impact could be counterbalanced by other factors, including the exchange rate, weaker raw material prices or possibly tighter financial conditions. Over the short term, the countervailing effects from increased fiscal spending were, moreover, unlikely to offset the further disinflationary pressures emanating from the international environment.
At the same time, it was underlined that upside risks had not vanished. The rising momentum that had been detected in the PCCI indicators of underlying inflation warranted monitoring to confirm whether this increase was temporary and related to repricing early in the year in line with previous seasonal patterns. Although market-based measures of inflation compensation had fallen significantly, owing to lower inflation risk premia, genuine inflation expectations had been revised to a much lesser extent, and analysts’ inflation expectations were mostly well above inflation fixings. It also had to be considered that the likely re-flattening of the Phillips curve, which reflected among other things less frequent price adjustments, implied that meaningful downward deviations of inflation from target were unlikely in the absence of a deep and protracted recession. But such an event had a low probability in light of the expected fiscal impulse. In addition, the precise impact of the stronger euro was uncertain, especially given that one of the reasons behind the appreciation was a positive confidence shock as Europe offered stability in turbulent times. Moreover, successful trade negotiations and the resolution of trade disputes could give a boost to energy prices, changing the inflation picture very quickly. Finally, while the newly announced fiscal stimulus was unlikely to cause inflationary pressure over the short term in view of the underutilised capacities, the economy was likely to bump up against capacity constraints over the medium term, especially in the labour market. Indeed, inflation expectations reported in the Consumer Expectations Survey, the Survey on the Access to Finance of Enterprises and the Survey of Professional Forecasters remained tilted to the upside over longer horizons. It was argued that, taken as a whole, the current environment posed some downside risks to inflation over the short run, but notable upside risks over the medium term. If retaliation against US tariffs affected products that were hard to substitute, such as intermediate goods, the inflationary impact could be sizeable and persistent as higher input costs from tariffs would be gradually passed on to consumers. This could more than offset the disinflationary pressure from reduced foreign demand. The closely interconnected global trade system implied that tariffs might be passed along entire supply chains. The need to absorb tariffs in profit margins at a time when these were already squeezed because of high wage growth would increase the probability and strength of the pass-through. Upside risks to inflation over the medium term were seen to hold especially in a scenario in which the trade war led to a permanently more fragmented global economy, owing to a less efficient allocation of resources, more fragile supply chains and less elastic global supply.
Overall, increasing global trade disruptions were adding more uncertainty to the outlook for euro area inflation. Falling global energy prices and an appreciation of the euro could put further downward pressure on inflation. This could be reinforced by lower demand for euro area exports owing to higher tariffs and by a re-routing of exports into the euro area from countries with overcapacity. Adverse financial market reactions to the trade tensions could weigh on domestic demand and thereby also lead to lower inflation. By contrast, a fragmentation of global supply chains could increase inflation by pushing up import prices. A boost in defence and infrastructure spending could also lift inflation over the medium term. Extreme weather events, and the unfolding climate crisis more broadly, could drive up food prices by more than expected.
Turning to the monetary and financial analysis, members highlighted that the period since the 5-6 March meeting had been characterised by exceptional financial market volatility. This had led to some financial data indicating sizeable daily moves that were several standard deviations away from their mean. Risk-free interest rates had declined since the March meeting in response to the escalating trade tensions, although long-term risk-free rates were still higher than at the cut-off date for the March staff projections. Equity prices had fallen amid high volatility and corporate bond spreads had widened around the globe. Partly in response to the turmoil, financial markets were now fully pricing in the expectation of a 25 basis point rate cut at the current meeting.
The euro had strengthened considerably over recent weeks as investor sentiment proved more resilient towards the euro area than towards other economies. While the appreciation of the euro had been sizeable, since the inception of the euro the bilateral EUR/USD exchange rate had fluctuated in a relatively wide band, with the rate currently somewhere in the middle of the range. The recent adjustment across asset prices was atypical, as the financial market turbulence had come together with a rebalancing of international portfolios away from US assets towards exposures to other regions, such as the euro area. One explanation, which was supported by the coincidental weakening of the US dollar and by some initial market intelligence, was that domestic and foreign investors had moved out of US assets, possibly reflecting a loss of confidence in US fiscal and trade policies.
Turning to broader financing conditions, the latest official statistics on corporate borrowing, which predated the market tensions, continued to indicate that past interest rate cuts had made it less expensive for firms to borrow. The average interest rate on new loans to firms had declined to 4.1% in February, from 4.3% in January. The cost to firms of issuing market-based debt had declined to 3.5% in February but there had been some upward pressure more recently. Moreover, growth in lending to firms had picked up again in February, to 2.2%, while debt securities issuance by firms had grown at an unchanged rate of 3.2%. At the same time, credit standards for business loans had tightened slightly again in the first quarter of 2025, as reported in the April round of the bank lending survey. This was mainly because banks were becoming more concerned about the economic risks faced by their customers. Demand for loans to firms had decreased slightly in the first quarter, after a modest recovery in previous quarters.
The average rate on new mortgages, at 3.3% in February, had risen on the back of earlier increases in longer-term market rates. Mortgage lending had continued to strengthen in February, albeit at a still subdued annual rate of 1.5%, as banks had eased their credit standards and households’ demand for loans had continued to increase strongly.
Monetary policy stance and policy considerations
Turning to the monetary policy stance, members assessed the data that had become available since the last monetary policy meeting in accordance with the three main elements that the Governing Council had communicated in 2023 as shaping its reaction function. These comprised (i) the implications of the incoming economic and financial data for the inflation outlook, (ii) the dynamics of underlying inflation, and (iii) the strength of monetary policy transmission.
Starting with the inflation outlook, members widely agreed that the latest data, including the HICP inflation figures for February and March and recent outturns for services inflation, provided further evidence that the disinflationary process was well on track. They thus expressed increased confidence that inflation would return to target in line with the March baseline projections.
However, the March baseline projections had not incorporated the latest US policy announcements, which had increased downside risks to growth and inflation over the short term. The most recent forces at play, such as the negative demand shock linked to the tariff proposals and the related pervasive uncertainty, the appreciation of the euro and the decline in oil and gas prices, would further dampen the inflation outlook in the near term.
Over the medium term the picture for inflation remained more mixed, as the effects of fiscal spending, retaliatory tariffs and the disruption of value chains might point in different directions, with each shock having an impact on growth and inflation with a different time profile. It was pointed out that the inflationary effects of tariffs might outweigh the disinflationary pressure from reduced foreign demand over the medium term, especially if the European Union retaliated by imposing tariffs on products that were not easily substitutable, such as intermediate goods. As a result, firms might suffer from rising input costs that would, over time, be passed on to consumers as the erosion of profit margins made cost absorption difficult. If this occurred at the same time as the support to economic activity from fiscal policy kicked in, there would be a significant risk of higher inflation. Overall, it was too early to draw firm conclusions at a time when many trade policy options were still on the table.
Turning to underlying inflation, members concurred that most indicators were pointing to a sustained return of inflation to the 2% medium-term target. Wage growth had been slowing further – slightly faster than expected. In view of the high uncertainty, companies were also likely to be cautious about accepting high wage demands. Domestic inflation had remained unchanged, after falling slightly in February. This suggested that inflation had been quite stubborn despite the marked decline in services inflation, although progress had also been seen in this indicator when looking back over the past six months. The PCCI, which had the best leading indicator properties for inflation and still showed rising momentum, warranted further monitoring.
Finally, incoming data confirmed that the transmission of monetary tightening remained largely as intended. Bank credit growth was overall on a gradual, slow recovery path, although from quite subdued levels. Nevertheless, it was increasing somewhat more strongly than had previously been expected for both non-financial corporations and households. There had been an easing of credit standards and strong demand for housing loans, which could foreshadow a pick-up in construction activity. At the same time, market-based indicators pointed to a tightening of financial conditions and, despite recent interest rate cuts, the latest round of the bank lending survey pointed to tighter credit standards for both firms and consumer credit. This was due to anticipated higher default risks against a background of weaker growth. Moreover, uncertainty had been very high and, in the presence of high uncertainty, the response of intermediaries to lower risk-free rates and, more generally, the transmission mechanism of monetary policy, were seen as more sluggish.
Monetary policy decisions and communication
Against this background, all members agreed with the proposal by Mr Lane to lower the three key ECB interest rates by 25 basis points. In particular, lowering the deposit facility rate – the rate through which the Governing Council steered the monetary policy stance – was justified by the updated assessment of the inflation outlook, the dynamics of underlying inflation and the strength of monetary policy transmission. Members expressed increased confidence that inflation would return to target over the medium term and that the fight against the inflation shock was nearly over.
Some members indicated that, before the US tariff announcement on 2 April, they had considered a pause to rate cuts at the current meeting to be appropriate, preferring to wait for the next round of projections for greater clarity on the medium-term inflation outlook. These members attached a higher probability to the possibility that the trade shock would be inflationary beyond the short term, in view of the destructive effects of breaking up global value chains. While the inflationary effects of the proposed tariffs might differ for the United States and Europe, the pandemic experience had shown that, despite different weights attached to demand versus supply factors, in the end inflation developments in the two economies had been quite synchronous, and the same might occur again this time. Overall, this pointed to upside risks to inflation in the medium to long term that counterbalanced the downside risks stemming from weaker economic activity. However, recent events had convinced these members that cutting interest rates at the current meeting provided some insurance against negative outcomes and avoided contributing to additional uncertainty in times of financial market volatility. In addition, a cut at the present meeting could be seen as frontloading a possible cut at the June meeting, which underlined the need to retain full optionality for the upcoming meetings.
At the same time, it was felt that the tariff tensions did not seem to come with the inflationary effects that many members had previously associated with such an event, at least not over the short to medium-term horizons. In part, this was because the euro was seemingly turning into more of a safe-haven currency and was subject to revaluation pressures. Disinflationary forces were thus likely to dominate in the short term. In addition, the growth outlook had weakened, with tariffs, related uncertainty and geopolitical tensions acting as a drag. In this regard, it was argued that a 25 basis point rate cut would lean against the substantial risks to growth in the short term and the tightening of financial conditions that had resulted from the tariff events, without the risk of fuelling inflation further down the line.
In these turbulent times, members stressed the need to be a beacon of stability, thus instilling confidence and not causing more surprises in an already volatile environment, which might amplify market turbulence. This spoke in favour of a 25 basis point cut.
A standard 25 basis point rate reduction was seen as consistent with the fact that, while very uncertain, the range of potential outcomes from the current situation still entailed some upside risks to inflation for the euro area economy. On the one hand, countervailing forces that would bring the US Administration to change course could eventually emerge. One such force had been the observed outflows from the US Treasuries market, which might have contributed to the 90-day pause applied to most US tariffs. On the other hand, there had been – and could be further – mitigating factors in the euro area. These included a more growth-supportive fiscal outlook as well as an opportunity to make swift progress on other European policy initiatives. Another factor potentially protecting against more adverse scenarios could be a stronger commitment by the Chinese Government to domestic demand-led growth in China. In addition, a possible structural increase in international demand for the euro, while entailing downside risks to inflation, was also a symptom of a largely positive development, namely a shift into European assets. A portfolio shift could lower long-term interest rates in the euro area and lead to cheaper financing for planned investment projects. Finally, the appreciation of the euro would further reduce the price of energy imports in euro terms, which could counterbalance some of the negative effects of the tariffs and the exchange rate on energy-intensive exporters.
These arguments notwithstanding, a few members noted that they could have felt comfortable with a 50 basis point rate cut. These members attached more weight to the change in the balance of risks since the Governing Council’s March meeting, pointing out that downside risks to growth had increased and, even in the event of a relatively mild trade conflict, uncertainty was already discouraging consumption and investment. In this context, they emphasised that downside risks to inflation had clearly increased. The same members also argued that a larger interest rate cut could have offset more of the recent tightening of financial conditions, including higher corporate bond spreads and lower equity prices, which had weakened the transmission of past monetary policy decisions. In this respect it was argued that surprising the markets should not be excluded, and it was recalled that there had been previous cases in which the Governing Council had not shied away from surprises when appropriate.
At the same time, it was argued that the optimal monetary policy response depended on the outcome of tariff negotiations, including the scope of the tariffs and the extent of potential retaliation, and on how tariffs fed through global supply chains. The view was also expressed that a forward-looking central bank should only act forcefully to the tariff shock if it expected a sharp deterioration in labour market conditions or an unanchoring of inflation expectations to the downside. However, the initial conditions, featuring a still resilient labour market and elevated momentum in underlying inflation and services inflation, made such a scenario unlikely. Moreover, the economy was coming out of a high-inflation period with consumers’ and firms’ inflation expectations one year ahead still standing at almost 3%. In such a situation, an unanchoring of inflation expectations to the downside was highly unlikely, while the higher than expected food and services inflation in March and rising momentum in services underlined the continued need to monitor inflation developments. If the decline in economic activity turned out to be short-lived, an accommodative response of monetary policy might, given transmission lags, exert its peak impact when the economy was already recovering and inflation was rising, and would therefore be misguided. It could also coincide with when fiscal policy was starting to boost domestic demand, although anticipation channels could lead to some of the impact of infrastructure and defence spending on inflation being smoothed out and dampened in the medium term. Finally, it was argued that cutting interest rates further could no longer be justified by the intention to return to neutral territory since, by various measures, monetary policy was no longer restrictive. Bank lending was recovering, domestic demand was expanding and the level of interest rates was contributing measurably to demand for all types of loan, as shown in the most recent bank lending survey.
Looking ahead, members stressed that maintaining a data-dependent approach with full optionality at every meeting was warranted more than ever in view of the high uncertainty. Keeping a cautious approach and a firm commitment to price stability had contributed to the success so far, with inflation back on track despite unprecedented challenges. However, agility might be required in the present environment, with the need for the Governing Council to be ready to react quickly if necessary.
Turning to communication aspects, members noted that it was time to remove the phrase “our monetary policy is becoming meaningfully less restrictive” from the monetary policy statement. Reference to a restrictive policy stance, in various formulations, had proven useful over past phases in which inflation had still been high, providing a clear message that monetary policy was contributing to disinflation. Such a signal was no longer needed. In the present conditions, dropping the sentence avoided the perception that the neutral level of interest rates was the end point of the current cycle, which was not necessarily the case. However, dropping the sentence did not imply that monetary policy had necessarily left restrictive territory. At the current juncture, there was no need to take a stand on whether monetary policy was still restrictive, already neutral or even moving into accommodative territory. Such a categorisation, especially in the current turbulent context, was very hard to provide. Instead, the change in wording was seen as consistent with an approach that was not guided by interest rate benchmarks but by the need to always determine the policy stance that was appropriate. In other words, policy would be set so as to provide the strongest assurance that inflation would be anchored sustainably at the medium-term target, given the set of initial conditions and the shocks that the Governing Council had to tackle at any given time.
Members reiterated that the Governing Council remained determined to ensure that inflation would stabilise sustainably at its 2% medium-term target. Its interest rate decisions would continue to be based on its assessment of the inflation outlook in light of the incoming economic and financial data, the dynamics of underlying inflation and the strength of monetary policy transmission. While noting that markets were functioning in an orderly manner, it was seen as helpful to reiterate that the Governing Council stood ready to adjust all instruments within the ECB’s mandate to ensure that inflation stabilised sustainably at the medium-term target and to preserve the smooth functioning of monetary policy transmission.
Taking into account the foregoing discussion among the members, upon a proposal by the President, the Governing Council took the monetary policy decisions as set out in the monetary policy press release. The members of the Governing Council subsequently finalised the monetary policy statement, which the President and the Vice-President would, as usual, deliver at the press conference following the Governing Council meeting.
Monetary policy statement
Monetary policy statement for the press conference of 17 April 2025
Press release
Meeting of the ECB’s Governing Council, 16-17 April 2025
Members
- Ms Lagarde, President
- Mr de Guindos, Vice-President
- Mr Centeno*
- Mr Cipollone
- Mr Demarco, temporarily replacing Mr Scicluna*
- Mr Dolenc, Deputy Governor of Banka Slovenije
- Mr Elderson
- Mr Escrivá
- Mr Holzmann*
- Mr Kazāks
- Mr Kažimír
- Mr Knot*
- Mr Lane
- Mr Makhlouf
- Mr Müller
- Mr Nagel
- Mr Panetta
- Mr Patsalides
- Mr Rehn
- Mr Reinesch*
- Ms Schnabel
- Mr Šimkus
- Mr Stournaras
- Mr Villeroy de Galhau
- Mr Vujčić
- Mr Wunsch
* Members not holding a voting right in April 2025 under Article 10.2 of the ESCB Statute.
Other attendees
- Mr Dombrovskis, Commissioner**
- Ms Senkovic, Secretary, Director General Secretariat
- Mr Rostagno, Secretary for monetary policy, Director General Monetary Policy
- Mr Winkler, Deputy Secretary for monetary policy, Senior Adviser, DG Monetary Policy
** In accordance with Article 284 of the Treaty on the Functioning of the European Union.
Accompanying persons
- Mr Arpa
- Ms Bénassy-Quéré
- Mr Debrun
- Mr Gavilán
- Mr Kaasik
- Mr Kelly
- Mr Koukoularides
- Mr Kroes
- Mr Lünnemann
- Ms Mauderer
- Mr Martin
- Mr Nicoletti Altimari
- Mr Novo
- Mr Rutkaste
- Ms Schembri
- Mr Šiaudinis
- Mr Šošić
- Mr Välimäki
- Ms Žumer Šujica
Other ECB staff
- Mr Proissl, Director General Communications
- Mr Straub, Counsellor to the President
- Ms Rahmouni-Rousseau, Director General Market Operations
- Mr Arce, Director General Economics
- Mr Sousa, Deputy Director General Economics
Release of the next monetary policy account foreseen on 3 July 2025.
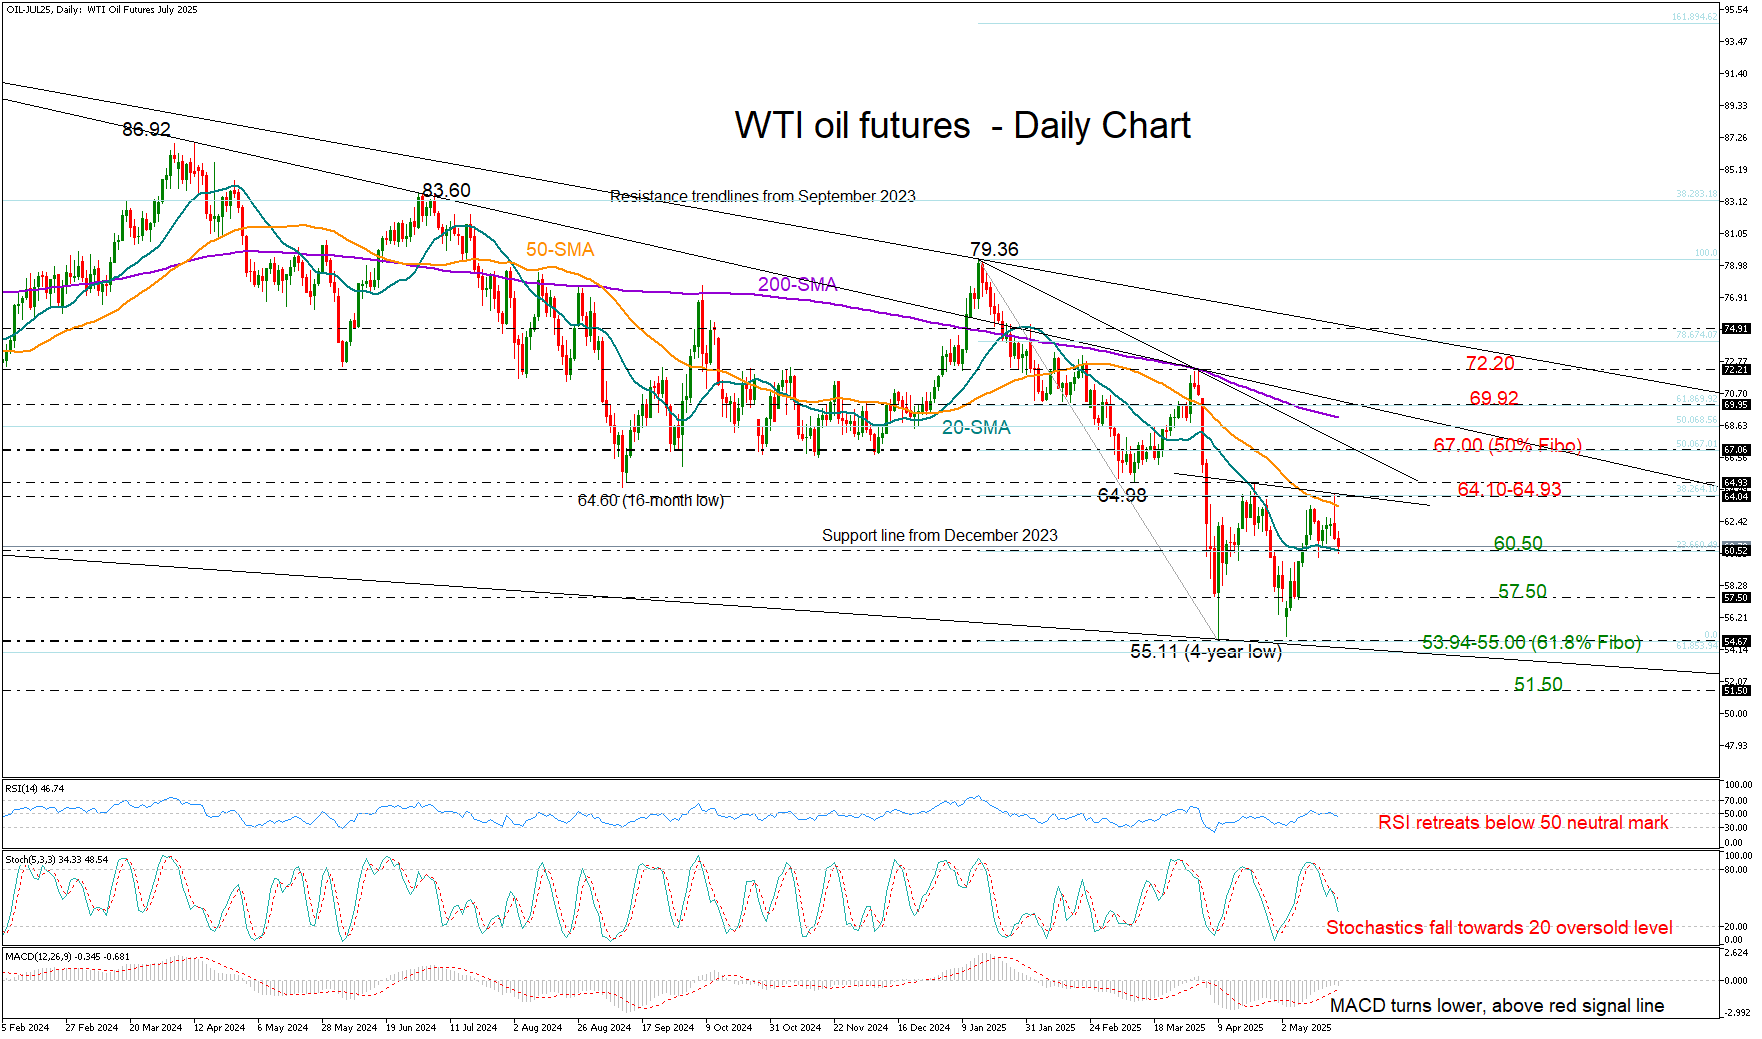
WTI Oil Futures Slide on OPEC Supply Outlook
- WTI Crude Oil pulls below 64.00 on supply increase prospects.
- Technical risk tilted to the downside; support at 60.50 tested.
WTI crude oil futures were rejected near the 64.00 psychological level on Wednesday and moved lower, as reports of a significant upcoming output hike by OPEC outweighed concerns about a potential Israeli strike on Iranian nuclear facilities.
From a technical standpoint, the short-term bias is leading bearish. The RSI is retreating below its neutral 50 mark, and the stochastic oscillator is falling but still positioned well above the 20 oversold threshold. This suggests that selling pressure could persist, especially if the 20-day simple moving average (SMA), currently near 60.50, fails to hold. A breakdown at that level could extend the decline toward the 57.50 support area.
Further losses could target the critical double bottom 53.94–55.00 zone, where the 61.8% Fibonacci retracement of the 2020–2022 uptrend coincides with the long-term descending trendline from 2023.
Conversely, if the price manages to break decisively above the 64.00–64.93 resistance band, the next obstacle could emerge around the tentative resistance trendline at 67.00. The 200-day SMA may also act as a barrier ahead of the 69.92 level.
In summary, downside risks remain prominent in the WTI crude oil market, despite the ongoing broad consolidation phase. A drop below 60.50 could play the next bearish episode.
Services Dragging Eurozone PMI Down
Flash Eurozone business activity moved into contractionary territory due to a sharp dip in the services sector.
The Euro-region manufacturing PMI rose to 49.4, the highest reading since August 2022, but still in contractionary territory as it is below 50. The index shows that the sector has been gaining momentum since last December, which can easily be linked to expectations of lavish spending by the new German government and potential repetition by other countries.
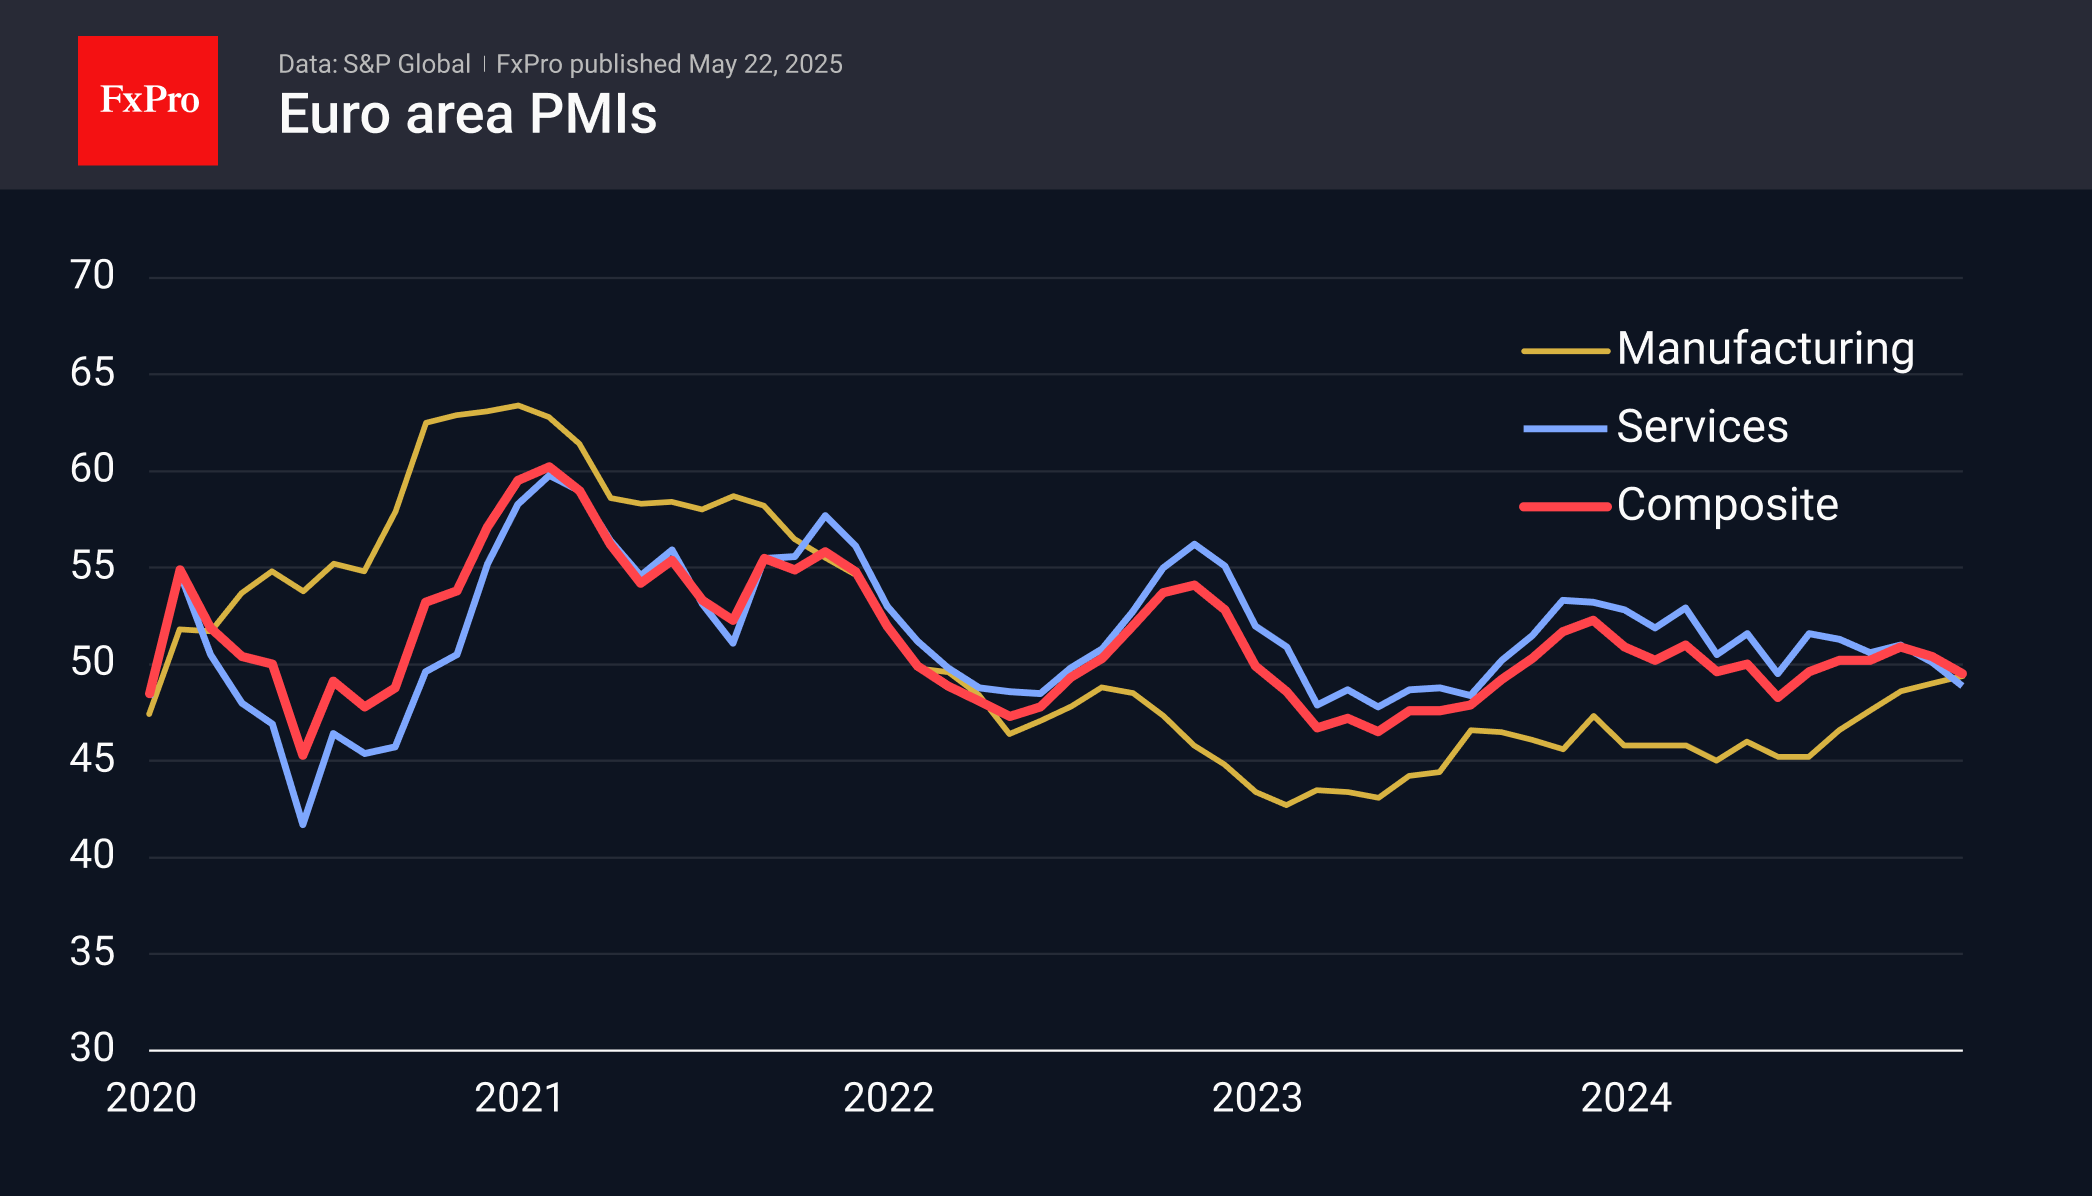
Interestingly, the strengthening euro is still not hurting manufacturers. We think it is a fallacy to think that eurozone manufacturers are sensitive to such 10% exchange rate fluctuations. Our observations suggest the opposite: the appreciation of the exchange rate does not hurt the economy, lowering energy costs and generally boosting demand.
The services sector, on the other hand, is not doing so well. The index has fallen back to 48.5, its lowest level since January 2024, and has been drifting downwards all this time. With this setback, the composite index went into contraction territory, below 50. The service sector and the general state of the economy were worse than economists’ expectations, pulling the Euro.
EURUSD pulled back to 1.1300, losing about a third of a cent from intraday highs before publication. The same area worked as strong resistance, and the latest data favoured the bears in the pair.
RBA’s Hauser: Post-tariff China outlook positive but incomplete
In a speech focused on his recent visit to China following the sweeping tariff shifts of “Liberation Day”, RBA Deputy Governor Andrew Hauser noted there was a sense of "strong hand" in managing the economic fallout from US-imposed tariffs. Additionally, Australian firms operating in China perceived "opportunities amidst the risks", as trade patterns began to shift.
However, Hauser was quick to stress that this view was inherently limited, anchored to a moment in time and shaped by a single national perspective.
Hauser laid out four key caveats. First, global tariff settings remain fluid, and data on their real-world economic effects is just beginning to emerge. Second, the assessments he heard may prove overly optimistic, domestic stimulus in China may underperform, and public tolerance for economic pain may be lower than expected.
Third, indirect “general equilibrium” effects could emerge, including the possibility of intensified competition from Chinese firms offloading excess supply originally intended for US markets. While sectoral overlap with Australia is limited, it is a concern shared across the Asia-Pacific region.
Finally, Hauser acknowledged the broader strategic uncertainties at play—factors beyond economics that could shape Australia's position.
Bitcoin Confidently Updates Highs
Market Picture
Market capitalisation topped $3.5 trillion on Thursday morning, later retreating slightly below that round level. Interestingly, Bitcoin’s all-time highs have yet to spark FOMO. The historical highs of the first cryptocurrency keep the market positive, but the growth rate of altcoins is still commensurate with the dynamics of BTC.
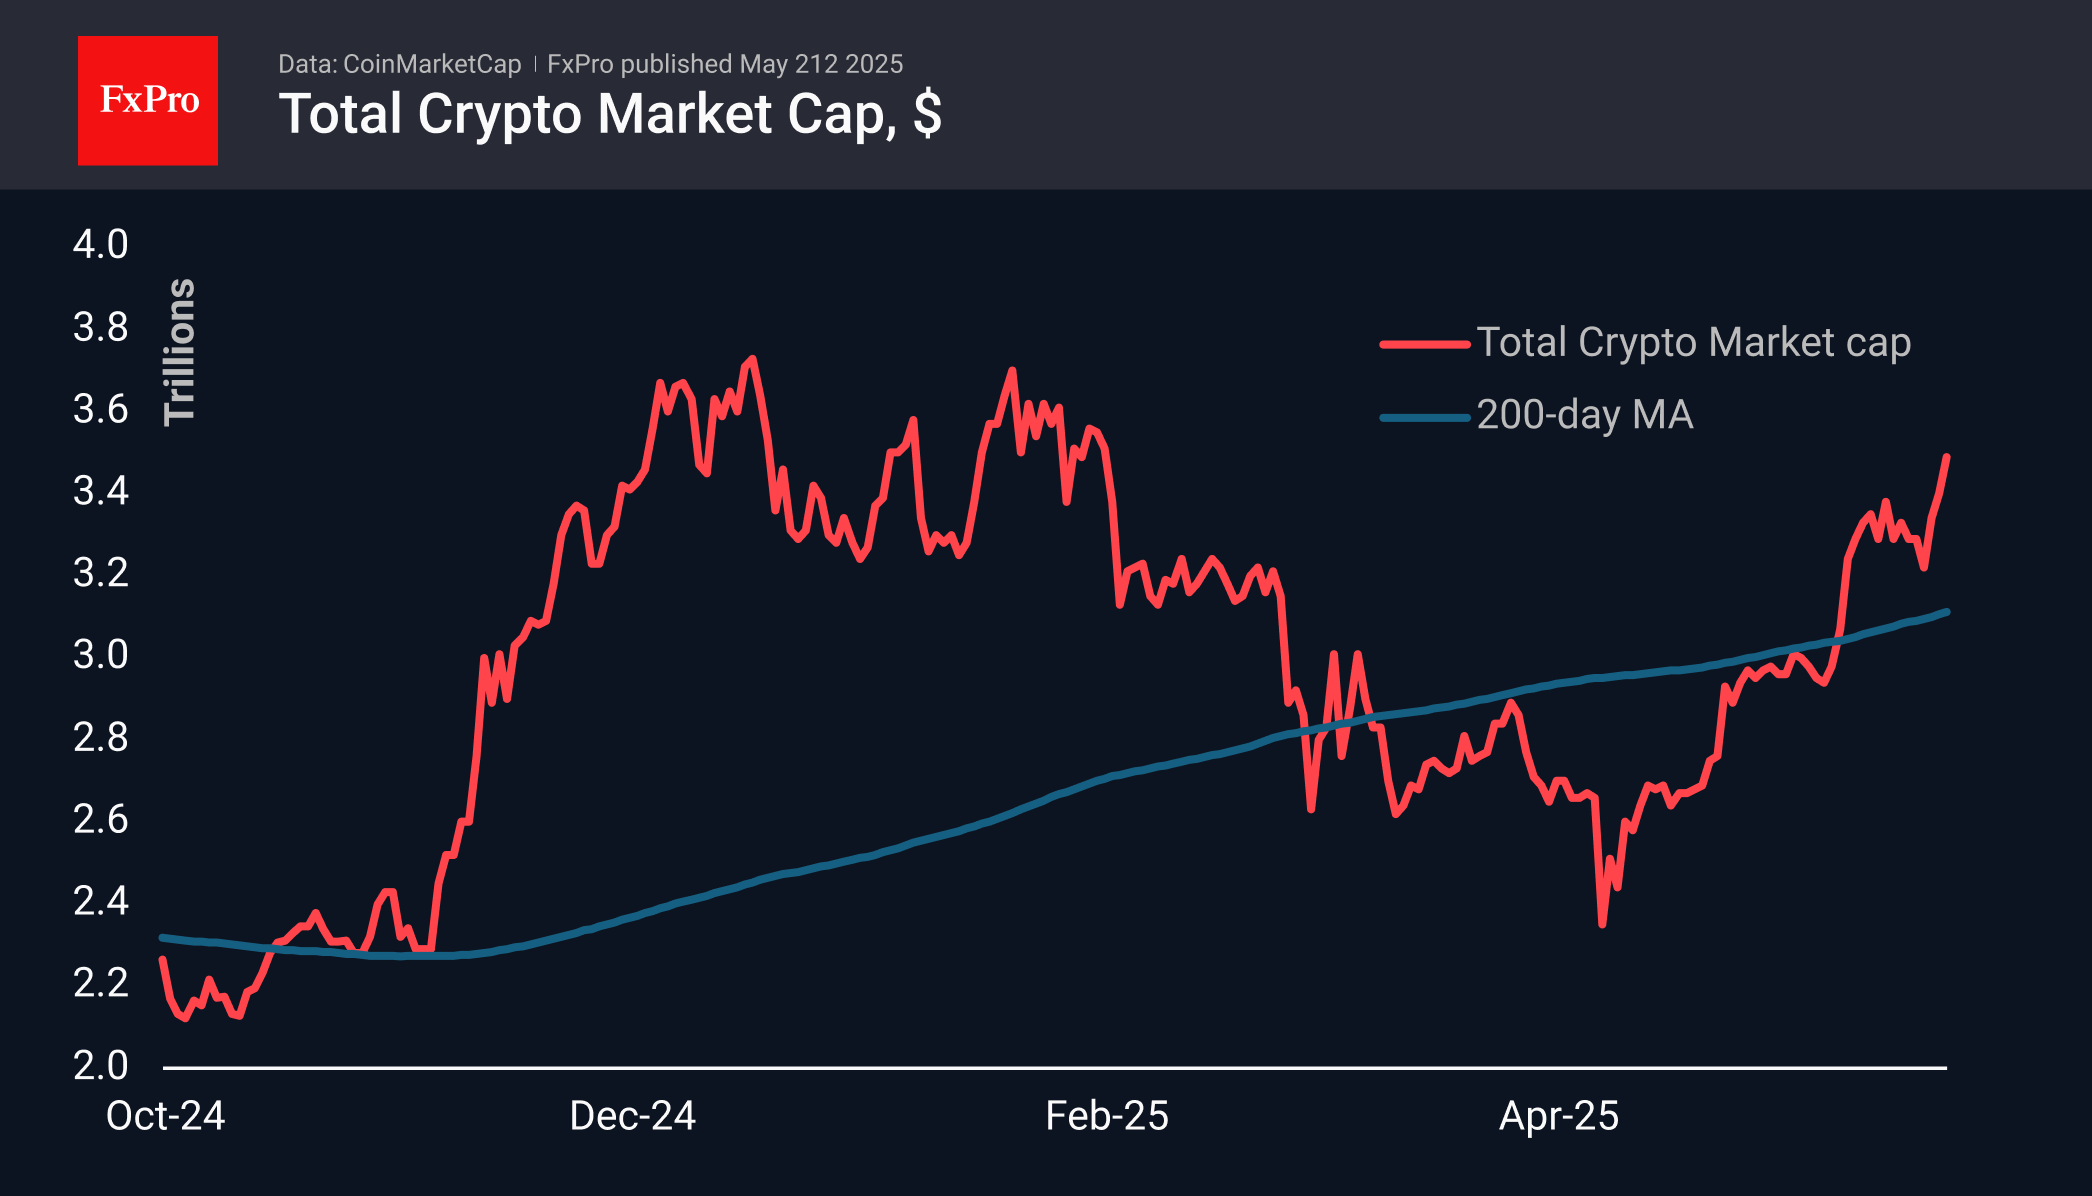
The sentiment index at 72 remains on the cusp of entering the area of extreme greed, which often corresponds to periods of robust market growth when FOMO has yet to turn on, making growth vulnerable to corrective pullbacks.
Bitcoin was climbing to $111.8K on Thursday morning, recording a new all-time high. This slip was followed by a tidy giveaway, with early buyers cautiously locking in profits. Working against Bitcoin right now is the exit from risk assets in financial markets due to the sell-off in US government bonds. In such an environment, institutional clients could be net sellers, although at first glance, cryptocurrencies may appear to be a safe haven.
News Background
Bitcoin’s $3 billion rise in realised bitcoin capitalisation overnight to new records reflects the continuation of the accumulation phase ahead of another momentum over the coming week, CryptoQuant noted.
States are investing in the first cryptocurrency through shares of Strategy, the largest public holder of BTC, according to Standard Chartered. Government entities increased their investment in Strategy stock in the first quarter.
The Texas House of Representatives approved a bill to create a strategic bitcoin reserve. The document has been sent to the governor for his signature. Texas is likely to become the third US state after New Hampshire and Arizona with such an initiative.
Strive Asset Management, a company linked to Vivek Ramaswamy, intends to acquire 75,000 BTC at a discount from the bankrupt Mt. Gox exchange to create a bitcoin reserve.
River said the US could be a major beneficiary of bitcoin’s growth due to its regulatory advantages, advanced mining infrastructure, and state-level support. The country already controls 79.2% of global assets in spot bitcoin ETFs and more than 38% of the BTC network hash rate. Nearly 50 million Americans own bitcoins.
Bitcoin Hits All-Time High, Surges Above $110K
As shown on the BTC/USD chart, the Bitcoin price has broken above the $110K mark, setting a new all-time high around $111,800.
This move highlights the strength of the leading cryptocurrency, which has surged nearly 50% in just over one and a half months, rising from a low near $75K recorded in early April.
What’s Driving Bitcoin’s Price Higher?
One of the key drivers is weakness in the US dollar. In April, the US Dollar Index hit its lowest level in three years and remains close to that low at the end of May. According to Reuters, downward pressure on the dollar is being caused by:
→ a lacklustre Treasury bond auction yesterday;
→ currency traders’ expectations surrounding the potential impact of President Donald Trump’s proposed legislation on significant tax and spending cuts.
On the other hand, crypto enthusiasts welcomed the news that the Texas House of Representatives has passed a bill allowing state investments in Bitcoin. Once signed by the governor, the law could make Texas the first US state to hold Bitcoin in its reserves.
Technical Analysis of the Bitcoin Chart
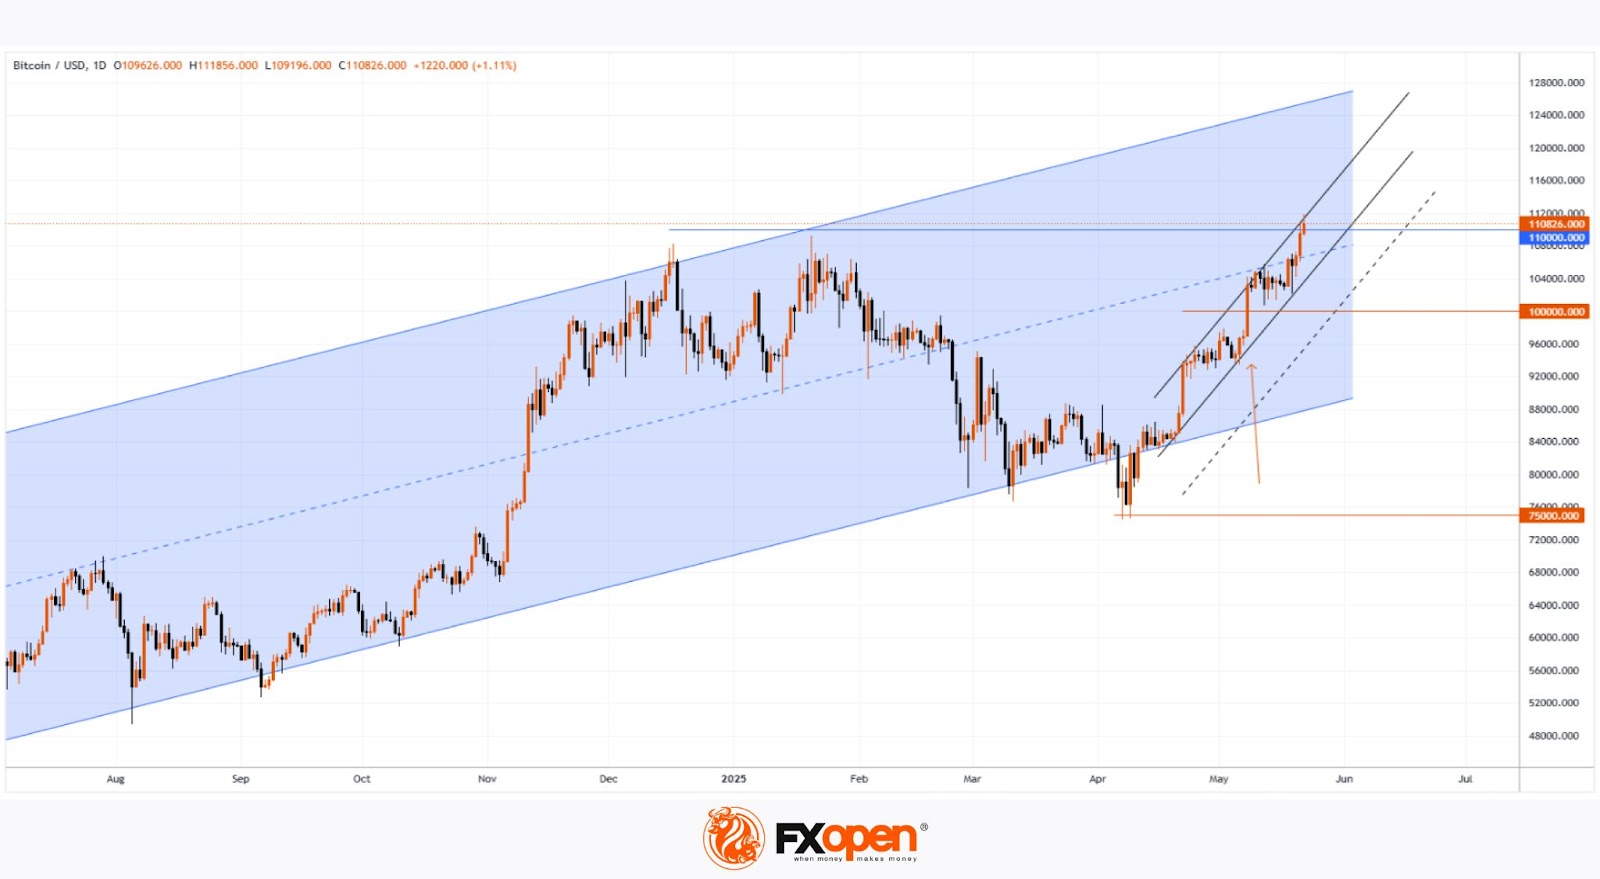
In our previous analysis on 8 May, we:
→ extended the long-term upward channel (marked in blue);
→ suggested that momentum had shifted in favour of the bulls and focused on how BTC/USD might behave when testing the key psychological level of $100K.
As indicated by the arrow, the break above $100K was strong — marked by a wide bullish candle that closed at its high — after which the bulls continued to push BTC/USD higher. This has resulted in the formation of a new ascending channel (shown in black).
Reaching a new all-time high may prompt some buyers to take profit following the May rally, which could lead to a correction — potentially down towards the dotted black line, which runs parallel to the current black channel but sits lower.
In the most optimistic scenario, the price of the leading cryptocurrency could rise toward the upper boundary of the long-standing blue channel, whose relevance we have been highlighting for many months.
FXOpen offers the world's most popular cryptocurrency CFDs*, including Bitcoin and Ethereum. Floating spreads, 1:2 leverage — at your service. Open your trading account now or learn more about crypto CFD trading with FXOpen.
*Important: At FXOpen UK, Cryptocurrency trading via CFDs is only available to our Professional clients. They are not available for trading by Retail clients. To find out more information about how this may affect you, please get in touch with our team.
This article represents the opinion of the Companies operating under the FXOpen brand only. It is not to be construed as an offer, solicitation, or recommendation with respect to products and services provided by the Companies operating under the FXOpen brand, nor is it to be considered financial advice.
Sterling Strengthens Weak US Dollar and UK Inflation Provide Support
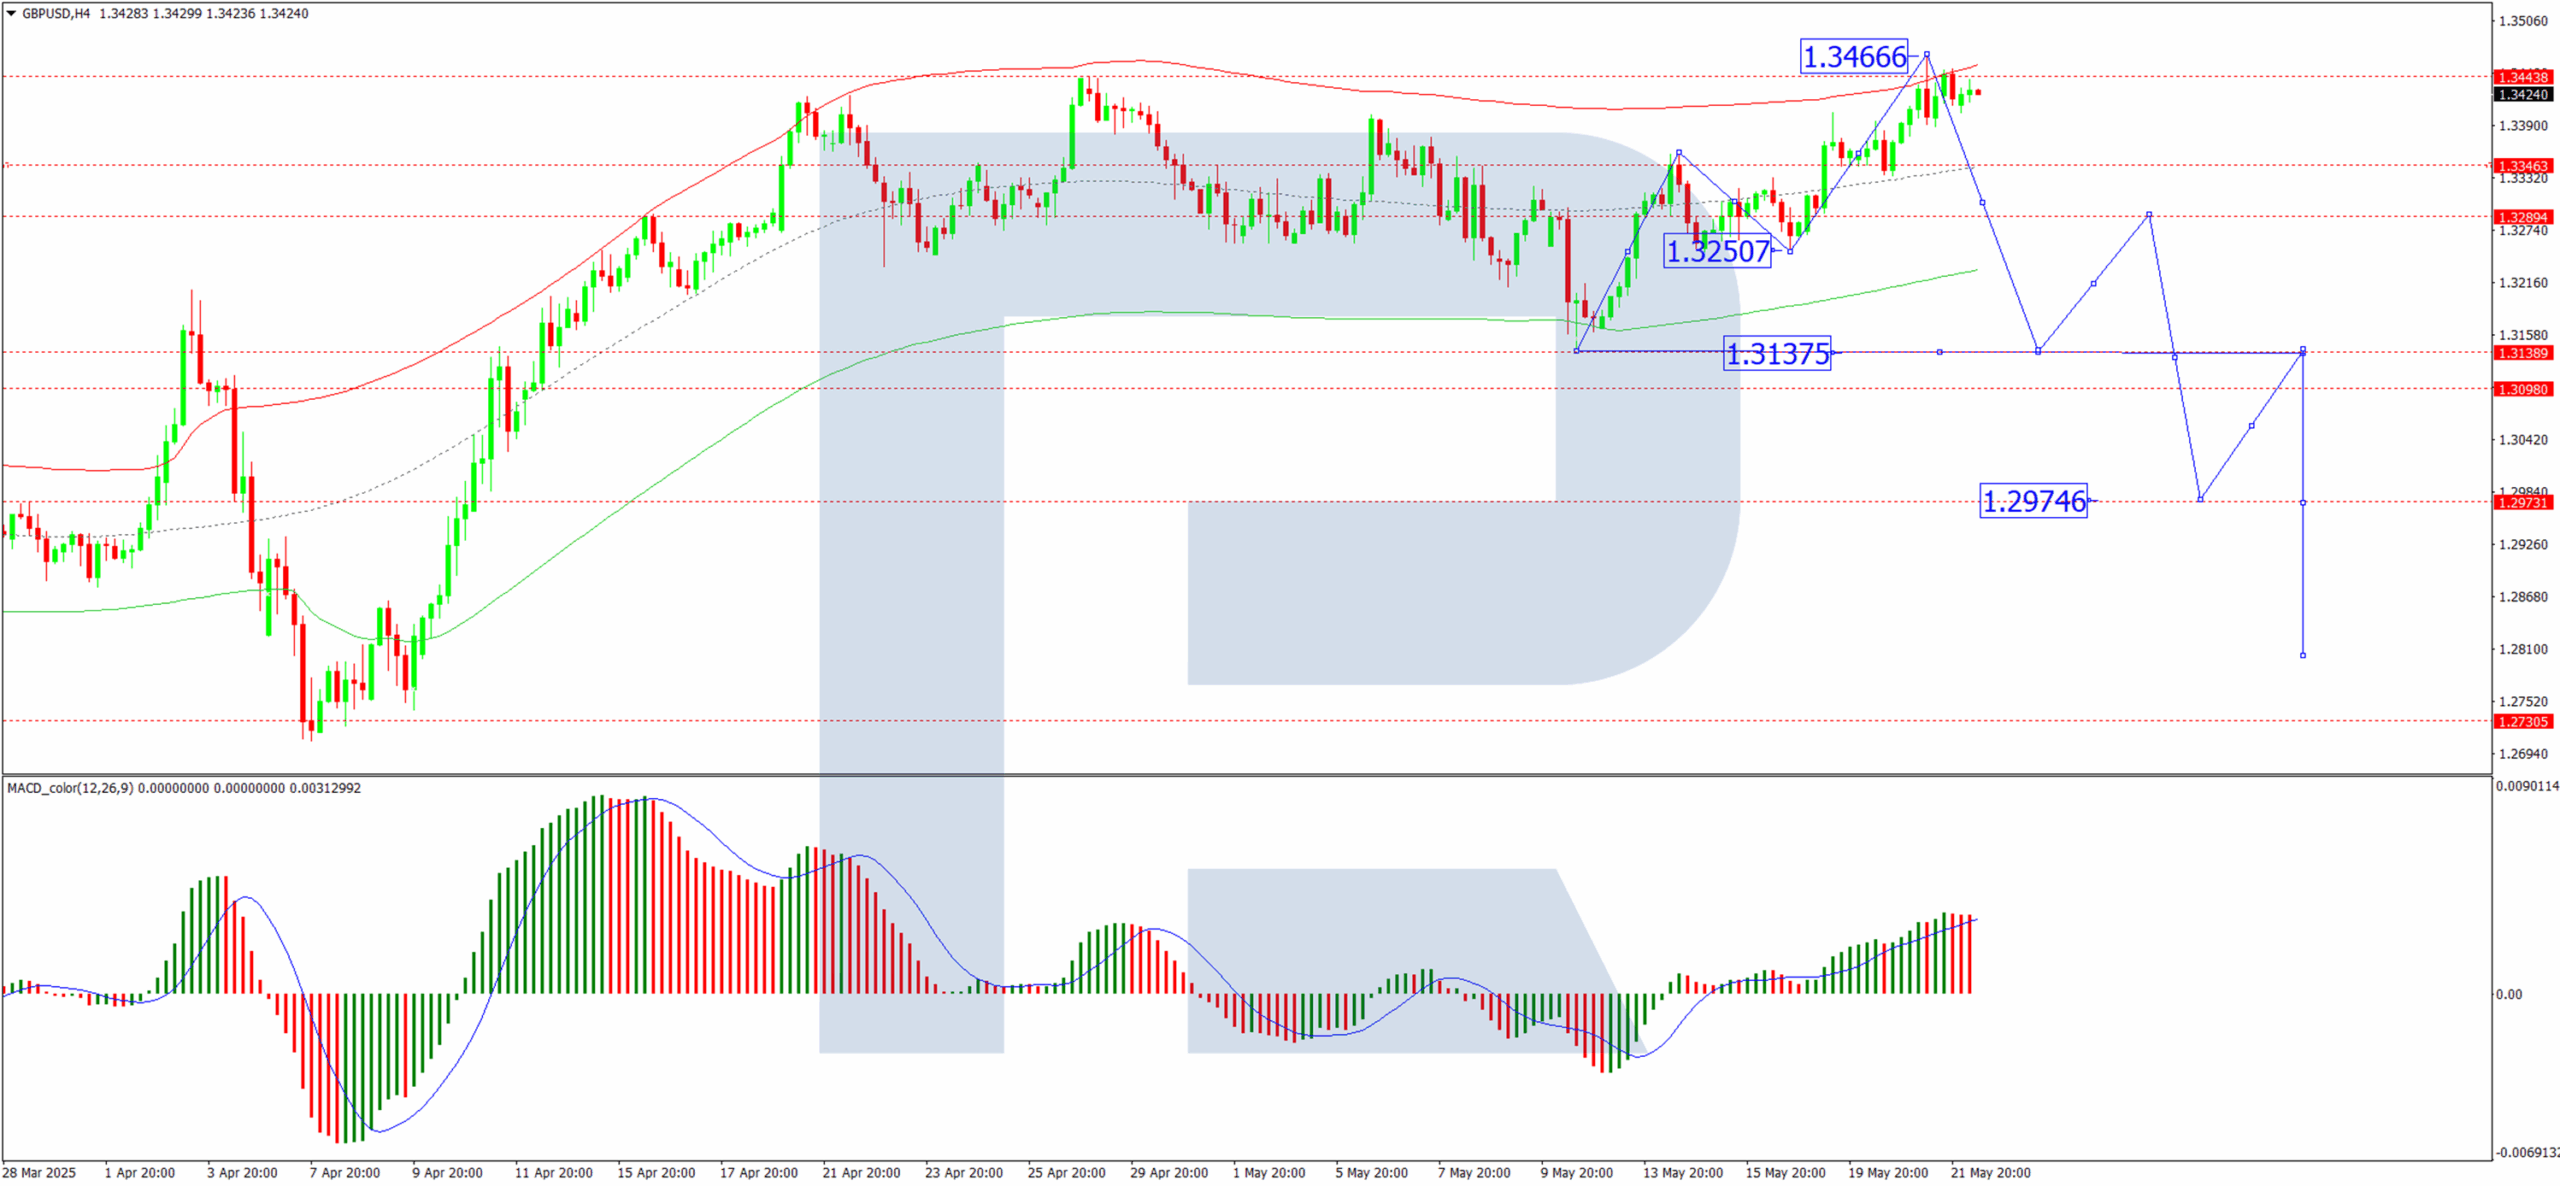
The GBP/USD pair continues its upward trajectory, reaching 1.3429 by Thursday. It is now trading just below yesterday’s peak, its highest level since February 2022.
Key drivers behind GBP/USD’s rise
The rally follows the release of stronger-than-expected UK inflation data. The annual Consumer Price Index (CPI) accelerated to 3.5% in April, the highest reading since January 2024, exceeding both market forecasts (3.3%) and the Bank of England’s projection (3.4%). Contributing factors included:
- An increase in Ofgem’s energy price cap
- Higher vehicle tax rates
Notably, services sector inflation surged from 4.7% to 5.4%, signalling persistent underlying price pressures.
Market expectations for monetary policy easing have adjusted significantly. Investors now anticipate just one 25-basis-point rate cut by the end of 2025. The likelihood of a rate cut in August has fallen from 60% to 40%.
The Bank of England reduced interest rates by 25 basis points in May, although policymakers were divided on the decision.
Technical analysis: GBP/USD
H4 Chart:
- The GBP/USD pair completed an upward wave, peaking at 1.3466
- Today, we expect consolidation below this level
- A downward breakout could initiate a decline towards 1.3131, with 1.3300 acting as the first target
- The MACD indicator supports this view, with its signal line exiting the histogram zone and trending lower
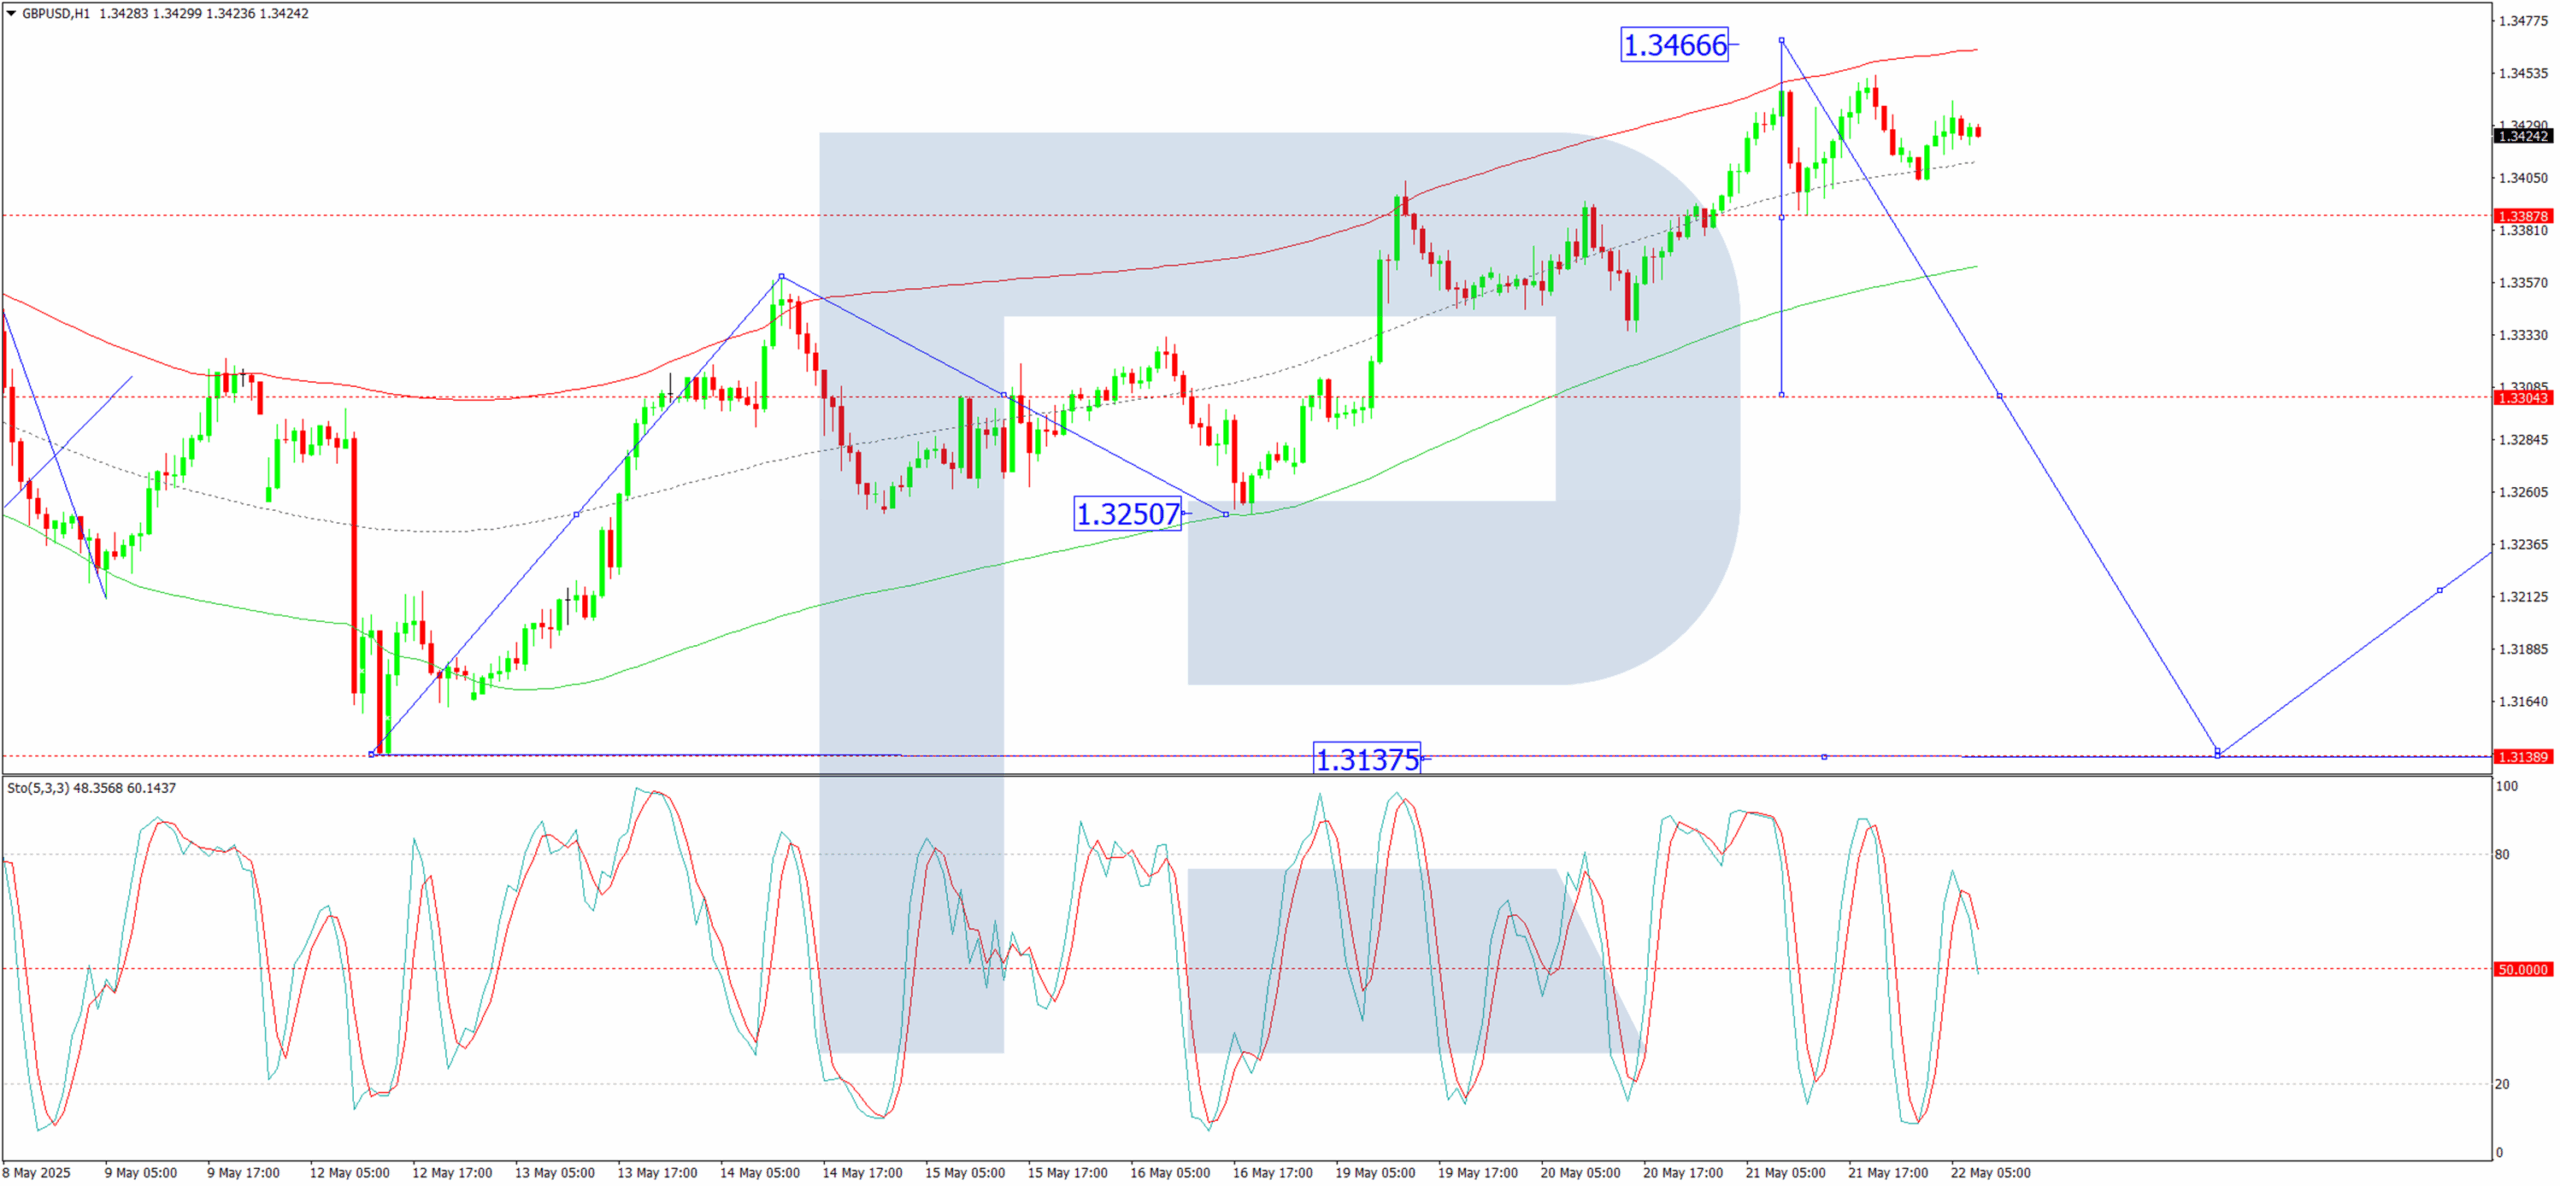
H1 Chart:
- The pair reached 1.3466 before correcting to 1.3388, establishing a consolidation range
- A downward breakout today could see a move towards 1.3300
- The Stochastic oscillator confirms this scenario, with its signal line below 80 and pointing decisively downward towards 20
Conclusion
Sterling’s strength persists amid weaker US dollar dynamics and persistent UK inflation. While technical indicators suggest a potential pullback, the broader trend remains influenced by monetary policy expectations and economic data.
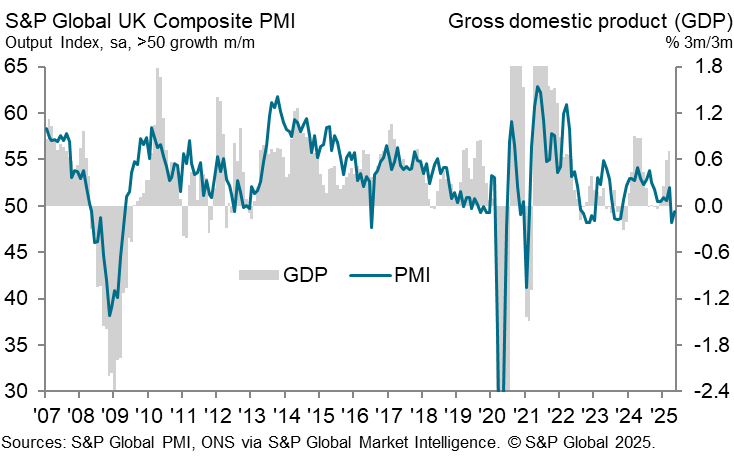
UK PMI composite ticks up to 49.4, price pressures ease from April spike
UK PMI Services rose modestly from 49.0 to 50.2, while Manufacturing PMI edged lower from 45.4 to 45.1. As a result, the Composite PMI ticked up from 48.5 to 49.4, still below the 50-mark that separates expansion from contraction.
According to S&P Global’s Chris Williamson, business confidence has improved since April, helped in part by easing trade tensions. However, output across the private sector shrank for a second consecutive month, suggesting that the UK economy may be slipping into contraction for Q2.
On a more encouraging note, inflationary pressures appear to have cooled significantly from April’s spike. This moderation in price growth, combined with lackluster output and emerging job losses, strengthens the case for further monetary easing by BoE in the coming months.
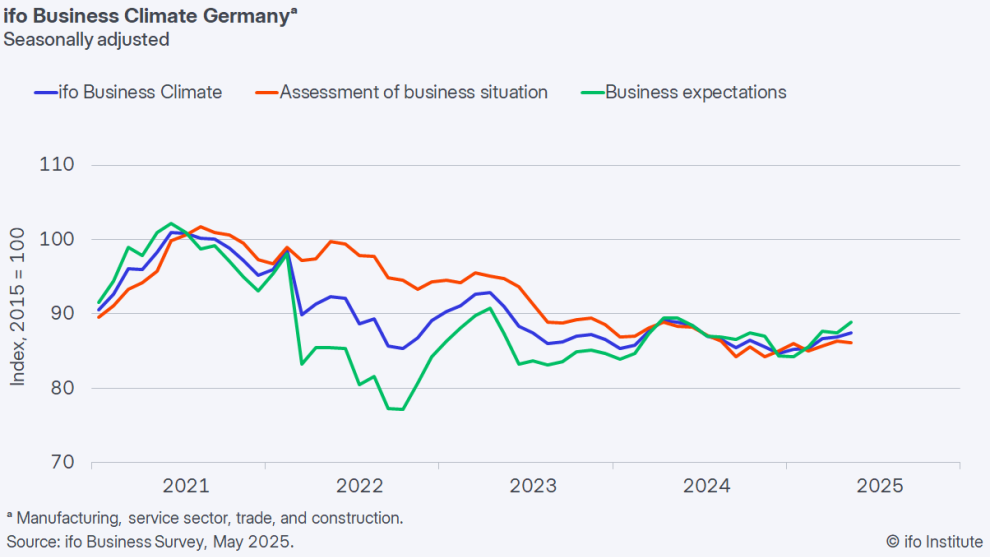
German Ifo rises to 87.5, economy stabilizing with uncertainty eased
Germany’s Ifo Business Climate Index rose to 87.5 in May, up from 86.9 in April, offering cautious optimism that the economy may be stabilizing.
The improvement was driven by a notable rise in the Expectations Index, which climbed from 87.4 to 89.9, a sign that firms are growing more confident about future conditions. However, the Current Situation Index dipped slightly from 86.4 to 86.1.
The Ifo Institute noted that "sentiment among German companies has improved" and that the recent surge in uncertainty has begun to ease.
Eurozone PMI composite falls to 49.5, services falter, manufacturing holds tentatively
Eurozone’s private sector returned to contraction in May, with PMI Composite falling from 50.4 to 49.5, a six-month low. The drag came from the services sector, where the PMI dropped from 50.1 to 48.9, its weakest reading in 16 months. While the manufacturing index rose modestly from 49.0 to 49.4, marking a 33-month high, it remained in contractionary territory.
According to HCOB Chief Economist Cyrus de la Rubia, the region’s economy “cannot seem to find its footing,” as growth signals remain elusive and sentiment subdued.
The modest improvement in manufacturing may reflect front-loaded activity as firms seek to get ahead of US tariffs, rather than underlying demand strength. However, the downturn in services, typically more domestically oriented and less exposed to global trade, raises concern about internal demand softness.
For the ECB, the numbers are "likely to leave it with mixed feelings". While service sector inflation appears to be moderating, input costs — likely driven by wages — are ticking higher again. Manufacturing purchase prices, by contrast, continue to fall.
