Sample Category Title
Bad US Auction Weighed on Wall Street and Dollar
Markets
Yesterday’s US 20-yr $16bn bond sale was a rough one. The auction tailed 1.2 bps vs the 5.035% WI yield with lower-than-average demand. US yields ripped higher, extending earlier gains. Net daily changes varied between +4.8 bps in the 2-yr to 12.9 bps for the 20-yr. The US 30-yr yield added 12.3 bps to 5.09% and rapidly closes in on the 2023 high of 5.17%. The 5% coupon, the highest since the 20-yr tenor was reintroduced in 2020, wasn’t considered enough and is a writing on the wall. Investors shun long-term US debt given fiscal risks to an already unsustainable deficit situation. Conditions ahead of the auction were suboptimal, to put it mildly. Shortly before the sale, House Speaker Mike Johnson said there was agreement on one of the last remaining hurdles (SALT, Medicaid), potentially paving the way for Trump’s bill to be approved by the House later today. Adding to the negative vibes was a Japanese sale that flopped on Tuesday. The tenor was the same, market concerns similar. It launched Japanese yields with maturities from 20 year on to the highest levels since at least 25 years. That prompted calls on the Bank of Japan to revise its bond buying taper plans, specifically those affecting the long end of the curve. But one of the most dovish BoJ board members said this morning he currently sees no need to. In the plan laid out last year and which is up for an interim review at June’s policy meeting, monthly buying should halve to JPY 3tn by March 2026. Japanese yield again add several bps. The bad US auction weighed on Wall Street with losses mounting to 2% (Dow Jones) as well as on the dollar. The trade-weighted index closed sub 100, EUR/USD rose to 1.133. USD/JPY eased to 143.7 and drops further to 143.3 in Asian trading this morning. JPY largely ignores an understanding between finance minister Kato and his US counterpart Bessent that FX rates should be determined by the market. Both met in the sidelines of the G7 summit in Canada and ongoing FX talks with the likes of South Korea and Taiwan is fueling speculation of the US using tariffs to arm-wrestle the broader region in letting local currencies strengthen.
The calendar has the sole important economic data for this week on offer: PMI business confidence indicators. We suspect the European reading to come in to the better side of expectations as trade fever eased over the last couple of weeks. We keep a close eye at the price subseries. Input cost increased slowed last month but selling prices continued to pick up. The combination of improving economic conditions and still-strong price pressures keeps European yields supported. They have been joining the broader move higher, particularly at the long end of the curve. The 30-yr swap is the one to watch for today, with the yield currently testing the 1.5 year high seen in March. We expect EUR/USD to move higher with 1.1573 (April high) serving as the first technical resistance level.
News & Views
Lower growth than previously expected slowed the efforts of fiscal consolidation by New Zealand, the proposal of the new budget showed this morning. The government expects a budget deficit at 2.6% of GDP in the fiscal year 2025/2026 (NZD 12.1 bln), compared to the expected 2.3% at in December last year. The government intends to return to a budget balance in the fiscal year 2028/29. Treasury takes a 1.2% growth into account for 2025 (from 2.1%) before accelerating to 3.1% in 2026. Both are still higher than the projections of the central bank. The lower deficit reduction plan also slowed the decline in the government debt ratio. This is expected to peak at 46.0% in 2027/28. In a first comment after the budget presentation, rating agency S&P indicated that the elevated fiscal and current account deficits weigh on the credit rating. S&P nevertheless expects that the country’s public debt will stabilize at a favourable level compared to most rating peers. New-Zealand has AA+ rating with a stable outlook. The kiwi dollar eases slightly this morning against the dollar to NZD/USD 0.5925.
The Japanese composite PMI in May slipped back in contraction territory, from 51.2 in April to 49.8 in May. The decline in the overall index was driven by a further contraction in out in the manufacturing sector (48.0 from 48.9) while activity in the services sector slowed materially from 524 to 50.4. S&P Global comments that demand conditions looked more fragile, with new business across both manufacturing and service sectors falling for the first time in nearly a year and foreign demand declining for the second straight month. Cost pressures remained elevated in May, but there were tentative signs that input price inflation is cooling. Business confidence is the second lowest recorded since the initial wave of the COVID-19 pandemic, due to uncertainty on the future trade environment and foreign demand clouding the outlook for the year ahead.
GBP/JPY Daily Outlook
Daily Pivots: (S1) 192.34; (P) 193.03; (R1) 193.49; More...
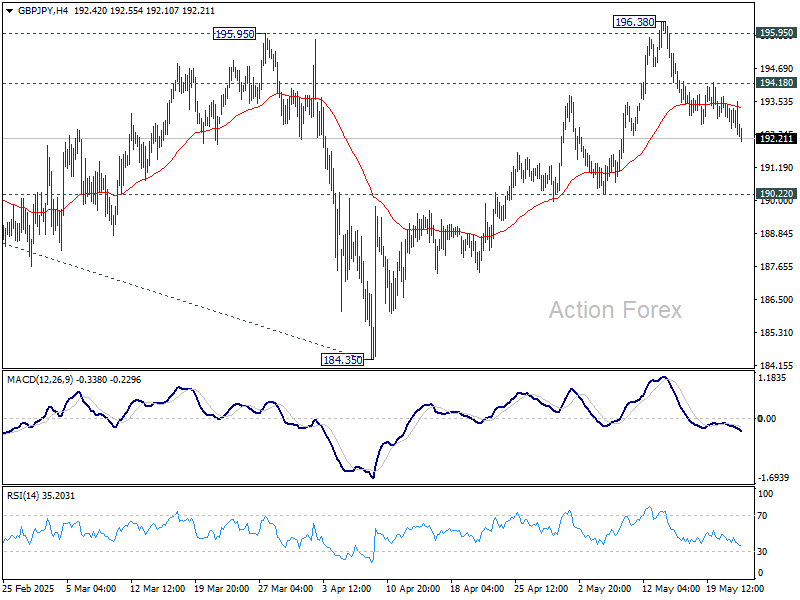
Intraday bias in GBP/JPY stays neutral. While deeper pullback might be seen, further rally is expected as long as 190.22 structural support holds. On the upside, above 194.18 minor resistance will turn bias back to the upside for 196.38 resistance. However, sustained break of 190.22 will indicate near term reversal.
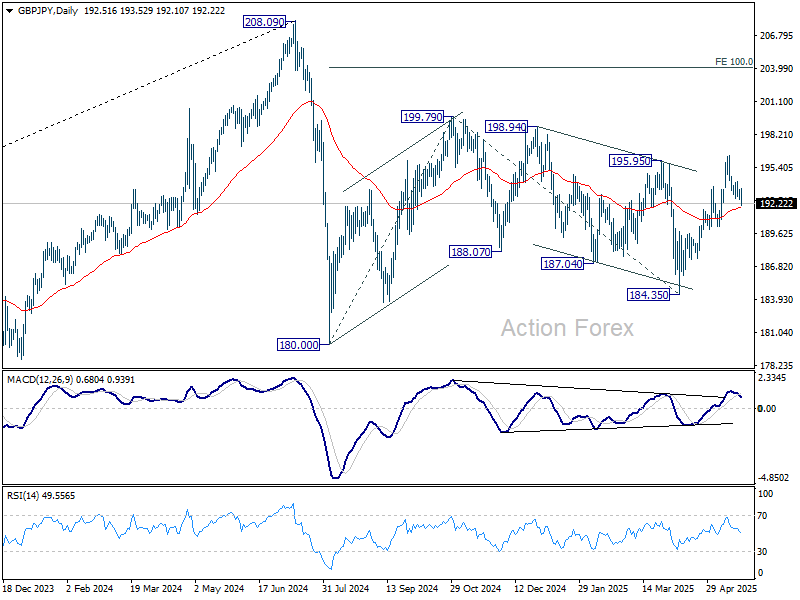
In the bigger picture, price actions from 208.09 are seen as a correction to rally from 123.94 (2020 low). Strong support should be seen from 38.2% retracement of 123.94 to 208.09 at 175.94 to contain downside. However, sustained break of 175.94 will bring deeper fall even still as a correction.
EUR/JPY Daily Outlook
Daily Pivots: (S1) 162.50; (P) 162.90; (R1) 163.19; More...
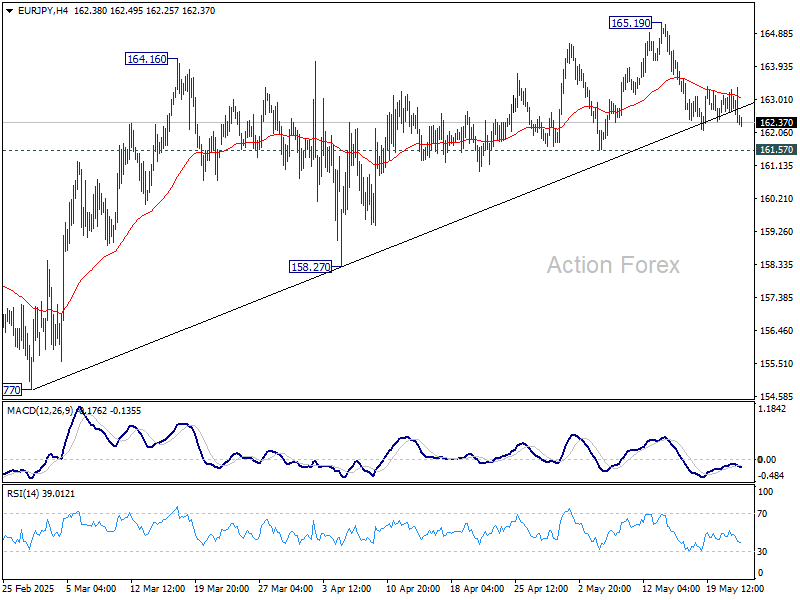
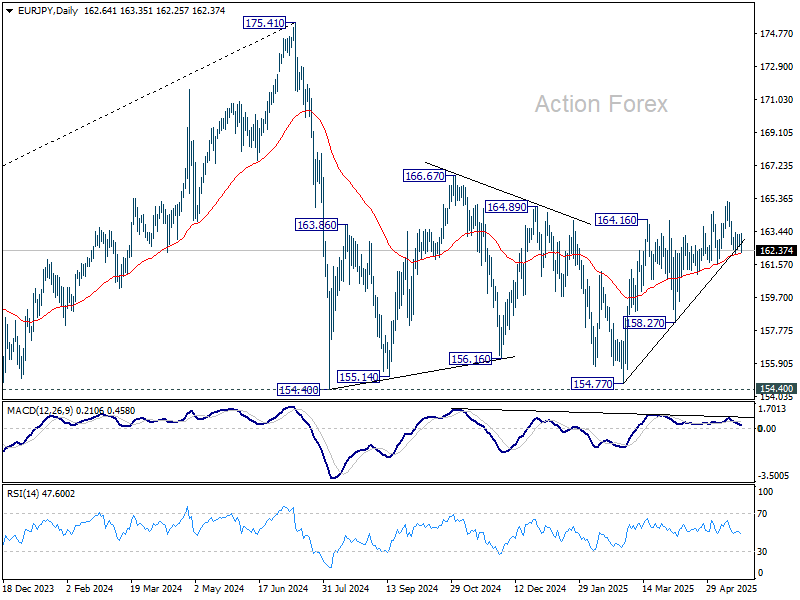
Intraday bias in EUR/JPY remains neutral for the moment, and more consolidations could be seen. Further rally is in favor as long as 161.57 support holds. Break of 165.19 will resume the rise from 154.77 to 166.67 resistance. However, firm break of 161.57 will indicate near term reversal, and turn bias back to the downside.
In the bigger picture, price actions from 175.41 are seen as correction to rally from 114.42 (2020 low). Strong support should be seen from 38.2% retracement of 114.42 to 175.41 at 152.11 to contain downside. However, sustained break of 152.11 will bring deeper fall even still as a correction.
EUR/GBP Daily Outlook
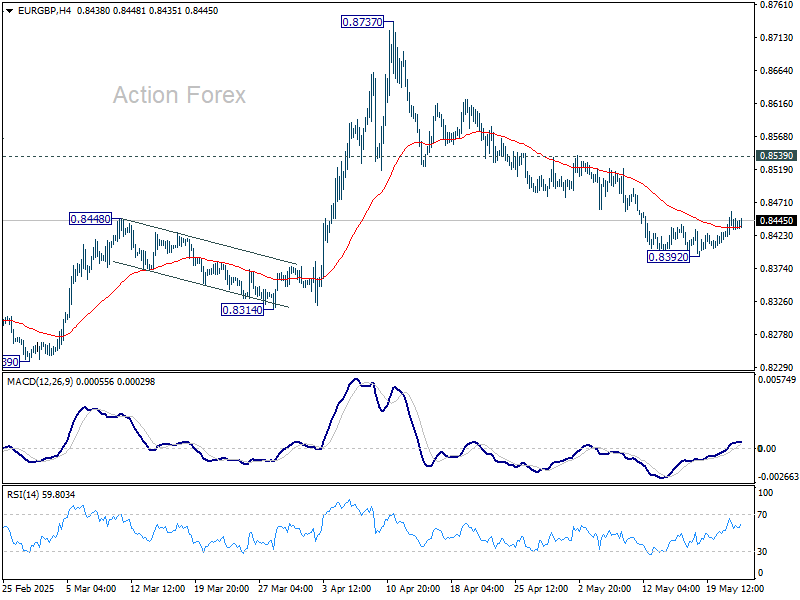
Daily Pivots: (S1) 0.8425; (P) 0.8442; (R1) 0.8462; More...
Intraday bias in EUR/GBP remains neutral and more consolidations could be seen above 0.8392 temporary low. Further decline remains in favor as long as 0.8539 resistance holds. Below 0.8392 will resume the fall from 0.8737 to 0.8221/8239 support zone.
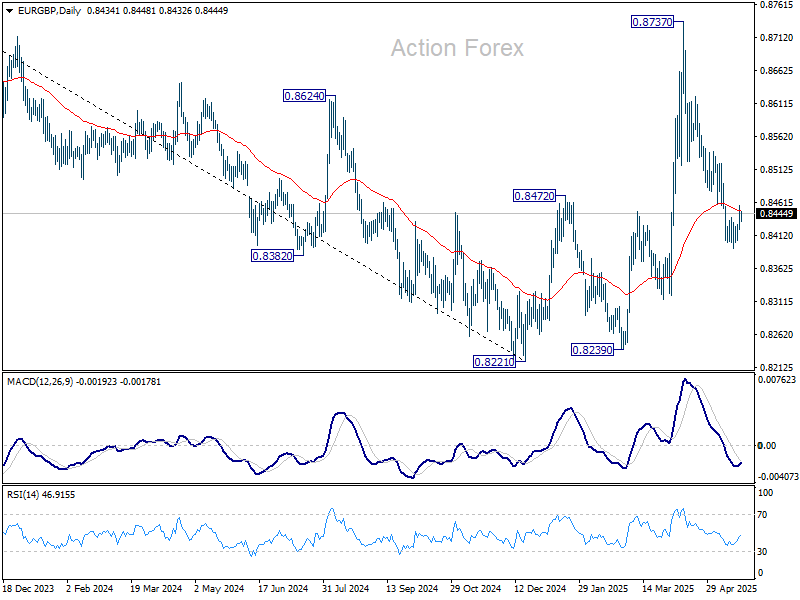
In the bigger picture, current development suggests that price actions from 0.8221 medium term bottom are merely forming a corrective pattern. However, there is no clear momentum to break through 0.8201 key support (2022 low) yet. Hence, range trading is expected between 0.8221/8737 for now.
EUR/AUD Daily Outlook
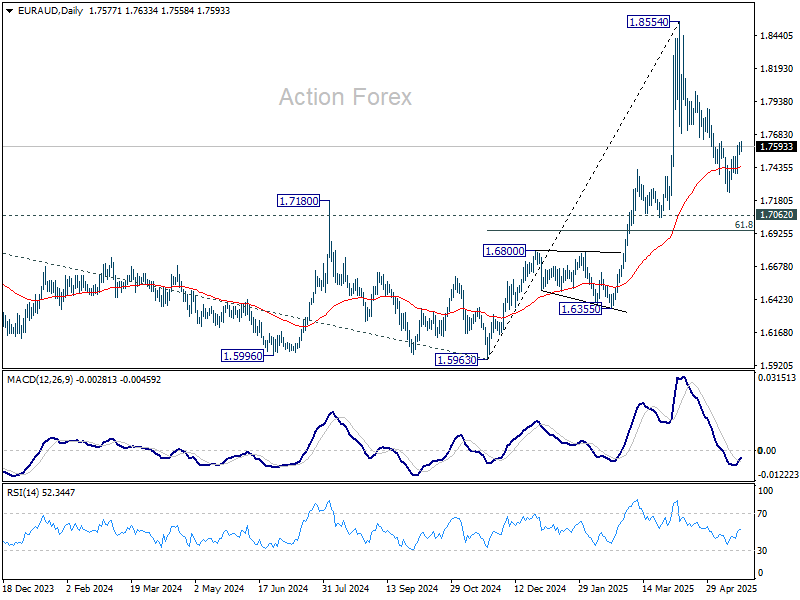
Daily Pivots: (S1) 1.7547; (P) 1.7586; (R1) 1.7639; More...
Intraday bias in EUR/AUD remains neutral for the moment. On the upside, firm break of 1.7628 resistance will suggest that fall from 1.8554 as completed as a correction, and retain larger bullishness. Intraday bias will be back on the upside for stronger rebound. However, below 1.7245 will resume the fall to 61.8% retracement of 1.5963 to 1.8554 at 1.6953.
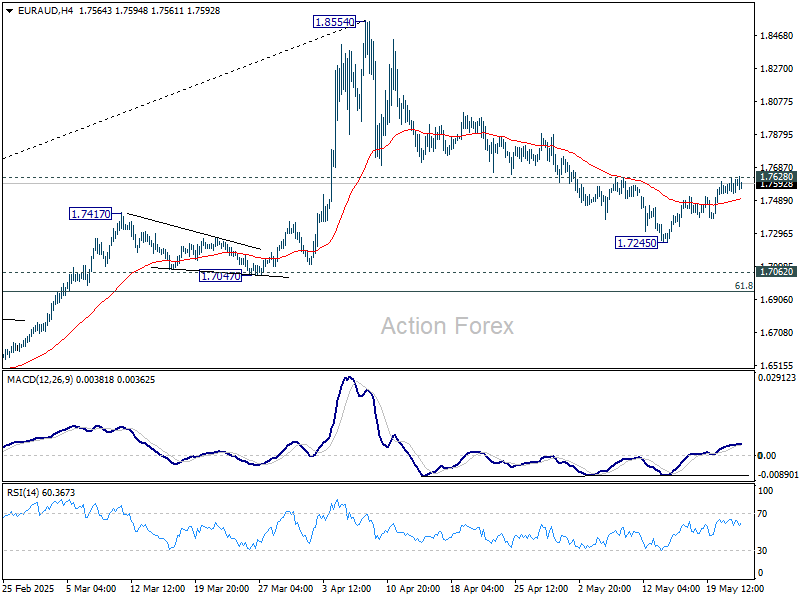
In the bigger picture, as long as 1.7062 resistance turned support (2023 high) holds, up trend from 1.4281 (2022 low) should still be in progress. Break of 1.8554 will target 100% projection of 1.4281 to 1.7062 from 1.5963 at 1.8744. However, sustained break of 1.7062 will confirm medium term topping and bring deeper fall back to 1.5963 support.
EUR/CHF Daily Outlook
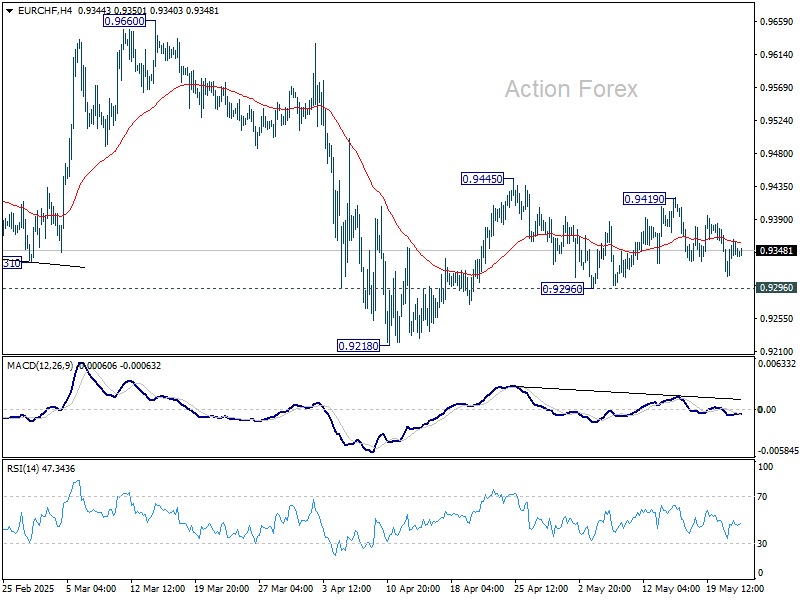
Daily Pivots: (S1) 0.9322; (P) 0.9343; (R1) 0.9372; More....
EUR/CHF is still bounded in sideway trading and intraday bias remains neutral. Price actions from 0.9218 are seen as either a corrective move or the third leg of the pattern from 0.9204. On the upside, break of 0.9419 will resume the rise from 0.9218 through 0.9445 resistance. However, break of 0.9296 support will bring retest of 0.9218 low.
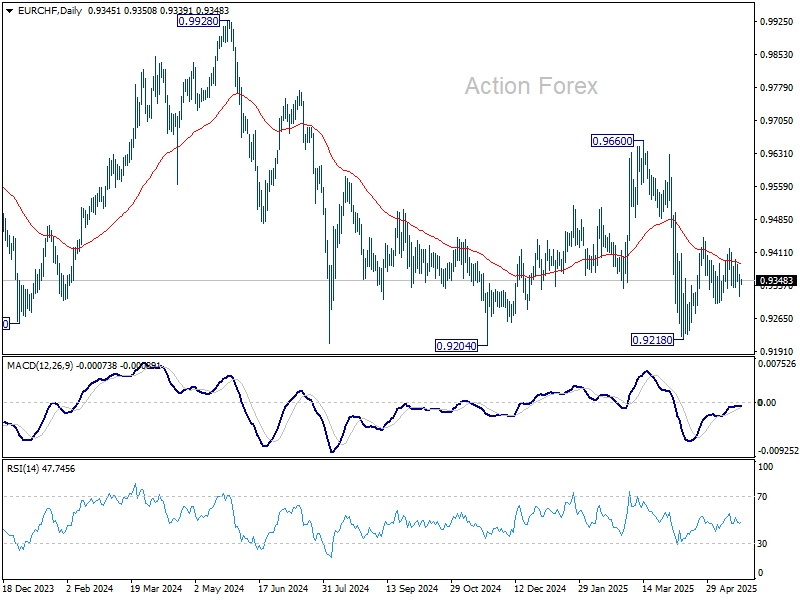
In the bigger picture, prior rejection by long-term falling channel resistance (now at 0.9548) retains medium term bearishness. That is, down trend from 1.2004 (2018 high) is still in progress. Firm break of 0.9204 (2024 low) will confirm resumption. This will remain the favored case as long as 0.9660 resistance holds.
US Debt Worries Eclipse All Else
It’s Thursday, and so far this week, US debt concerns have overshadowed Middle East optimism, trade tensions, and even a fresh all-time high for Bitcoin. The turning point was last Friday’s credit outlook downgrade by Moody’s, which was quickly followed by a political debate around tax cuts—targeting social spending that supports the poorest, to give further tax relief to the wealthiest Americans. According to a nonpartisan agency, this plan would inflate the national debt by an additional $4 trillion—on top of the nearly $37 trillion already looming and expanding exponentially.
Why can the US afford to keep borrowing at this scale—and at relatively low cost? Because global investors still crave US debt. Treasuries are liquid, long perceived as low-risk, and feature in virtually every well-balanced and calibrated portfolio—including those of central banks. And when things go wrong, the Federal Reserve (Fed) steps in and buys huge amounts of government bonds to calm market nerves. Treasuries are a unique investment tool.
The issue today, however, is that the Fed is now sitting on a mountain of that debt, which it is slowly trying to let mature. That’s not the core concern, though. What’s changing is that investors are beginning to question whether this ever-growing US debt load is truly viable—and perhaps more importantly, whether it’s as low risk as we pretend it to be.
Because here’s the bottom line: the strength and credibility of the US Treasury market is the real foundation of the US exceptionalism narrative. It’s not Apple or Nvidia. It’s the fact that the US has been able to fund its economy and respond to crises through this unparalleled debt market. That’s what’s made the US so globally dominant. And that special status is something investors gave—and something they could take away.
We saw clear signs of that yesterday when the US Treasury’s 20-year bond auction fell flat. Yields hit around 5.10%—the highest since the tenor was reintroduced in 2020. Weak demand triggered a broader selloff across the curve, pushing 10-year yields to 4.60% and 30-year yields back above the 5% mark. This was the market’s way of signaling a lack of confidence in the US government and its policy direction.
This also responds, at least partly, to the million Dollar question of ‘could yields go higher?’ Yes—a lot higher. Back in 1981, the 10-year yield stood above 15%, and the 30-year has been steadily declining from near 10% since 1987. I don’t expect a return to those extremes, but a sustained move above 5%—especially if underpinned by structurally higher inflation—is definitely possible. In the short run, we could even see a spike, similar to what we saw during the UK’s mini-budget crisis under Liz Truss.
Going forward, the trajectory of US yields will depend on two things:
- The fiscal choices made by the US—whether the budget is sustainable and whether there’s any long-term plan to rein in the debt.
- Whether global investors are still willing to finance US deficits, especially as confidence is also being dented by deteriorating geopolitical relationships, waning enthusiasm for the dollar, and reduced faith in Treasuries as safe-haven assets.
What could slow down this shift away from US debt? The lack of a clear alternative. Gold continues to attract demand from central banks and conservative investors looking to hedge trade and geopolitical risks. German and European bonds could offer an alternative with relatively stable political backdrops (despite the fading of austerity and the rise of the far right).
But a large-scale change in global portfolio thinking will take time. This means that if the US can get its fiscal house in order—by addressing debt concerns and proposing a credible budget—the tide could quickly turn back in favour of US bonds. A rally is still very much on the table, depending on how US politicians manage their debt, global partnerships, and strategic alliances.
On that note, the EU is reportedly preparing a trade proposal for the US that touches on key American interests, environmental standards, economic security, and a gradual reduction of tariffs to 0% on non-sensitive agricultural and industrial goods. But the bloc is also readying a plan B in case talks break down: $100+ billion worth of tariffs on US goods. The market could react either way—positive progress could extend the rally, but a breakdown and re-escalation would likely trigger a selloff across the Stoxx 600, which has now fully recovered and even exceeded its post-April 2 losses.
In the US, the surge in yields weighed heavily on equities. The S&P 500 dropped 1.6%, while the Nasdaq retreated 1.34%.
On the earnings front, both Home Depot and Lowe’s reported better-than-expected results, showing that consumer spending on home-related goods remains resilient. Notably, Home Depot said it has no plans to raise prices due to tariffs, as about half of its products are sourced domestically. But other retailers are less shielded. Walmart previously stated it would raise prices in response to tariffs, while Target missed both Q1 revenue and earnings, cut its full-year guidance, and cited tariff uncertainty, weak consumer sentiment, and backlash from rolling back DEI initiatives in January. That last point gives me some hope that not everything is about to collapse within a four-year term.
Elsewhere, Baidu dropped more than 4% despite posting stronger-than-expected Q1 results. Apple fell more than 2% after OpenAI announced its acquisition of a company called io—co-founded by Jony Ive, the former Apple design chief aiming to build new AI devices, with the first product expected sometime next year. We can’t wait!
Euro Area, US PMIs Resilience Tested Amid Trade Uncertainty
In focus today
Today's focus turns to euro area PMI data for May. Recent manufacturing data has exceeded expectations, showing minimal trade uncertainty. May's figures might reveal if recent growth was driven by front-loading exports to the US, potentially weakening manufacturing PMI. Meanwhile, services sector growth declined, with April's index at 50.1, a concern as it reflects consumer sentiment rather than tariff impacts.
In the US, May flash PMIs will be released from the US as well, the previous April data remained stronger than feared amid the trade war uncertainty.
Norges Bank will publish the Expectations Survey for Q2. Since the previous round, where inflation expectations had fallen below 2.5%, inflation has been higher than expected and the exchange rate has weakened. In addition, it may seem as if at least some corporates fear that the global trade war will also disrupt value chains and lead to higher inflation in Norway as well, so inflation expectations may have risen.
Overnight, Japan releases April inflation data. The inflation target has been exceeded for three years, driven mainly by food prices, with rice rising 92% over the past year. Tokyo data indicates broader price pressures in April, but a Bank of Japan rate hike is likely delayed until autumn.
Economic and market news
What happened overnight
In the US, the House Rules Committee advanced Trump's 'big, beautiful bill' to the House floor, with a vote set for today. Some Republicans have criticised the bill for lacking sufficient spending cuts, and the non-partisan Congressional Budget Office estimates the bill will increase the US debt by USD 3.8 trillion, reaching USD 36.2 trillion over the next decade.
What happened yesterday
In the UK, inflation data for April significantly surpassed expectations, with headline inflation at 3.5% y/y (BoE: 3.4%, cons: 3.3%) and services at 5.4% y/y (BoE: 5.0%, cons: 4.8%). This suggests a more cautious approach from the BoE amid stagflationary concerns. Factors like service indexation, energy bills, and seasonal effects complicate assessing underlying price pressures.
Equities: Global equities ended yesterday in the red, down more than 1%, but the real story lies in the cross-asset dynamics continuing to unfold beneath the surface. Once again, we saw US equities underperform in an environment where equities fell while long-end rates rose - especially in the US - and the dollar weakened. Adding to this was a rally in crypto assets, with Bitcoin pushing to new highs despite signs of deteriorating risk appetite. US tech led the downside and yesterday marked the fifth consecutive session where defensive sectors outperformed cyclicals.
Drilling into intraday price action, it once again becomes clear that the market is not macro-driven. Economic releases were sparse, but US bond markets were active: the 20-year Treasury auction, held at 19:00 CET (after the European cash close), came out weaker than expected. Yields moved higher, and equities turned sharply lower at that precise moment. Taking the classic approach from a long-only equity portfolio manager, one would expect banks to perform well in an environment where yields are higher, driven by the long end of the curve. However, that was not the case yesterday, with banks massively underperforming in the US. This is, of course, due to yields rising and curve steepening for all the wrong reasons. Not surprisingly, this also led to a sell-off in small caps. In the US yesterday, Dow -1.9%, S&P 500 -1.6%, Nasdaq -1.4%, Russell 2000 -2.8%. This morning, Asian markets are lower, along with European futures (both as catch-up to the US cash session yesterday). US futures are higher and some calmness now across asset classes.
FI&FX: While rates have come a little lower overnight the most important market development over the last 24 hours has been the bearish steepening of yield curves amid rising US public debt sustainability concerns. In FX space the JPY and CHF have been the primary beneficiaries while EUR/USD notably has been more stable just above 1.13. In the Scandies, both NOK and SEK proved remarkably resilient to the sell-off in risky assets during yesterday's US session and bears monitoring this morning.
USD/CAD Daily Outlook
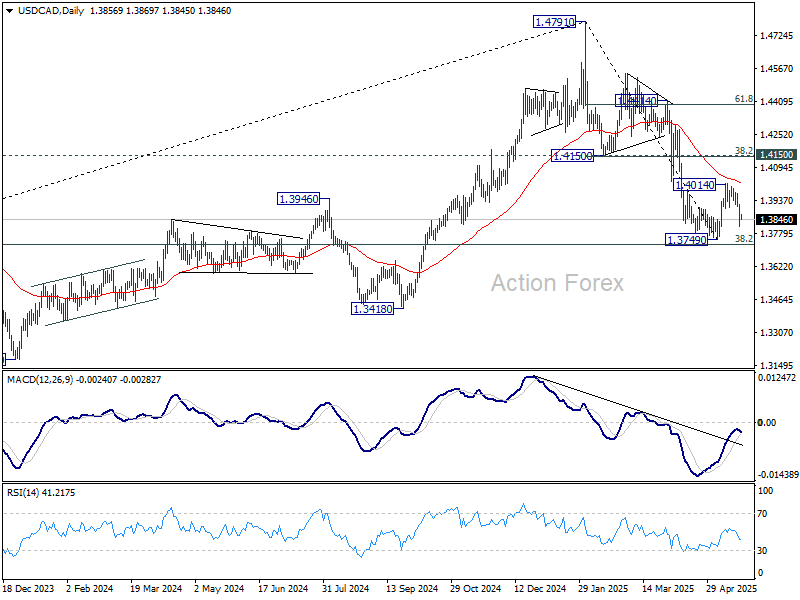
Daily Pivots: (S1) 1.3808; (P) 1.3865; (R1) 1.3917; More...
Intraday bias in USD/CAD remains on the downside for the moment. Rebound from 1.3749 could have completed as a correction at 1.4014. Deeper fall should be seen for retesting 1.3749. Firm break there will resume whole decline from 1.4791. For now, risk will remain on the downside as long as 1.4014 resistance holds, in case of recovery.
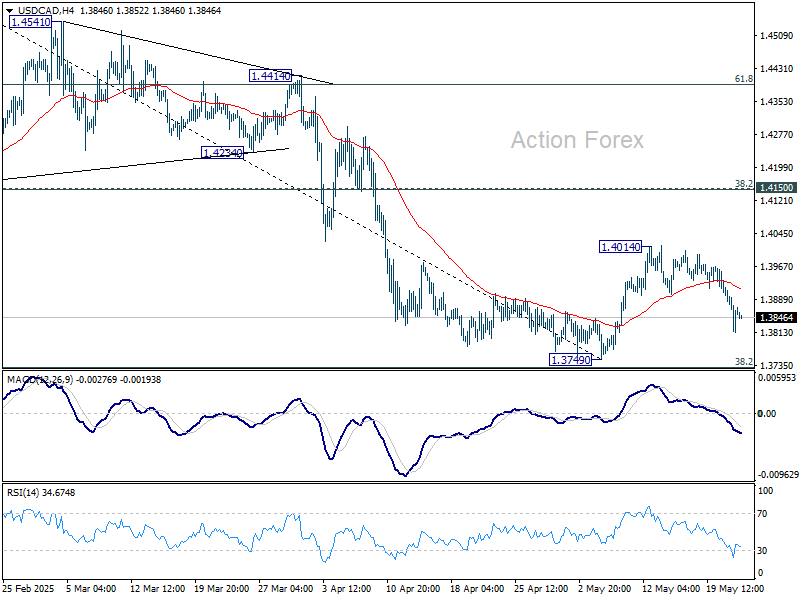
In the bigger picture, price actions from 1.4791 medium term top could either be a correction to rise from 1.2005 (2021 low), or trend reversal. In either case, further decline is expected as long as 1.4150 resistance turned support holds. Firm break of 38.2% retracement of 1.2005 (2021 low) to 1.4791 at 1.3727 will pave the way back to 61.8% retracement at 1.3069.
AUD/USD Daily Report
Daily Pivots: (S1) 0.6409; (P) 0.6439; (R1) 0.6467; More...
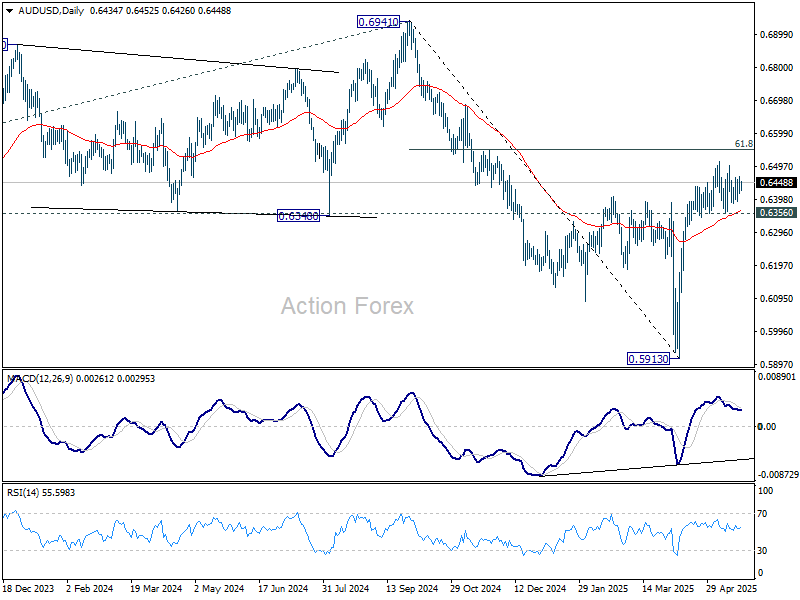
AUD/USD is staying in sideway trading and intraday bias remains neutral. Further rise is in favor with 0.6356 support intact. One the upside, break of 0.6511 will resume the rise from 0.5913 and target 61.8% retracement of 0.6941 to 0.5913 at 0.6548. However, firm break of 0.6356 will bring deeper pullback to 38.2% retracement of 0.5913 to 0.6511 at 0.6283 first.
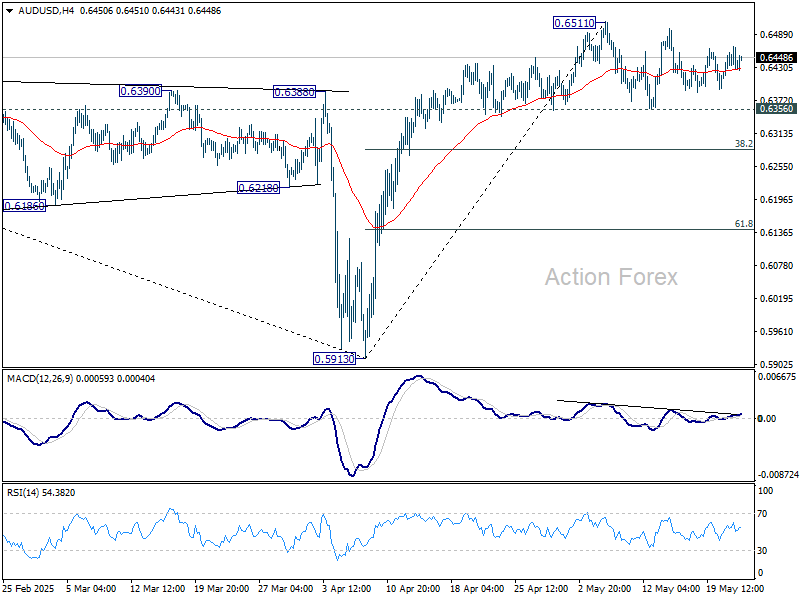
In the bigger picture, as long as 55 W EMA (now at 0.6438) holds, down trend from 0.8006 (2021 high) should resume later to 61.8% projection of 0.8006 to 0.6169 from 0.6941 at 0.5806. However, sustained trading above 55 W EMA will argue that a medium term bottom was already formed, and set up further rebound to 0.6941 resistance instead.