Sample Category Title
EUR/GBP Daily Outlook
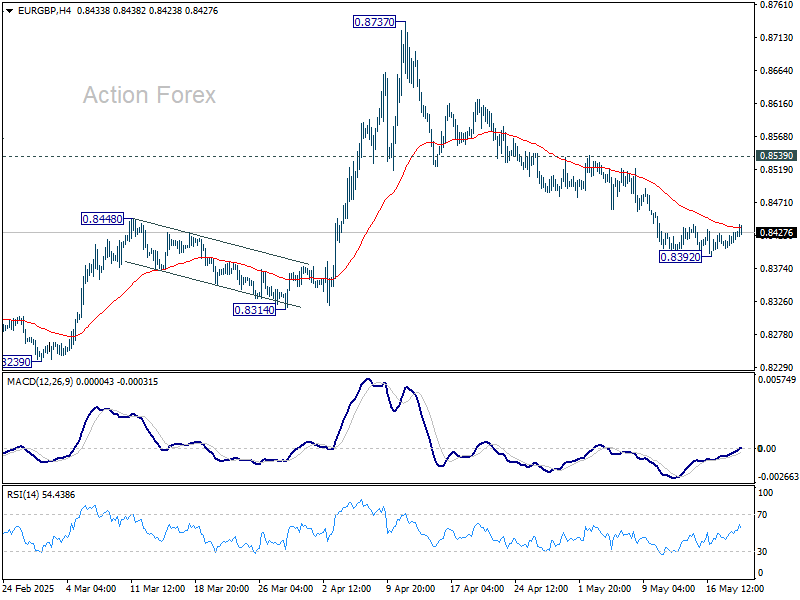
Daily Pivots: (S1) 0.8399; (P) 0.8414; (R1) 0.8442; More...
Intraday bias in EUR/GBP is turned neutral as recovery from 0.8392 extends. More consolidations could be seen but further decline remains in favor as long as 0.8539 resistance holds. Below 0.8392 will resume the fall from 0.8737 to 0.8221/8239 support zone.
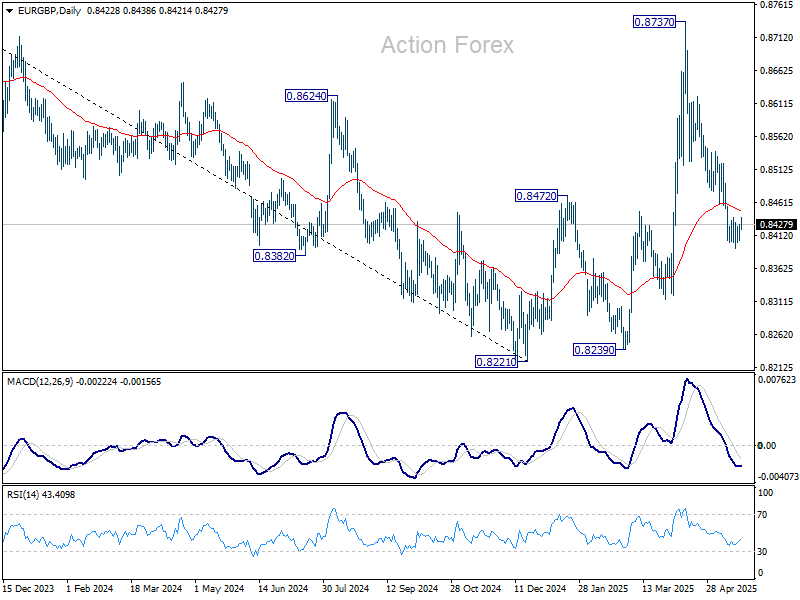
In the bigger picture, current development suggests that price actions from 0.8221 medium term bottom are merely forming a corrective pattern. However, there is no clear momentum to break through 0.8201 key support (2022 low) yet. Hence, range trading is expected between 0.8221/8737 for now.
EUR/AUD Daily Outlook
Daily Pivots: (S1) 1.7434; (P) 1.7520; (R1) 1.7652; More...
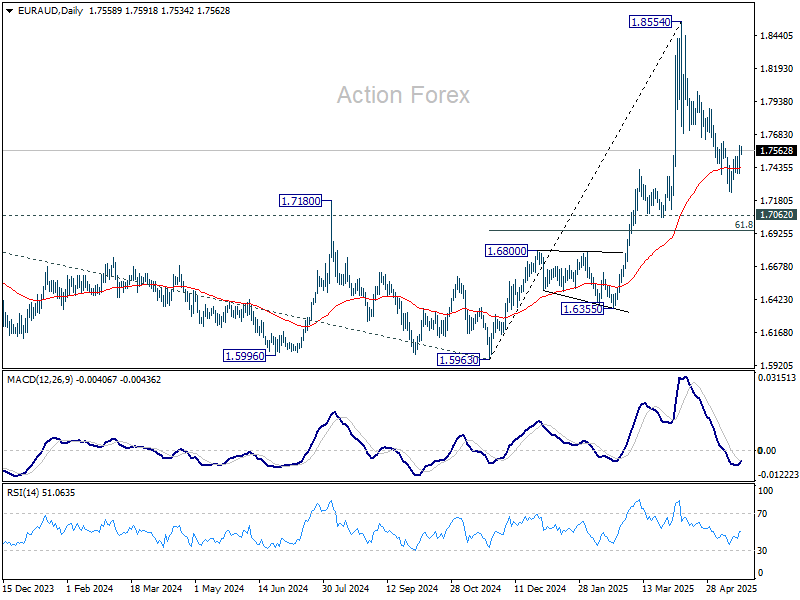
EUR/AUD is still limited range below 1.7628 resistance and intraday bias stays neutral. On the upside, firm break of 1.7628 will suggest that fall from 1.8554 as completed as a correction, and retain larger bullishness. Intraday bias will be back on the upside for stronger rebound. However, below 1.7245 will resume the fall to 61.8% retracement of 1.5963 to 1.8554 at 1.6953.
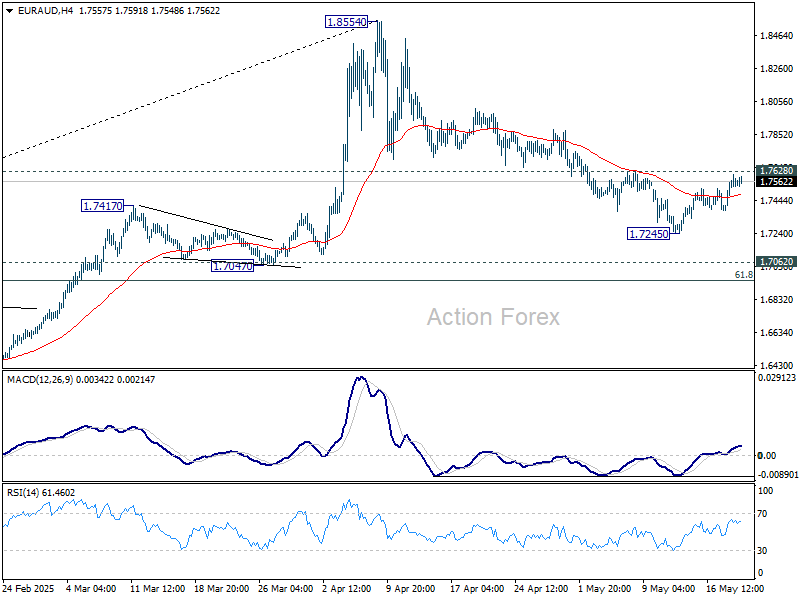
In the bigger picture, as long as 1.7062 resistance turned support (2023 high) holds, up trend from 1.4281 (2022 low) should still be in progress. Break of 1.8554 will target 100% projection of 1.4281 to 1.7062 from 1.5963 at 1.8744. However, sustained break of 1.7062 will confirm medium term topping and bring deeper fall back to 1.5963 support.
EUR/CHF Daily Outlook
Daily Pivots: (S1) 0.9334; (P) 0.9361; (R1) 0.9375; More....
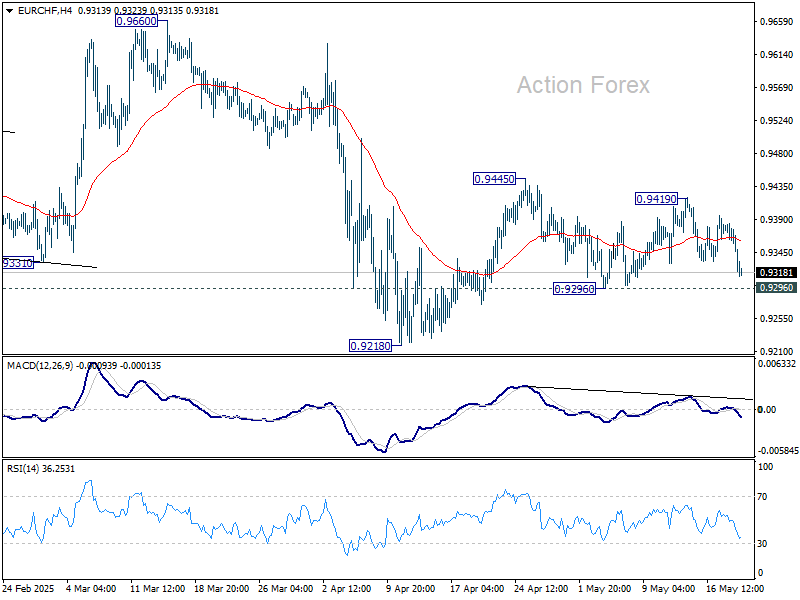
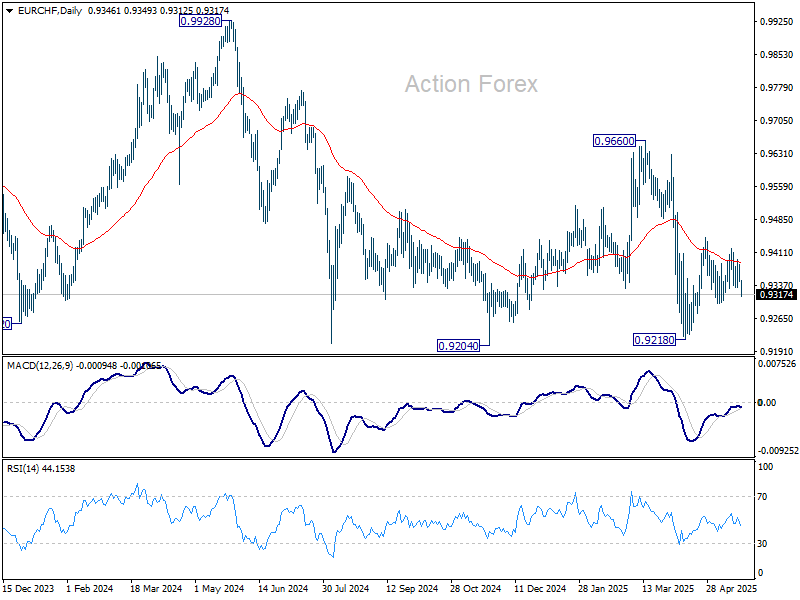
No change in EUR/CHF's outlook as range trading continues. Intraday bias stays neutral at this point. Price actions from 0.9218 are seen as either a corrective move or the third leg of the pattern from 0.9204. On the upside, break of 0.9419 will resume the rise from 0.9218 through 0.9445 resistance. However, break of 0.9296 support will bring retest of 0.9218 low.
In the bigger picture, prior rejection by long-term falling channel resistance (now at 0.9548) retains medium term bearishness. That is, down trend from 1.2004 (2018 high) is still in progress. Firm break of 0.9204 (2024 low) will confirm resumption. This will remain the favored case as long as 0.9660 resistance holds.
Elliott Wave Analysis: EURUSD 5-Wave Rally Confirms Bullish Trend
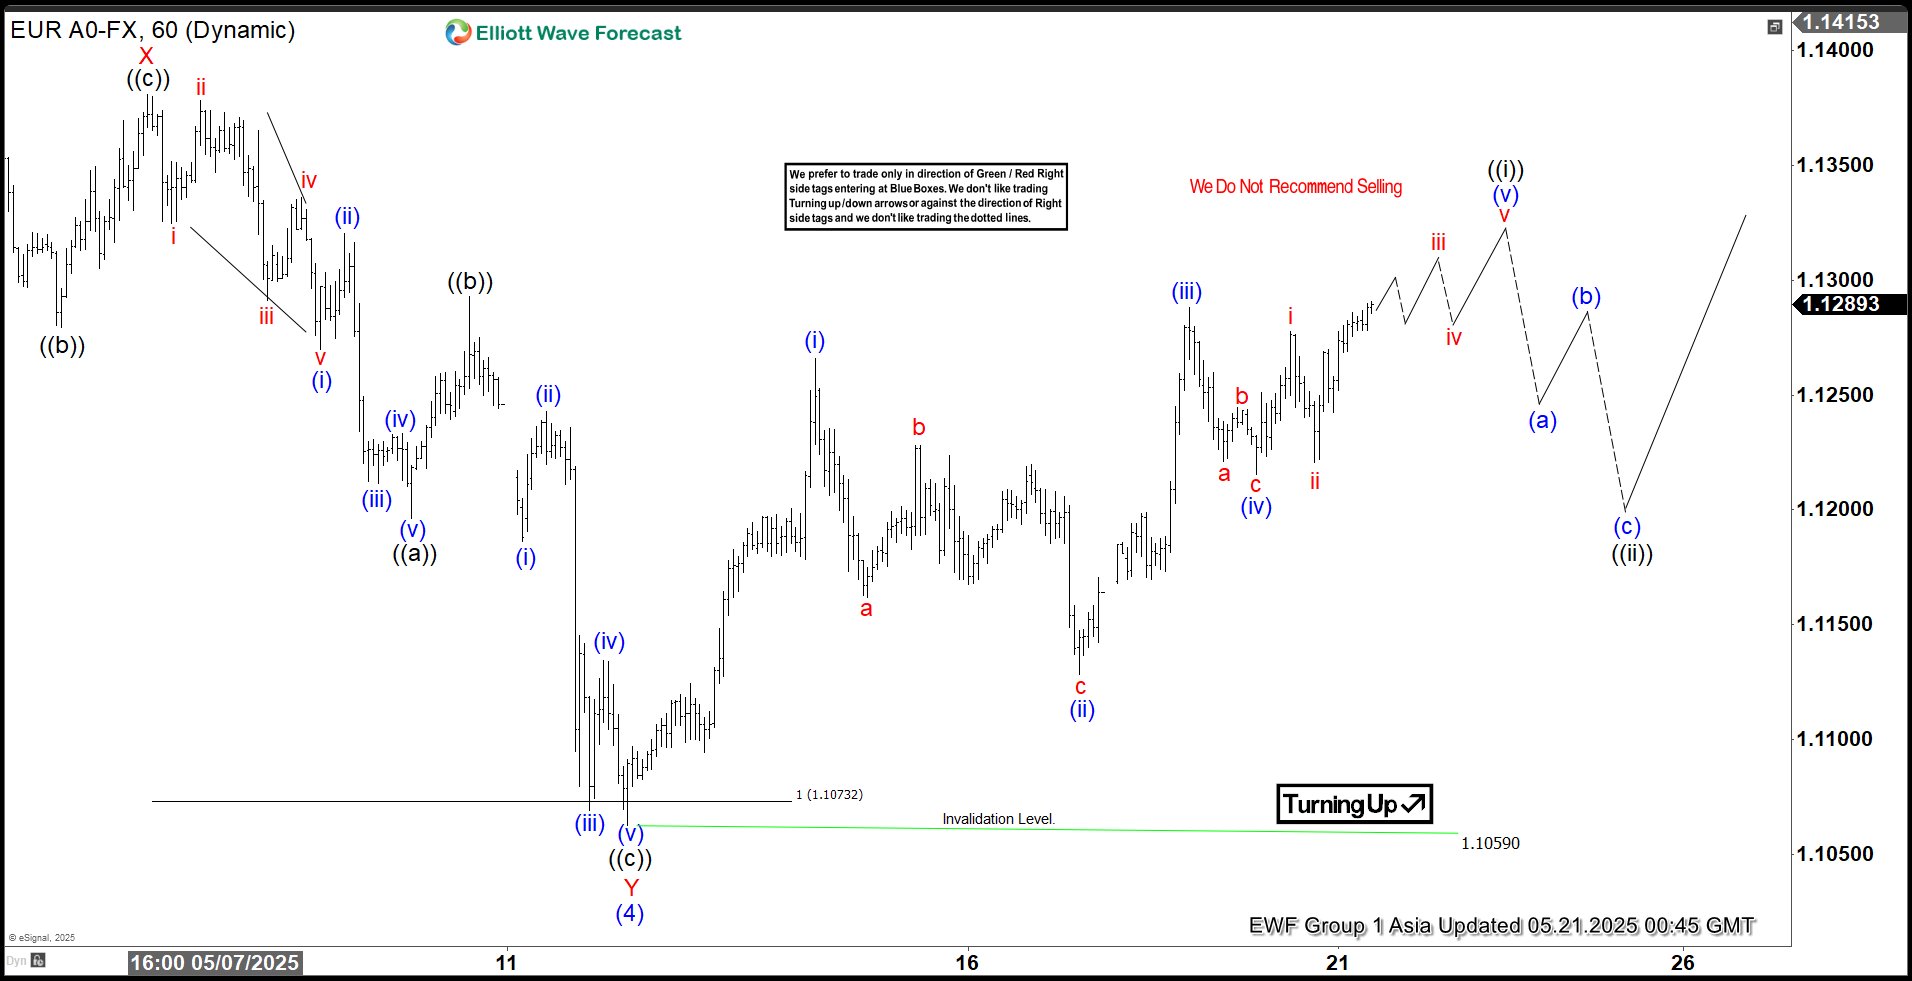
The short-term Elliott Wave analysis for EURUSD indicates that the correction from the April 21, 2025, high has concluded with wave (4) at 1.1059. From the wave (3) peak, the decline unfolded as follows: wave W ended at 1.1265, wave X at 1.1381, and wave Y, structured as a zigzag, completed at 1.1059. Within wave Y, wave ((a)) reached 1.1196 and wave ((b)) hit 1.1292. Wave ((c)) lower concluded at 1.106, finalizing wave Y of (4). The pair has since turned upward in wave (5).
From the wave (4) low, the rally in wave ((i)) is developing as a five-wave diagonal pattern. Wave (i) peaked at 1.1265, followed by a pullback in wave (ii) to 1.1128. Then wave (iii) advanced to 1.1288, and wave (iv) retraced to 1.1215. Wave (v) is expected to conclude soon, completing wave ((i)) in a higher degree. Subsequently, a pullback in wave ((ii)) should correct the cycle from the May 13, 2025, low before the pair resumes its upward trend. As long as the 1.106 pivot low holds, any near-term pullback is likely to attract buyers in a 3, 7, or 11-swing pattern, supporting further upside.
EURUSD 60-Minute Elliott Wave Technical Chart
EURUSD Elliott Wave Technical Video
https://www.youtube.com/watch?v=20Y5Nv6pFgE
EUR/USD Regains Pace While USD/JPY Dips Further
EUR/USD started a decent upward move above the 1.1225 resistance. USD/JPY declined below 144.50 and is currently consolidating losses.
Important Takeaways for EUR/USD and USD/JPY Analysis Today
- The Euro found support and started a recovery wave above the 1.1250 resistance zone.
- There is a connecting bullish trend line forming with support at 1.1280 on the hourly chart of EUR/USD at FXOpen.
- USD/JPY is trading in a bearish zone below the 146.10 and 144.90 levels.
- There is a short-term bearish trend line forming with resistance at 144.25 on the hourly chart at FXOpen.
EUR/USD Technical Analysis
On the hourly chart of EUR/USD at FXOpen, the pair started a fresh increase from the 1.1135 zone. The Euro climbed above the 1.1200 resistance zone against the US Dollar.
The pair even settled above the 1.1225 resistance and the 50-hour simple moving average. Finally, it tested the 1.1340 resistance. A high is formed near 1.1339 and the pair is now consolidating gains above the 23.6% Fib retracement level of the upward move from the 1.1223 swing low to the 1.1339 high.
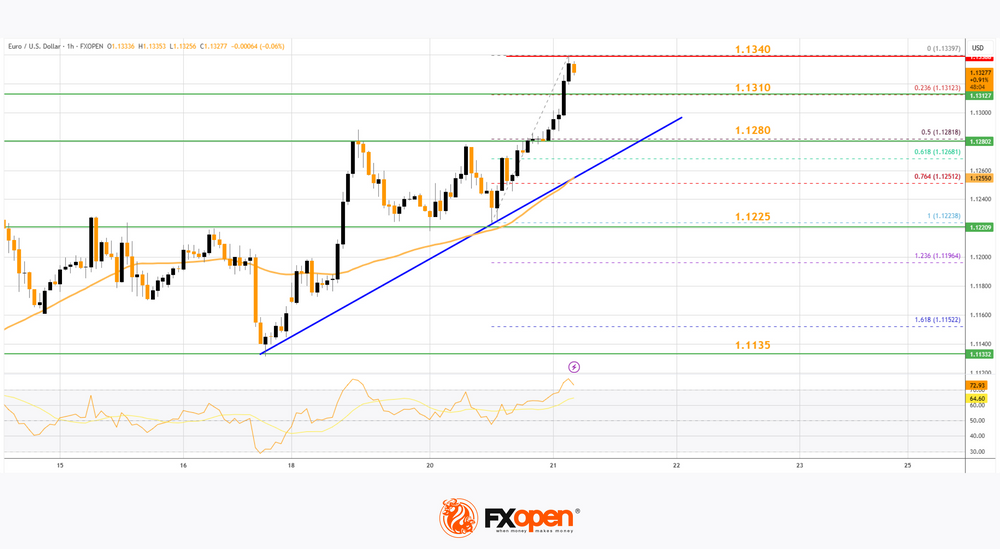
Immediate support is near the 1.1310 level. The next major support is at 1.1280. There is also a connecting bullish trend line forming with support at 1.1280 and the 50% Fib retracement level of the upward move from the 1.1223 swing low to the 1.1339 high.
If there is a downside break below 1.1280, the pair could drop toward the 1.1225 support. The main support on the EUR/USD chart is near 1.1135, below which the pair could start a major decline.
On the upside, the pair is now facing resistance near 1.1340. The next major resistance is near the 1.1420 level. An upside break above 1.1420 could set the pace for another increase. In the stated case, the pair might rise toward 1.1550.
USD/JPY Technical Analysis
On the hourly chart of USD/JPY at FXOpen, the pair started a steady decline from well above the 146.00 zone. The US Dollar gained bearish momentum below the 145.00 support against the Japanese Yen.
The pair even settled below the 144.50 level and the 50-hour simple moving average. There was a spike below 144.00 and the pair traded as low as 143.72. It is now consolidating losses with a bearish angle. Immediate resistance on the USD/JPY chart is near the 23.6% Fib retracement level of the recent decline from the 146.10 swing high to the 143.42 low at 144.25.
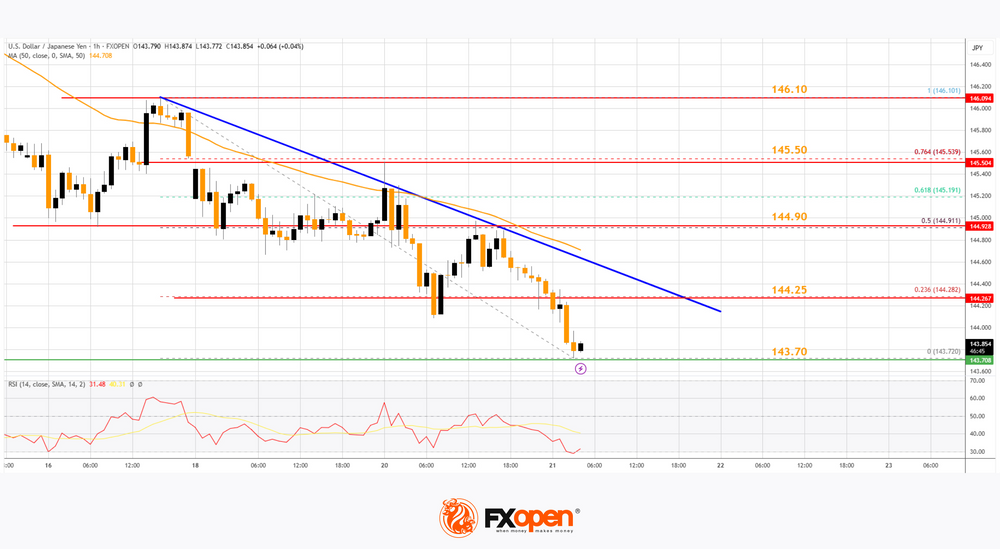
There is also a short-term bearish trend line forming with resistance at 144.25. The first major resistance is near the 144.90 zone and the 50% Fib retracement level of the recent decline from the 146.10 swing high to the 143.42 low.
If there is a close above the 144.90 level and the hourly RSI moves above 50, the pair could rise toward 145.50. The next major resistance is near 146.10, above which the pair could test 147.50 in the coming days.
On the downside, the first major support is near 143.70. The next major support is near the 143.20 level. If there is a close below 143.20, the pair could decline steadily. In the stated case, the pair might drop toward the 142.00 support.
Trade over 50 forex markets 24 hours a day with FXOpen. Take advantage of low commissions, deep liquidity, and spreads from 0.0 pips. Open your FXOpen account now or learn more about trading forex with FXOpen.
This article represents the opinion of the Companies operating under the FXOpen brand only. It is not to be construed as an offer, solicitation, or recommendation with respect to products and services provided by the Companies operating under the FXOpen brand, nor is it to be considered financial advice.
High Inflation Ties BoE’s Hands
Markets
Core bond yields finished higher yesterday. US rates added up to 6.7 bps and Germany up to 5 bps at the very long end of the curve (30-yr). That happened in a session stripped of important economic data but in the wake of Japanese long-term bond yields (>=30y) surging to records highs. The specific trigger for the latter was a poor 20-yr bond sale but the underlying drivers – fiscal risks combined with central banks leaving the stage – are shared by the likes of Europe and especially the US. An umpteenth warning by the IMF, calling on the US to address its “ever-increasing” debt burden is case in point. UK gilt yields rose as well but more evenly across the curve (+3-4 bps). Bank of England chief economist Pill supported front-end rates with his view on UK interest rates going down too fast. He advocates a slower (than quarterly) BoE cutting pace. Several US central bankers including SF’s Daly and Cleveland’s Hammack held the wait-and-see line. St. Louis Fed president Musalem stressed the importance of keeping inflation expectations in check. Pill nor the Fed policymakers supported their respective currencies. EUR/GBP rose marginally to 0.842, extending the streak of directionless trading since May 12. This morning’s UK CPI numbers fail to break the impasse despite them coming in on the (very) high end of expectations. Headline inflation accelerated 1.2% m/m to 3.5% y/y. The core gauge quickened from 3.4% to 3.8% and services inflation – together with elevated pay increase a key worry for BoE’s Pill – shot up to 5.4% from 4.7%, the fastest pace since August of last year. EUR/GBP keeps earlier gains to hold steady around 0.843. High inflation ties the BoE’s hands even though the economy could use some support. EUR/USD’s mid-May rebound continues with the pair closing near 1.13 yesterday and topping that in Asian dealings this morning. The Japanese yen also seizes the moment, pushing USD/JPY further lower into the 143.6 area. Long-term bond yields in the country increase once again with the 30-yr at some point adding more than 8 bps before paring gains a bit. US yields join the move higher. We have a particular focus on the long end of the curve with the upcoming $16 bn 20-yr bond sale potentially being an interesting one after the flopped auction in Japan yesterday. The sale happens in the face of the lingering fiscal risks and with Trump’s bill maneuvering a way through the SALT discussions in House. We stay cautious on the US dollar. The first meaningful EUR/USD resistance at 1.157 is still some way though.
News & Views
In speech looking forward to the next 2028-2023 European Union Budget, European Commission head Ursula von der Leyen indicated that the EU budget should be more flexible, more focused and funded by new revenues amongst others to repay for joined EU borrowing in the wake of the pandemic. Von der Leyen advocates that the budget will have to cope with new geopolitical topics, the trade war, climate change and technological changes. The EU budget currently only amounts to just over 1.0% of GDP and 90% is already rigidly assigned to fixed topics (e.g. agriculture) at the time when it was set up in 2019 & 2020. The next budget will have to be able to respond fast to new challenges. Rather than reimbursing some national spending once a project is completed, the new EU budget should work more according to the principles of the pandemic fund, linking disbursements to achieving milestones and targets. As a growing part of the next budget will have to go to repaying the funding provided by the pandemic fund, new sources will have to be found for financing existing and new policies.
Japanese trade data for the month of April this morning showed that exports rose 2.0% Y/Y. Imports declined 2.2% compared to the same month last year. The trade balance turned slightly negative to JPY 116 bln. The closely monitored trade surplus with the US printed at JPY 760.5 bln from JPY 846.9 bln in March, but still 14.3 bln higher compared to the same month last year. The US-Japan trade imbalance might be a topic when Japanese Finance Minister Kato meets US Treasury Secretary Bessent at the G7 meeting in Canada later this week. Recent comments indicated that FX policy/the yen weakness might be discussed in the negotiations for a trade agreement between the US and Japan after president Trump announced reciprocal tariffs last month.
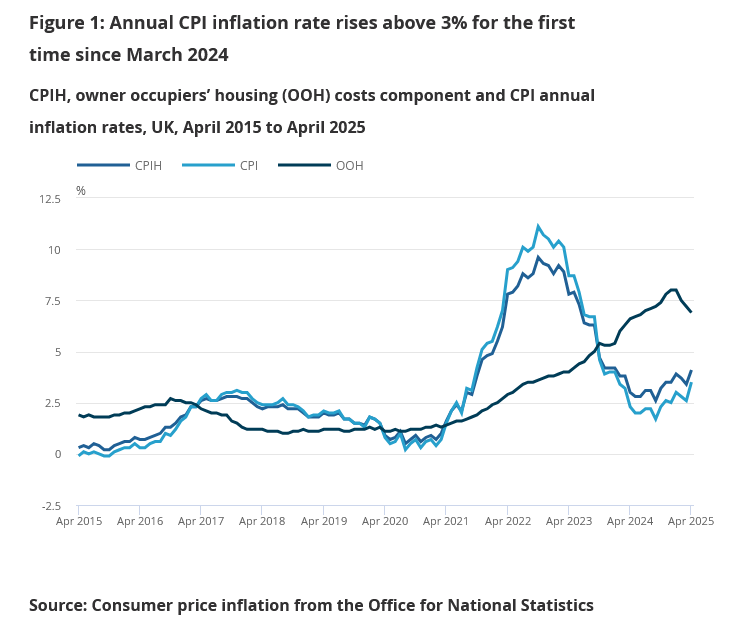
UK CPI surges to 3.5% in April, core jumps to 3.8%
UK inflation came in hotter than expected in April, with headline CPI rising 1.2% mom versus expectation f 1.1% mom. Annual CPI accelerated from 2.6% yoy to 3.5% yoy, above the 3% mark for the first time since March 2024.
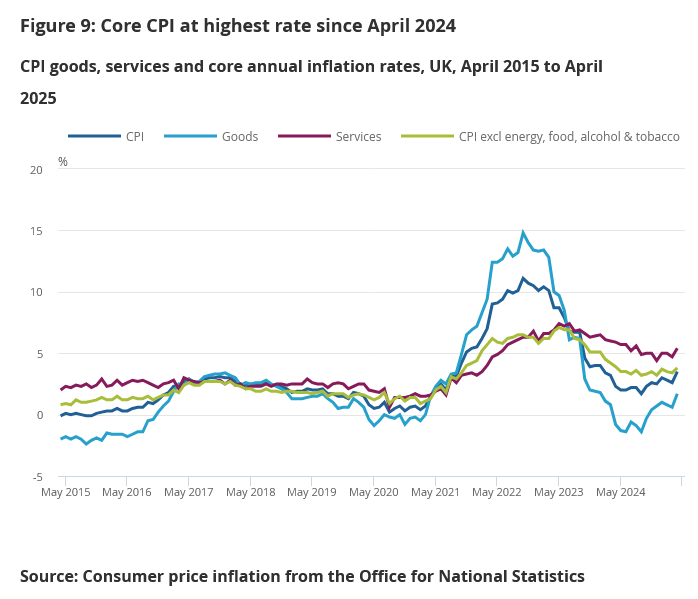
Core CPI, which strips out energy, food, alcohol and tobacco, climbed sharply from 3.4% yoy to 3.8% yoy, its highest level since April 2024.
Breakdowns show a sharp jump in both goods and services inflation. Goods inflation accelerated from 0.6% yoy to 1.7% yoy, while services inflation climbed from 4.7% yoy to 5.4% yoy , highlighting the strength of domestic price pressures.
Oil Jumps on Mid-East Rumours, USD Weakens
US equities retreated yesterday—ending a six-day rally—and the US dollar weakened as the selloff in long-term US Treasuries continued. The move came amid fraught budget negotiations in Washington over deficit spending and a proposed giant tax-cut bill, further exacerbated by Moody’s recent US rating downgrade. The concern is simple: if the US can't cut spending while also enacting sweeping tax cuts, the deficit will continue to balloon. And if markets—if investors—aren’t willing to play along, there’s little the government can do. Remember the Liz Truss mini-budget crisis in the UK? If investors say no, it’s no. At the moment, investors remain skeptical. The US 30-year yield is hovering just below the 5% mark—its highest since 2023 and edging closer to levels not seen since 2007.
In FX markets, option traders remain pessimistic about the dollar’s prospects for 2025. The one-year risk reversals—a gauge that reflects whether investors are hedging more with calls or puts—have dropped to the most negative level on record, according to Bloomberg. This is notable because risk reversals have rarely turned sharply negative in the past. Investors typically don’t hedge against dollar depreciation; historically, the greenback has attracted safe-haven flows during global market stress. But that relationship appears to be breaking down. If the dollar is no longer seen as a reliable safe haven, then investors need to hedge FX risk when buying dollar-denominated assets—even S&P 500 or Nasdaq stocks. That added demand for protection can in turn amplify pressure on the dollar.
In summary, the dollar is now facing a double whammy: downward pressure from weak growth expectations and a cautious Federal Reserve (Fed), combined with a possible erosion of its safe-haven status.
Oil jumps on Middle East rumours, USD weakens
US crude briefly spiked above its 50-day moving average (DMA) this morning following reports that Israel is preparing to strike Iran. However, crude slipped back below its 50-DMA as the bulls failed to hold the line. The medium-term outlook for oil remains bearish, weighed by uncertain global demand and ample supply. For longer-term traders, resistance sits around $65.30—the 38.2% Fibonacci retracement of this year’s decline. This level could offer selling opportunities on rebounds, unless the Middle East tensions escalate further.
Rising geopolitical tensions and fading demand for the dollar have lifted gold, the euro, the Swiss franc, and the Japanese yen. Gold climbed back above $3,300 per ounce this morning. The USD/CHF has resumed sharp declines, reigniting concerns about the competitiveness of Swiss exports and increasing the likelihood of a rate cut to 0% by the Swiss National Bank (SNB) next month. There’s also speculation that the SNB may be intervening near the 0.92 level to prevent excessive franc appreciation against the euro, as 40–45% of Swiss exports go to the eurozone.
The Euro, meanwhile, remains broadly strong. The EUR/USD has gained upward momentum since bouncing off its 50-DMA earlier this month. Trend and momentum indicators have yet to turn decisively bullish, but the RSI remains mid-range—suggesting room for further gains.
The British pound is gearing up for another test of the 1.35 level—its third attempt in the past eight months. However, sterling continues to underperform against the euro, despite recent progress in post-Brexit negotiations. This may reflect a perception that the new deal favors continental Europe, or it could be a broader vote of confidence in the euro amid the dollar’s struggles.
In Japan, the USD/JPY is sliding back toward the 140 level after breaking below 144 in Tokyo trading. The latest trade data showed a slowdown in export growth and smaller-than-expected declines in imports—likely a result of recent yen strength and rising trade tensions. While these data points hint at slower growth, Japanese bond markets are pricing in the continuation of the Bank of Japan’s (BoJ) normalization policy, with potential rate hikes to contain inflation. That expectation has pushed yields higher and is weighing on the Nikkei, which is now testing its 100-DMA to the downside.
European equities, however, are benefiting from renewed investor interest in defense stocks and the view that a stronger euro could help tame inflation in the eurozone. That, in turn, would allow the European Central Bank (ECB) to adopt a more accommodative stance.
Euro Area Consumer Sentiment Beats Forecasts
In focus today
This morning, Danske Research hosts a webinar on the US-China outlook following last week's trade deal.
The UK CPI inflation data for April is set to be a significant release, particularly for the BoE, as it has historically led to notable market reactions. Consensus anticipates services inflation to increase to 4.8% y/y (prior: 4.8%), slightly below the BoE's expectation of 5.0%.
Economic and market news
What happened yesterday
In euro area, consumer confidence increased more than expected in May to -15.2, up from -16.0 and surpassing the consensus of 16.6. This increase is likely due to positive shifts in US trade policy. While confidence has improved, it remains low, matching last year's levels when the economic situation was worse. It is important to view these figures cautiously, as various positive elements support private consumption. Rising wages, decreasing inflation, lower interest rates, increasing housing prices, and a strengthening labour market are expected to boost spending, even if low consumer confidence suggests otherwise.
In Denmark, GDP contracted by 0.5% q/q in Q1, mainly due to the pharmaceutical industry, while the rest of the economy grew by 1.0%. Despite this downturn, growth will reach 1.6% for 2025 even if there is zero q/q growth for the rest of the year, and the government's 3% growth expectation for this year remains attainable. Consumer confidence fell to -18.4 in May (prior: -17.0), reflecting increased negativity about the current state of the economy. However, despite low consumer confidence, factors such as wages, decreasing inflation, lower interest rates, rising house prices, and a strong labour market may support spending and overall economic growth.
Equities: Equity markets declined yesterday, taking a pause after a prolonged period of gains - although, to be honest, the moves were marginal. What is far more interesting is the underlying dynamic playing out within equities, sectors, regions, and across asset classes. For the fourth consecutive session, defensive stocks outperformed cyclicals. US equities underperformed global peers, and the dollar weakened alongside a steeper yield curve in the US - all pointing to a market grappling with elevated uncertainty around US fiscal policy and the role of Treasuries and the dollar as portfolio diversifiers and safe havens. This morning, we are seeing some continuation of yesterday's trends: most Asian equity markets are trading higher, European equity futures are marginally higher or flat, while US futures are modestly lower. The dollar continues to weaken.
FI&FX: The dollar has weakened overnight with EURUSD now trading around 1.1330 and where safe haven currencies JPY and CHF have gained. Brent oil is c.1% higher, above 66 USD/barrel on CNN reports that Israel may strike Iran's nuclear facilities. Treasury yields are trading higher with the 30Y close to the 5.00% mark and 10Y UST at 4.51%. We expect long-end UST term premia to continue trending higher.
USD/CAD Daily Outlook
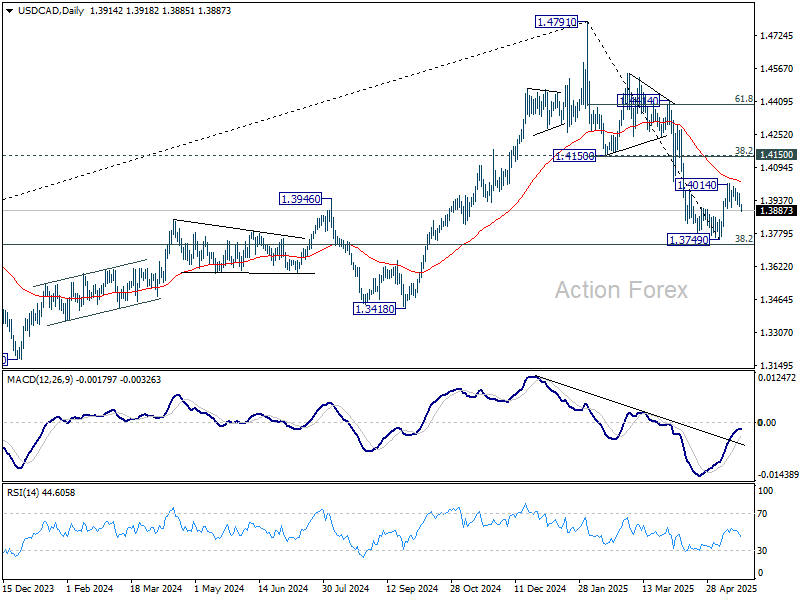
Daily Pivots: (S1) 1.3894; (P) 1.3931; (R1) 1.3954; More...
USD/CAD's break of 1.3898 support suggests that rebound from 1.3749 has completed as a correction at 1.4014. Intraday bias is back on the downside for retesting 1.3749. Firm break there will resume whole fall from 1.4791. For now, risk will remain on the downside as long as 1.4014 resistance holds, in case of recovery.
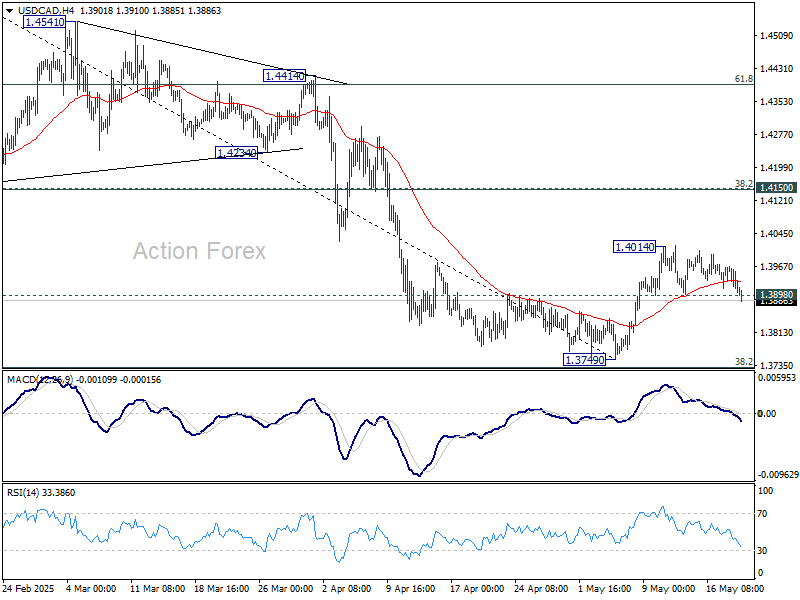
In the bigger picture, price actions from 1.4791 medium term top could either be a correction to rise from 1.2005 (2021 low), or trend reversal. In either case, further decline is expected as long as 1.4150 resistance turned support holds. Firm break of 38.2% retracement of 1.2005 (2021 low) to 1.4791 at 1.3727 will pave the way back to 61.8% retracement at 1.3069.