Sample Category Title
USD/JPY Bulls Remain Cautiously Active
- USD/JPY tiptoes higher; forms encouraging candlestick pattern
- A slew of obstacles still lie ahead; bullish outlook above 147.50
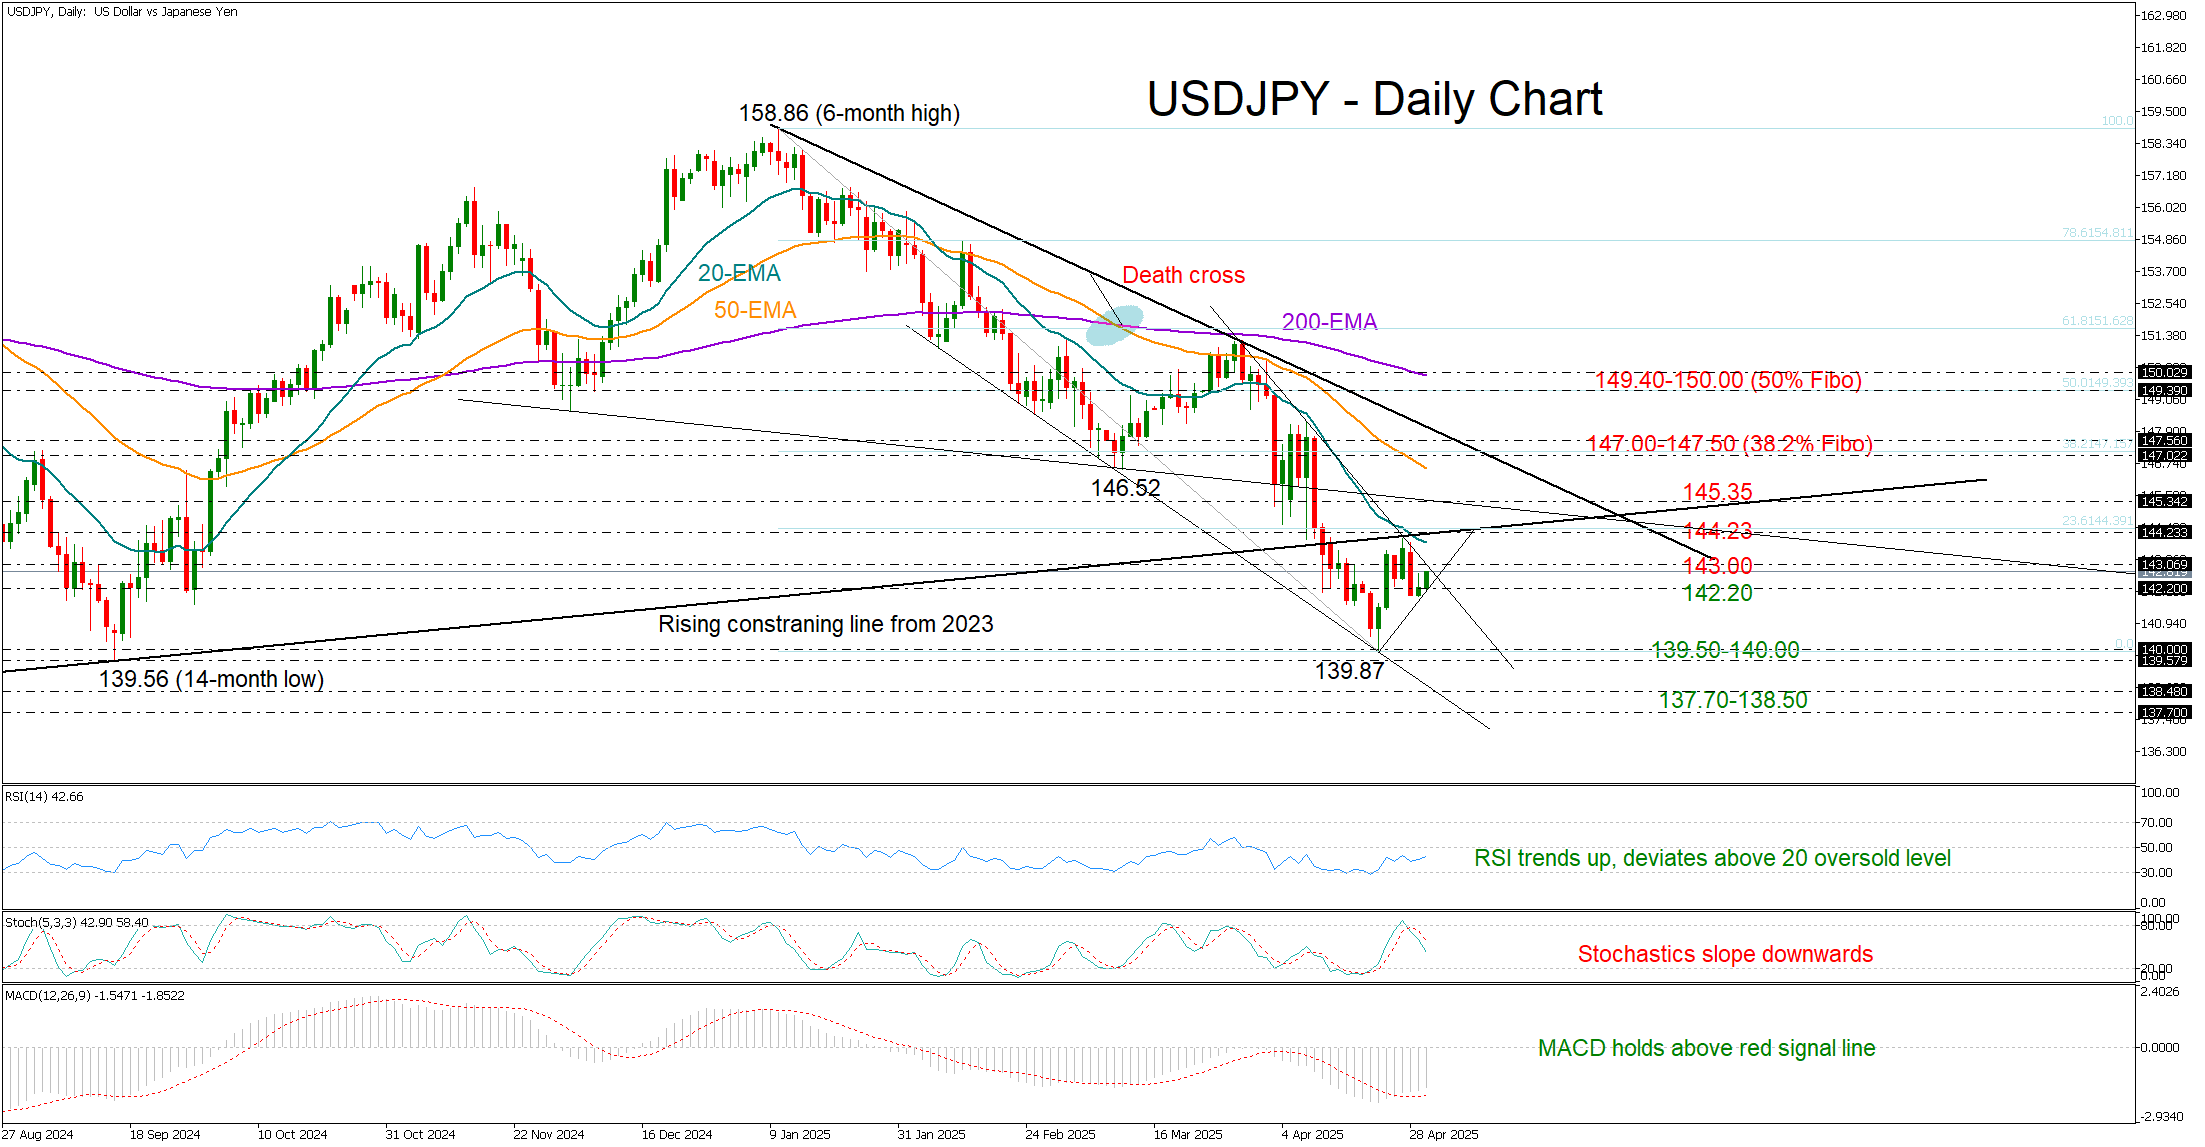
USDJPY attempted a modest recovery after dipping to 141.95 early in the week. While Tuesday’s bullish move was limited, the formation of a small, inverted hammer candlestick suggests potential for upward momentum. Confirmation, however, would require a solid green candlestick to follow.
The upward trajectory in the RSI and MACD keeps hopes for a rebound alive as investors await the release of US Q1 GDP growth and core PCE data later today. On the other hand, the falling stochastics undermine the strength of any potential bullish action, while the negative slope in the exponential moving averages (EMAs) lends further support to the prevailing downtrend.
Immediate resistance lies at the 143.00 mark, followed by the 20-day EMA and the 144.23–145.35 constraining zone. A break higher could open the door to the 50-day EMA and the tentative resistance trendline near 147.50 – also the 38.2% Fibonacci retracement of the 2025 downtrend.
On the downside, a close below 142.20 could drag the pair back toward 139.50–140.00. A deeper decline could test support at 137.70–138.50, and potentially 137.20, a break of which could clear the way to 132.85.
In summary, while USDJPY bulls remain cautiously active, a confirmed bullish outlook hinges on a decisive move above 147.50.
Pound and Euro Edge Higher Ahead of Key Macroeconomic Data
The EUR/USD and GBP/USD currency pairs are showing moderate gains amid a consolidation of market expectations ahead of the release of crucial macroeconomic indicators. Tomorrow, investor focus will shift to data on inflation, consumer spending trends, and manufacturing sector activity—figures that could significantly reshape expectations for monetary policy in the world's leading economies. Heightened speculative activity ahead of these releases is contributing to increased market volatility and may trigger a retest of local highs and lows in major currency pairs.
GBP/USD
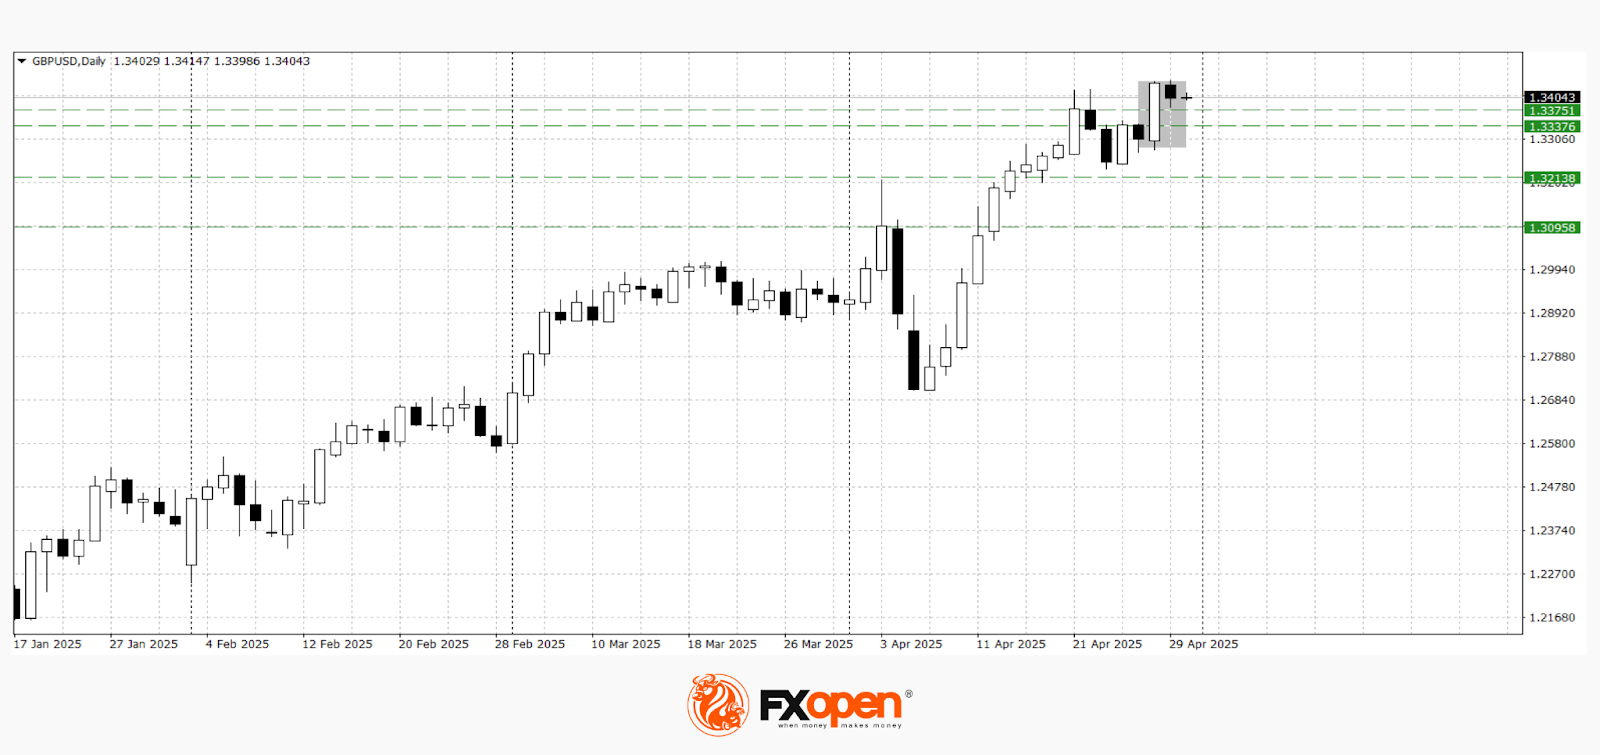
At the start of the trading week, GBP/USD buyers managed to test the 2024 highs near 1.3440. A pullback from last year’s peak has resulted in the formation of a bearish “Harami” candlestick pattern on the daily chart. If the pair fails to hold above the 1.3370–1.3340 range, a downward correction may unfold towards the 1.3200–1.3100 zone. Conversely, a break above 1.3440 could reignite bullish momentum.
The following events may influence the price dynamics of GBP/USD:
- Today at 12:00 (GMT+2): 3-year Gilt auction, United Kingdom
- Today at 15:15 (GMT+2): ADP Non-Farm Employment Change, United States
- Today at 15:30 (GMT+2): US GDP data
- Today at 17:00 (GMT+2): US Core Personal Consumption Expenditures (PCE) Price Index
EUR/USD
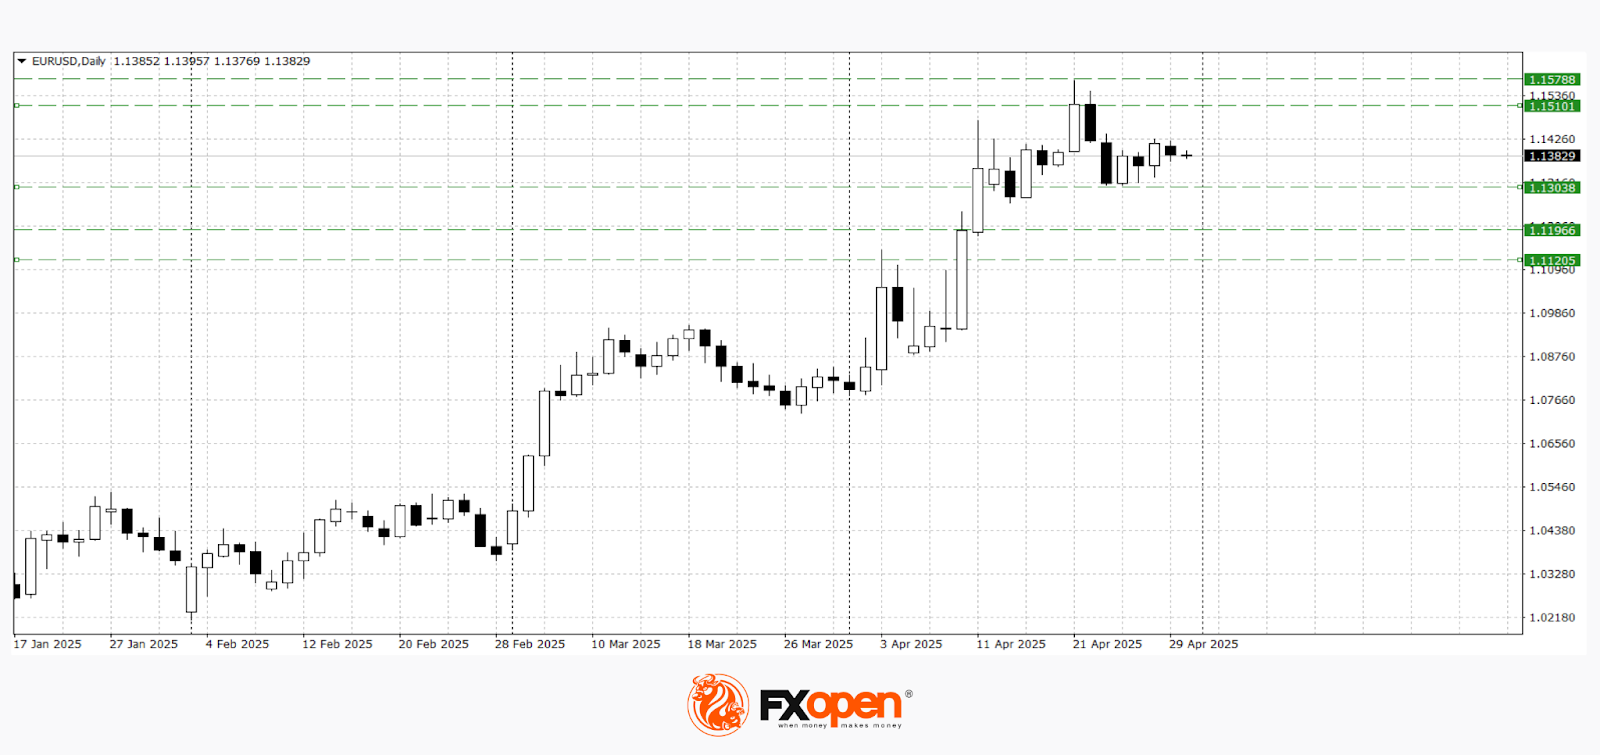
Following a sharp rally in early April, EUR/USD has entered a sideways range between 1.1500 and 1.1300. Technical analysis suggests a possible move towards the lower boundary of this range. A break below 1.1300 could trigger a deeper bearish correction toward the 1.1109–1.1120 area. On the other hand, a bounce from current levels may encourage a renewed test of the 1.1500–1.1580 zone.
Key economic data that could affect EUR/USD in upcoming sessions include:
- Today at 12:00 (GMT+2): Eurozone GDP
- Today at 13:00 (GMT+2): Italy Producer Price Index (PPI)
- Today at 14:00 (GMT+2): Spain Business Confidence Index
- Today at 15:00 (GMT+2): Germany Consumer Price Index (CPI)
Trade over 50 forex markets 24 hours a day with FXOpen. Take advantage of low commissions, deep liquidity, and spreads from 0.0 pips. Open your FXOpen account now or learn more about trading forex with FXOpen.
This article represents the opinion of the Companies operating under the FXOpen brand only. It is not to be construed as an offer, solicitation, or recommendation with respect to products and services provided by the Companies operating under the FXOpen brand, nor is it to be considered financial advice.
Oil Prices: April Could Be the Worst Month in Three and a Half Years
As the XBR/USD chart shows:
→ at the beginning of April, Brent crude was trading above $71 per barrel;
→ this morning, on the last day of the month, the price has fallen below $60.
The overall decline may reach 16% — the worst monthly performance since November 2021.
Why Is Oil Falling?
The primary driver behind the sharp drop in oil prices earlier this month was the introduction of new US tariffs, particularly targeting China and the EU. This raised concerns that a potential global trade war could slow economic growth and, in turn, reduce global oil demand.
According to a Reuters poll, the tariffs imposed by Trump have made a global recession in 2025 a realistic risk.
In addition, growing attention is being paid to OPEC+ and its plans to increase oil production. The next meeting is scheduled for 5 May.
Technical Analysis of the XBR/USD Chart
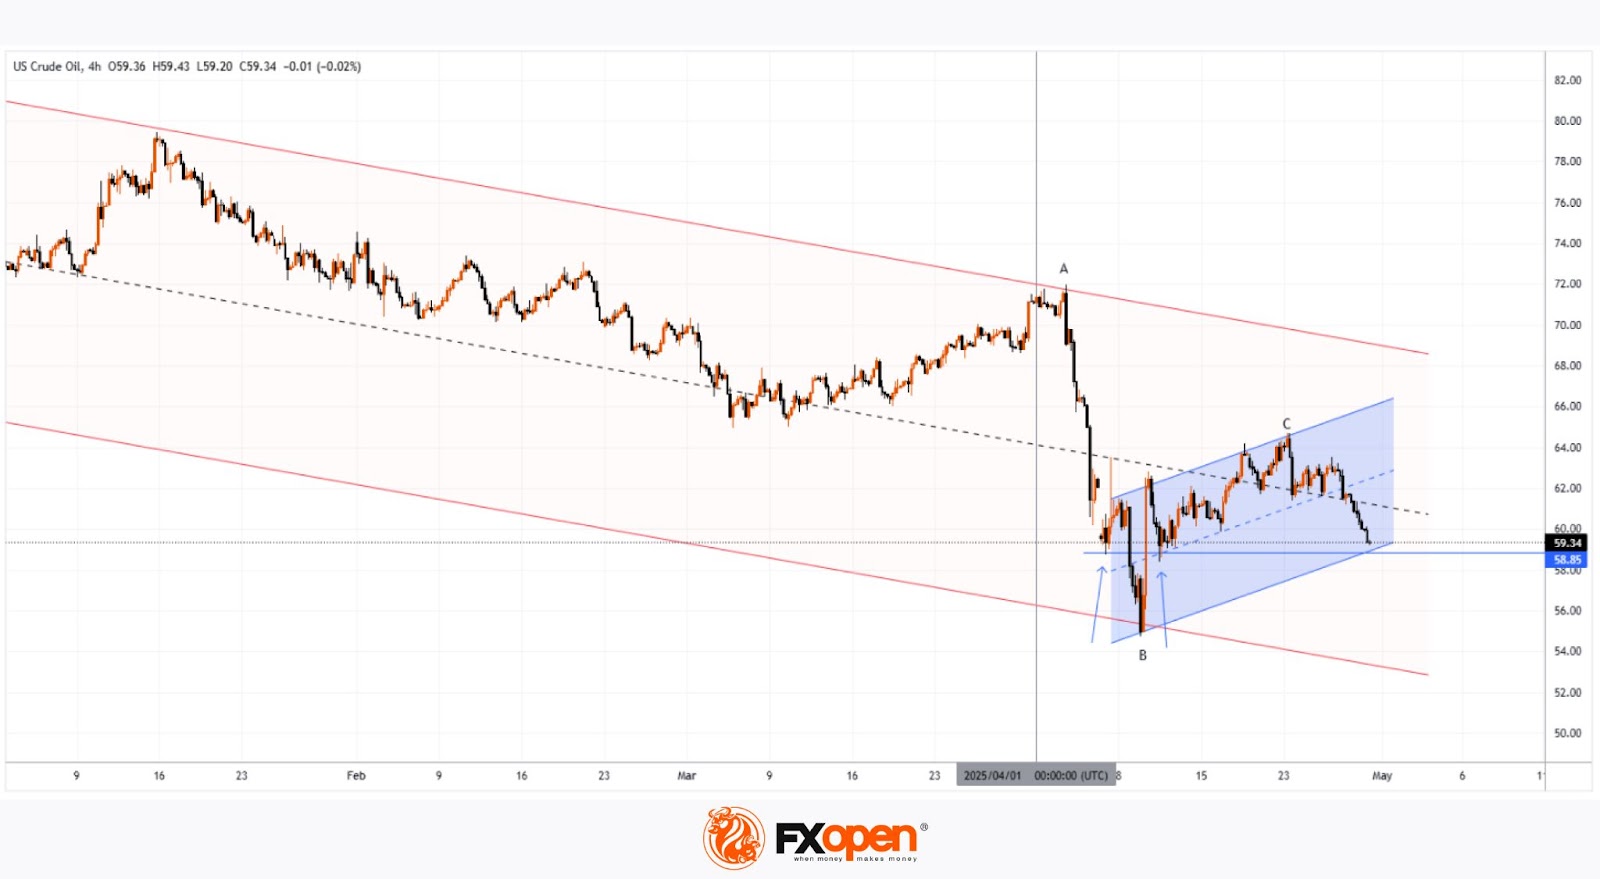
Oil price fluctuations in 2025 have formed a descending channel (highlighted in red), with lower highs and lower lows reflecting continued bearish sentiment.
Bulls may hope for support to emerge around the $58.85 level, as:
→ this has acted as support before (as indicated by arrows);
→ this level aligns with the lower boundary of a local upward trend (shown in blue), which formed after news broke that Trump had postponed the implementation of some tariffs — triggering a sharp rebound in oil prices from the 9 April low.
Nevertheless, the broader structure remains bearish: the rise towards point C appears to be a corrective recovery following the impulse drop from A to B. Given the potential impact of upcoming news — including statements from the White House and OPEC+ decisions — a bearish breakout below the blue channel cannot be ruled out.
Start trading commodity CFDs with tight spreads. Open your trading account now or learn more about trading commodity CFDs with FXOpen.
This article represents the opinion of the Companies operating under the FXOpen brand only. It is not to be construed as an offer, solicitation, or recommendation with respect to products and services provided by the Companies operating under the FXOpen brand, nor is it to be considered financial advice.
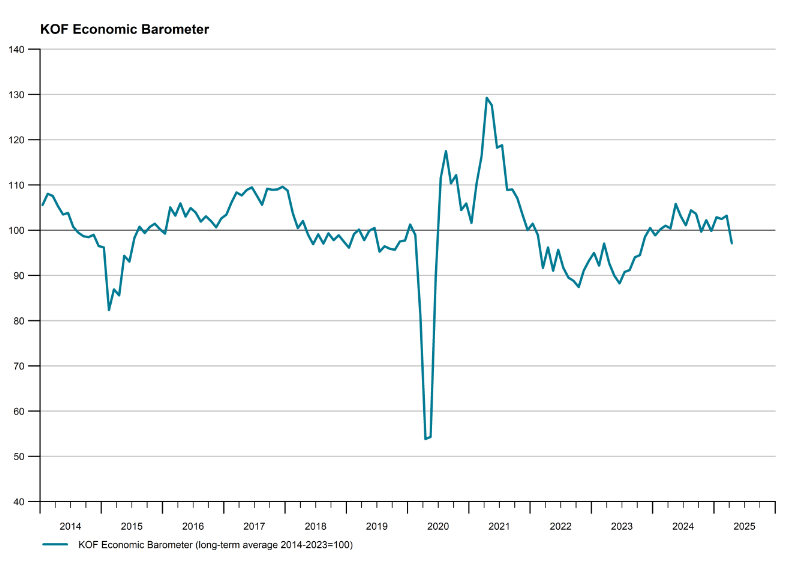
Swiss KOF falls to 97.1, outlook considerably subdued
The Swiss KOF Economic Barometer slumped to 97.1 in April, down sharply from 103.9 and well below the expected 102.0, marking its first drop below the medium-term average this year.
The KOF Swiss Economic Institute noted that the outlook for the Swiss economy is now “considerably subdued,” as broad-based weakness weighed on the indicator.
According to KOF, the sharp deterioration was primarily driven by a significant setback in manufacturing sentiment, with additional pressure seen across the hospitality and broader services sectors. Financial and insurance services were the only areas showing relative stability.
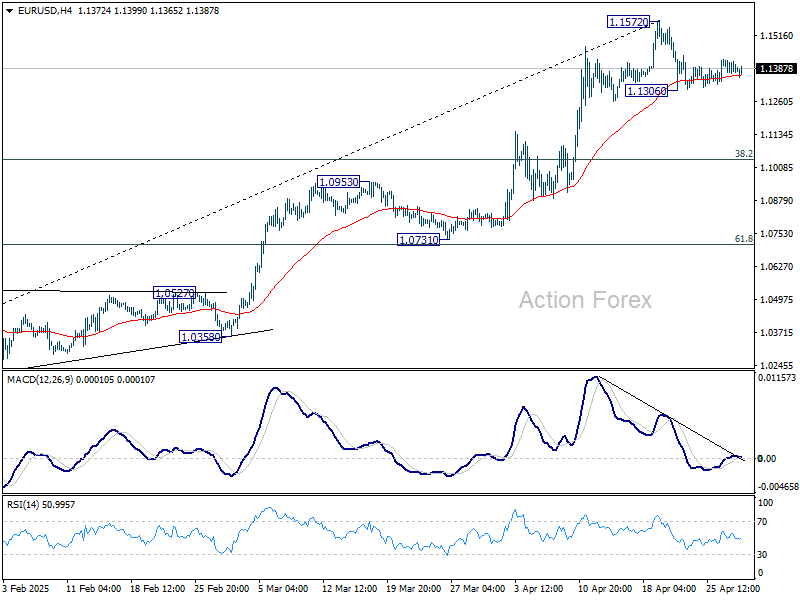
EUR/USD Daily Outlook
Daily Pivots: (S1) 1.1362; (P) 1.1394; (R1) 1.1418; More...
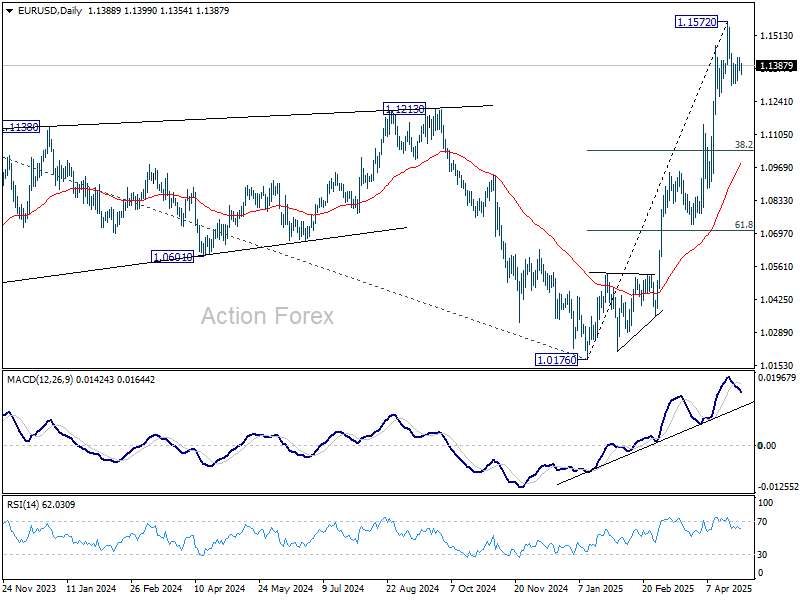
Intraday bias in EUR/USD remains neutral at this point. On the downside, break of 1.1306 will extend the correction from 1.1572. But strong support should be seen from 38.2% retracement of 1.0176 to 1.1572 at 1.1039 to contain downside. On the upside, break of 1.1572 will resume larger up trend.
In the bigger picture, rise from 0.9534 long term bottom could be correcting the multi-decade downtrend or the start of a long term up trend. In either case, further rise should be seen to 100% projection of 0.9534 to 1.1274 from 1.0176 at 1.1916. This will now remain the favored case as long as 55 W EMA (now at 1.0792) holds.
GBP/USD Daily Outlook
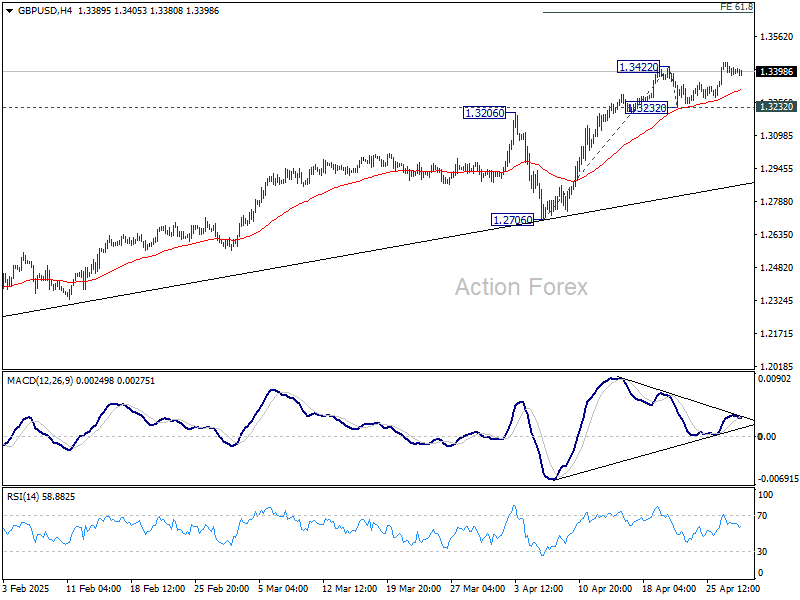
Daily Pivots: (S1) 1.3377; (P) 1.3411; (R1) 1.3440; More...
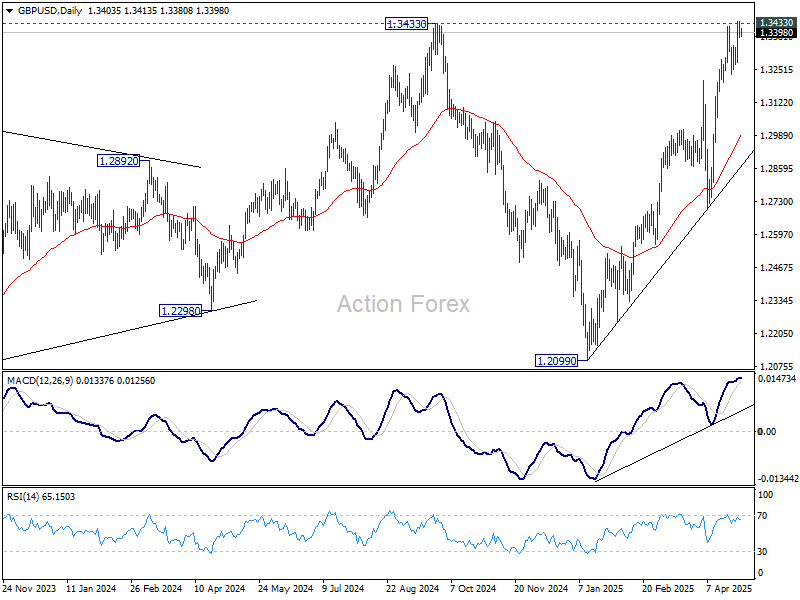
Intraday bias in GBP/USD stays on the upside at this point. Firm break of 1.3433 key resistance will confirm larger up trend resumption. Next near term target is 61.8% projection of 1.2706 to 1.3422 from 1.3232 at 1.3674. However, break of 1.3232 support will indicate rejection from 1.3433, and bring deeper decline back to 55 D EMA (now at 1.2993) and possibly below.
In the bigger picture, price actions from 1.3433 are seen as a corrective pattern to the up trend from 1.3051 (2022 low). Rise from 1.2099 could either be resuming the up trend, or the second leg of a consolidation pattern. Overall, GBP/USD should target 1.4248 key resistance (2021 high) on break of 1.3433 at a later stage.
USD/CHF Daily Outlook
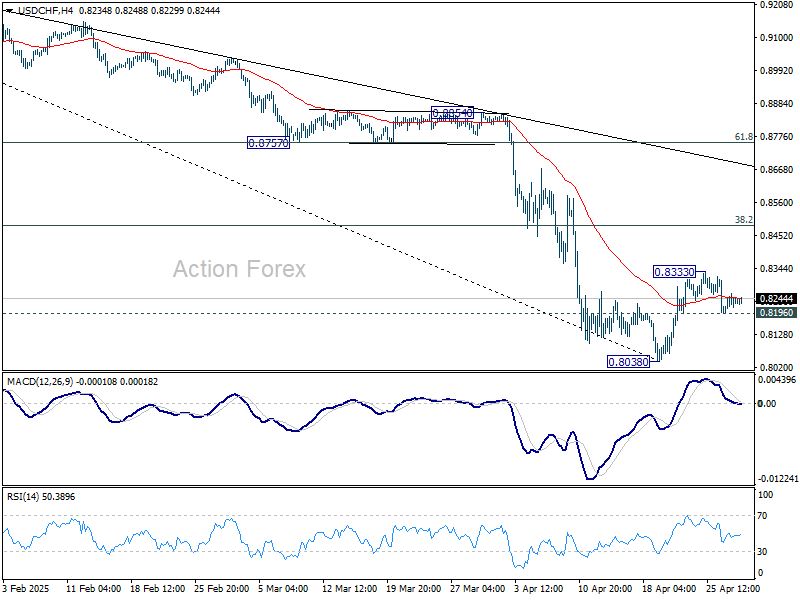
Daily Pivots: (S1) 0.8201; (P) 0.8232; (R1) 0.8271; More….
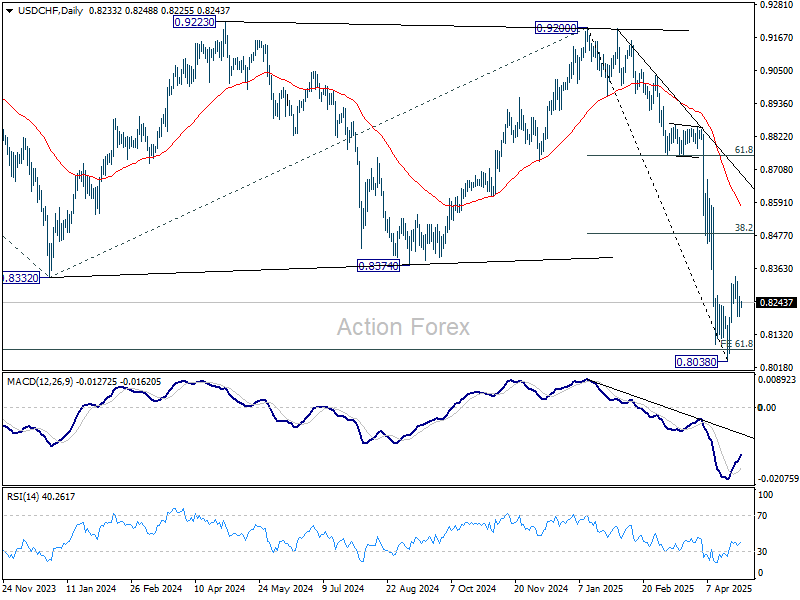
Intraday bias in USD/CHF remains neutral for the moment. On the upside, above 0.8333 will resume the rebound from 0.8038 short term bottom. But upside should be limited by 38.2% retracement of 0.9200 to 0.8038 at 0.8482. On the downside, below 0.8196 minor support will bring retest of 0.8038. Firm break there will resume larger down trend.
In the bigger picture, long term down trend from 1.0342 (2017 high) is still in progress and met 61.8% projection of 1.0146 (2022 high) to 0.8332 from 0.9200 at 0.8079 already. In any case, outlook will stay bearish as long as 55 W EMA (now at 0.8783) holds. Sustained break of 0.8079 will target 100% projection at 0.7382.
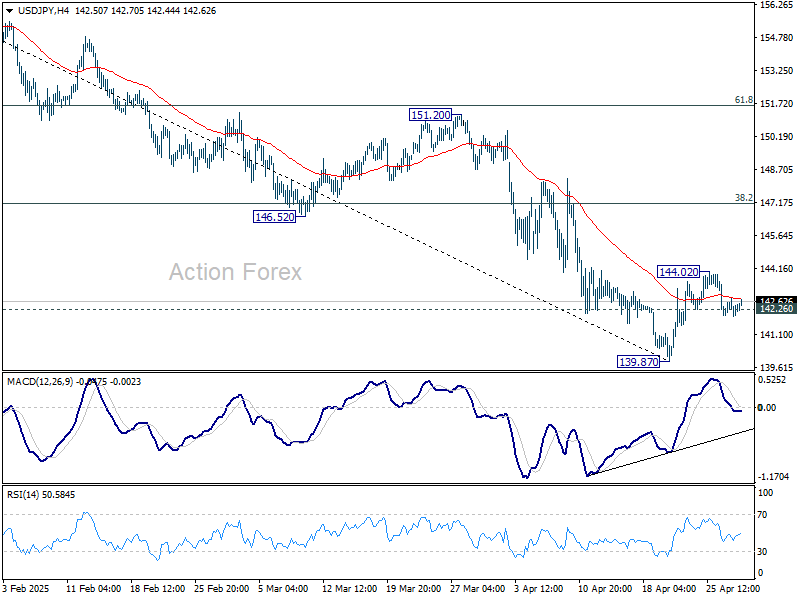
USD/JPY Daily Outlook
Daily Pivots: (S1) 141.92; (P) 142.34; (R1) 142.77; More...
Intraday bias in USD/JPY remains neutral for the moment. On the upside, above 144.02 will resume the rebound from 139.87. But ear term outlook will stay bearish as long as 38.2% retracement of 158.86 to 139.87 at 147.12 holds. On the downside, firm break of 142.26 will argue that the recovery from 139.87 short term bottom has completed as a corrective move. Retest of 139.87 should then be seen next in this case.
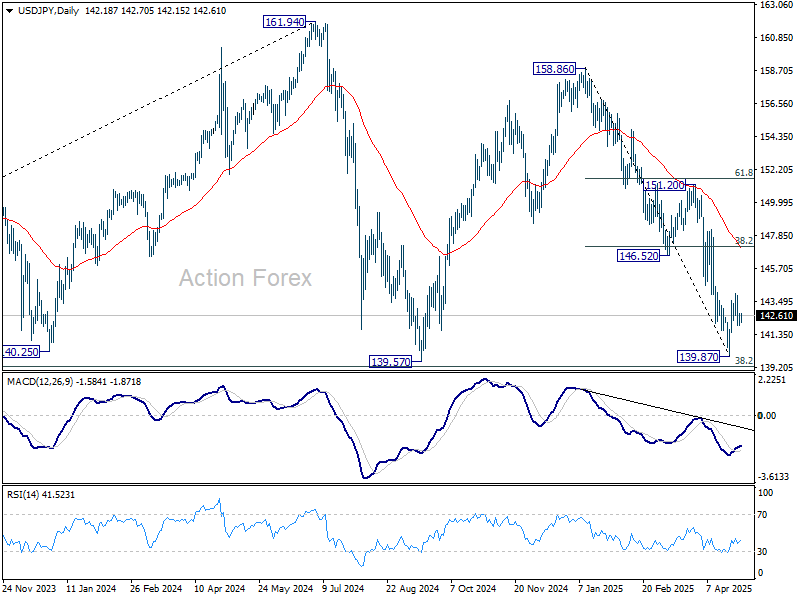
In the bigger picture, price actions from 161.94 are seen as a corrective pattern to rise from 102.58 (2021 low), with fall from 158.86 as the third leg. Strong support should be seen from 38.2% retracement of 102.58 to 161.94 at 139.26 to bring rebound. However, sustained break of 139.26 would open up deeper medium term decline to 61.8% retracement at 125.25.
AUD/USD Daily Report
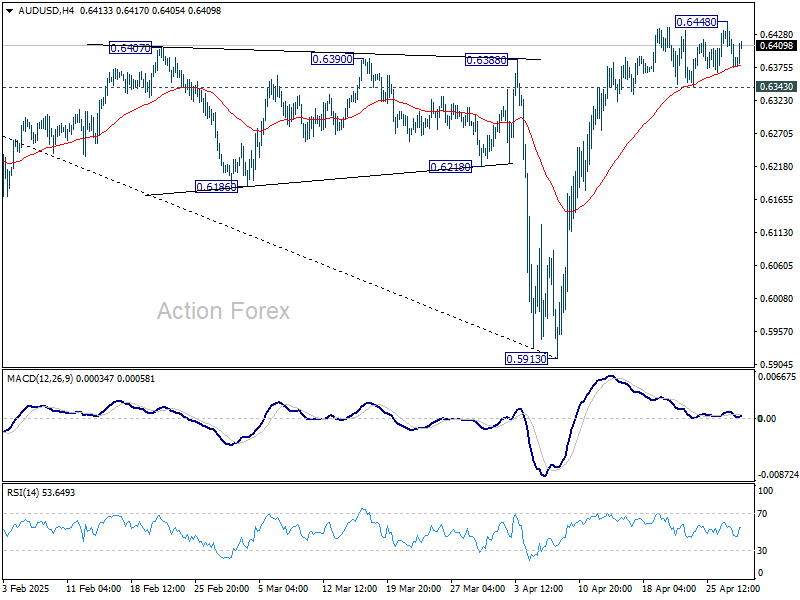
Daily Pivots: (S1) 0.6357; (P) 0.6403; (R1) 0.6431; More...
Intraday bias in AUD/USD is turned neutral first. On the upside, above 0.6448 will resume the rebound from 0.5913 to 61.8% retracement of 0.6941 to 0.5913 at 0.6548. However, firm break of 0.6343 support will confirm short term topping, and turn bias back to the downside for 55 D EMA (now at 0.6312) and below.
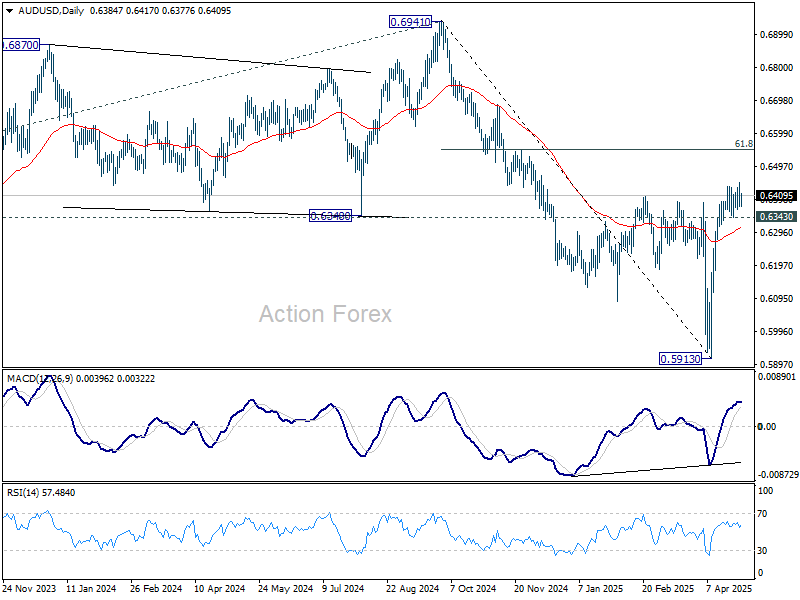
In the bigger picture, as long as 55 W EMA (now at 0.6440) holds, the down trend from 0.8006 (2021 high) should resume later to 61.8% projection of 0.8006 to 0.6169 from 0.6941 at 0.5806. However, sustained trading above 55 W EMA will argue that a medium term bottom was already formed, and set up further rebound to 0.6941 resistance instead.
USD/CAD Daily Outlook
Daily Pivots: (S1) 1.3805; (P) 1.3838; (R1) 1.3868; More...
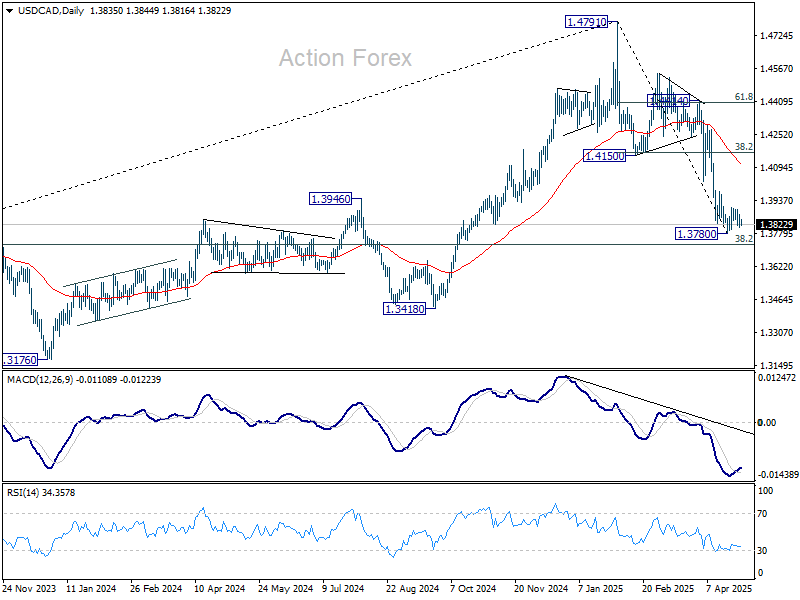
Intraday bias in USD/CAD remains neutral for the moment. On the upside, break of 1.3903 minor resistance will extend the rebound from 1.3780. But upside should be limited by 1.4150 support turned resistance (38.2% retracement of 1.4791 to 1.3780 at 1.4166). On the downside, firm break of 1.3780 short term bottom will resume the whole fall from 1.4791.
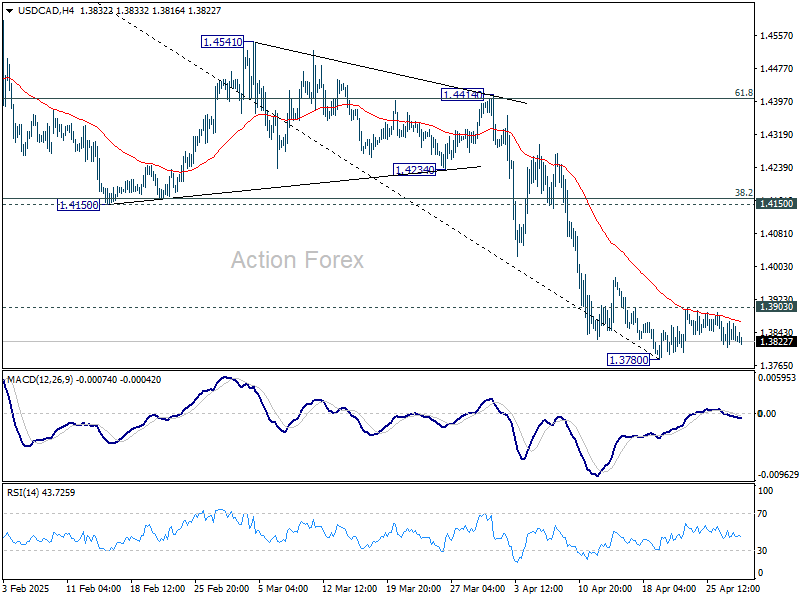
In the bigger picture, price actions from 1.4791 medium term top could either be a correction to rise from 1.2005 (2021 low), or trend reversal. In either case, further decline is expected as long as 1.4150 resistance turned support holds. firm break of 38.2% retracement of 1.2005 (2021 low) to 1.4791 at 1.3727 will pave the way back to 61.8% retracement at 1.3069.