
Sample Category Title
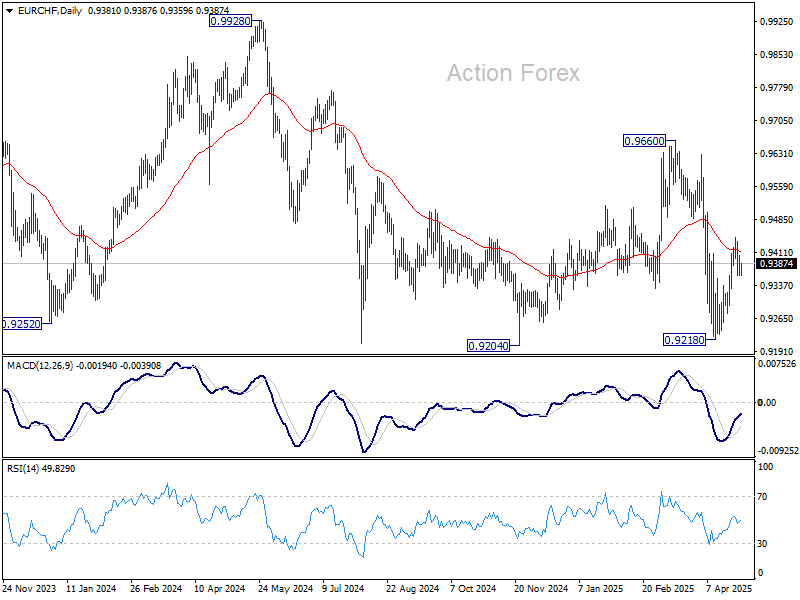
EUR/CHF Daily Outlook
Daily Pivots: (S1) 0.9359; (P) 0.9384; (R1) 0.9405; More....
Intraday bias in EUR/CHF stays neutral at this point. Rebound from 0.9218 is either a corrective move, or the third leg of the pattern from 0.9204. Break of 0.9445 will resume the rebound towards 0.9660 resistance. However, on the downside, break of 0.9336 will bring retest of 0.9204/18 support zone.
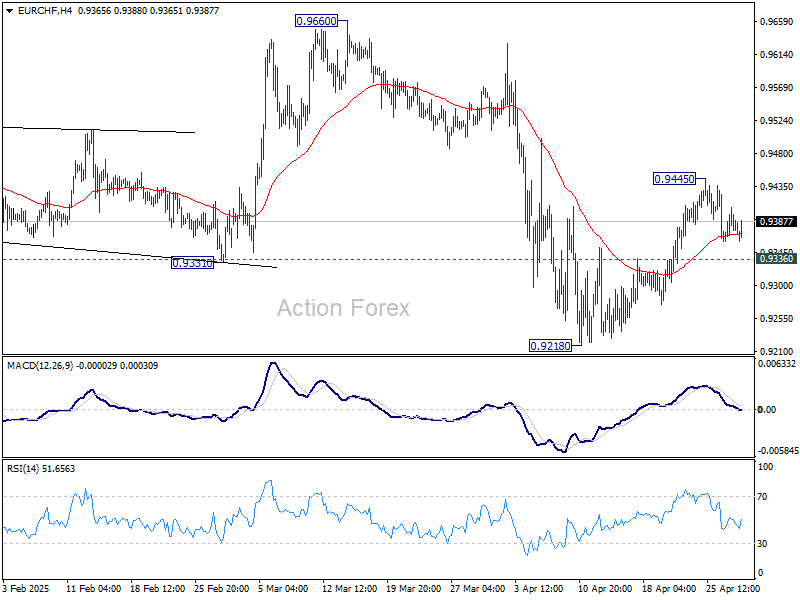
In the bigger picture, prior rejection by long-term falling channel resistance (now at 0.9555) retains medium term bearishness. That is, down trend from 1.2004 (2018 high) is still in progress. Firm break of 0.9204 (2024 low) will confirm resumption. This will remain the favored case as long as 0.9660 resistance holds.
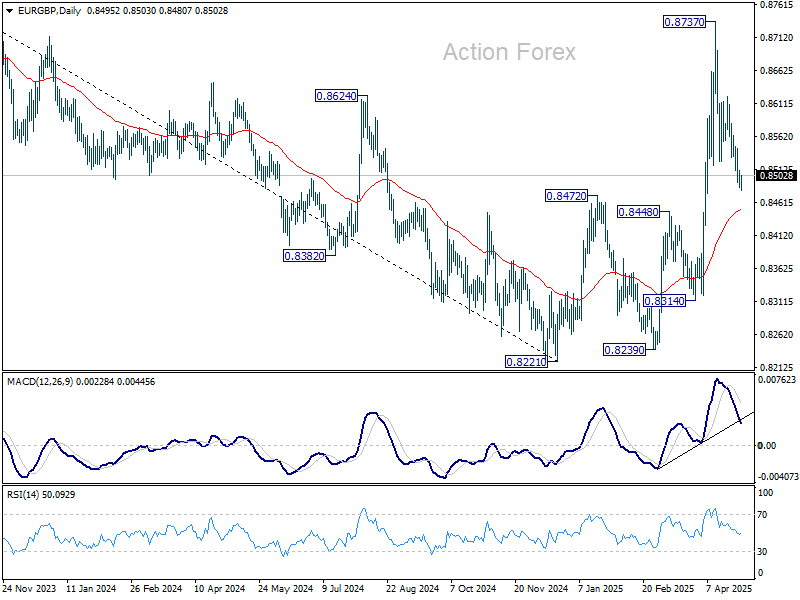
EUR/GBP Daily Outlook
Daily Pivots: (S1) 0.8482; (P) 0.8497; (R1) 0.8509; More...
Intraday bias in EUR/GBP remains on the downside for the moment. Fall from 0.8737 is in progress for 55 D EMA (now at 0.8450). Sustained break there will argue that whole rebound from 0.8221 has completed and turn near term outlook bearish. On the upside, though, break of 0.8622 resistance will bring retest of 0.8737.
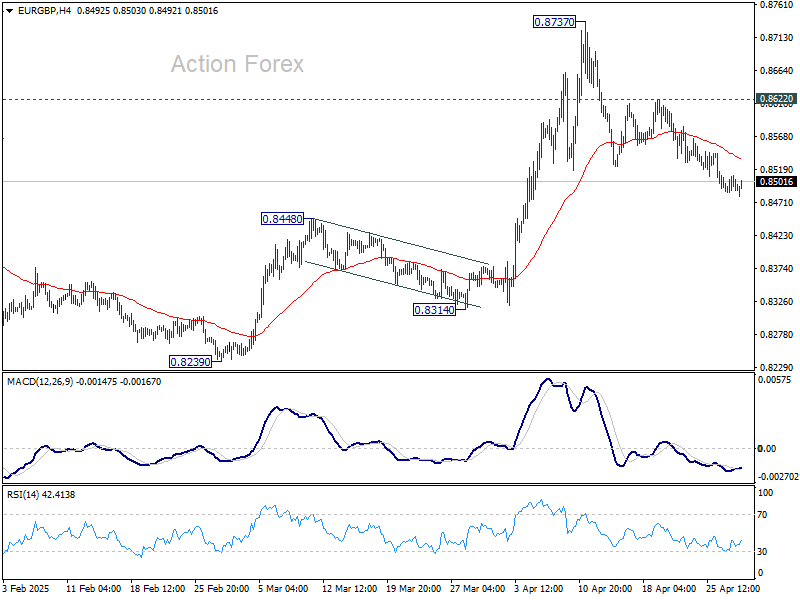
In the bigger picture, down trend from 0.9267 (2022 high) should have completed at 0.8221, just ahead of 0.9201 key support (2024 low). Rise from 0.8221 is likely reversing the whole fall. Further rise should be seen to 61.8% retracement of 0.9267 to 0.8221 at 0.8867 next. This will remain the favored case as long as 0.8472 resistance turned support holds.
EUR/AUD Daily Outlook
Daily Pivots: (S1) 1.7729; (P) 1.7809; (R1) 1.7915; More...
Intraday bias in EUR/AUD stays neutral and outlook is unchanged. Corrective pattern from 1.8554 could extend, but downside should be contained by 38.2% retracement of 1.5963 to 1.8854 at 1.7750. On the upside, above 1.8014 minor resistance will bring retest of 1.8554 first. Firm break there will resume larger up trend. However, firm break of 1.7750 will bring deeper fall to 55 D EMA (now at 1.7399) and possibly below.
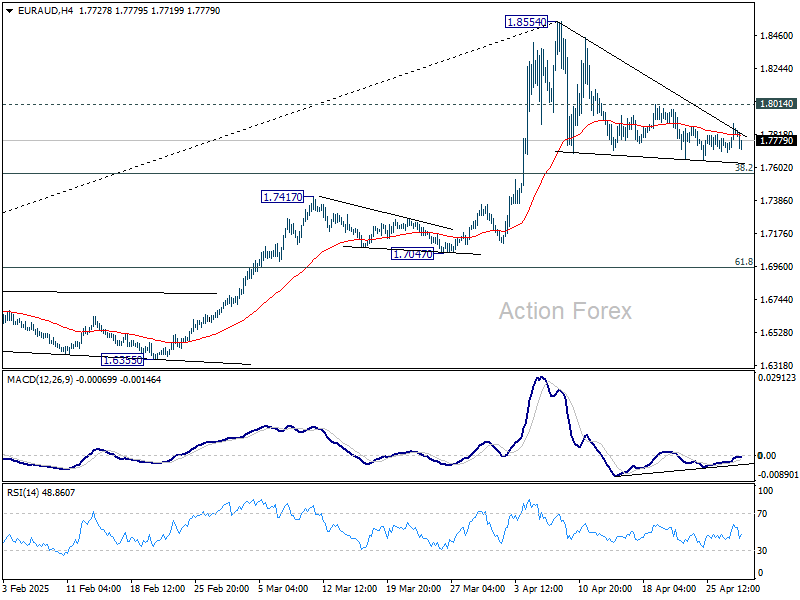
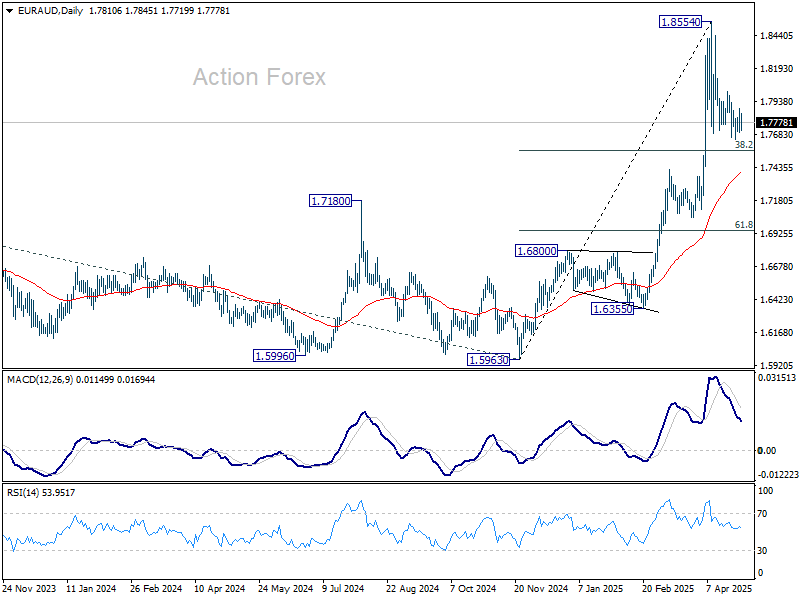
In the bigger picture, up trend from 1.4281 (2022 low) is in progress for 100% projection of 1.4281 to 1.7062 from 1.5963 at 1.8744. Firm break there will pave the way to 138.2% projection at 1.9806, which is close to 1.9799 (2020 high). Outlook will remain bullish as long as 1.7062 resistance turned support (2023 high) holds even in case of deep pullback.
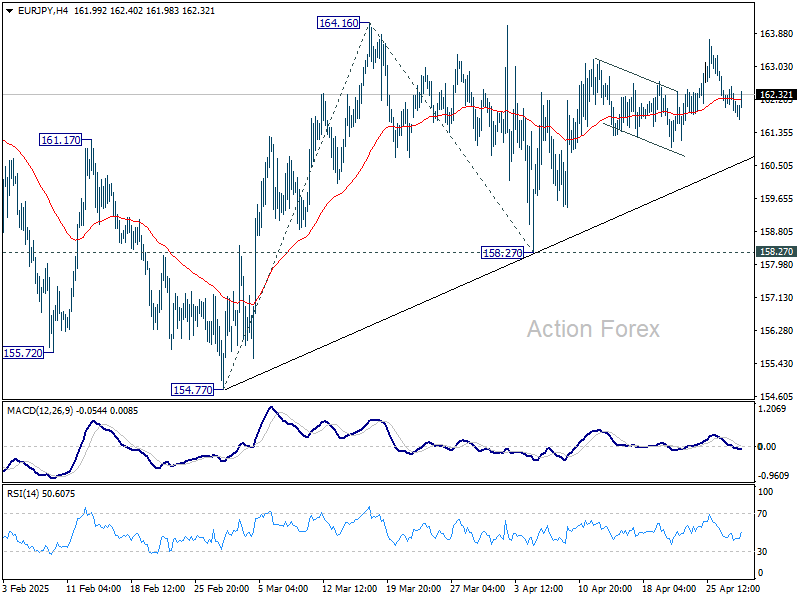
EUR/JPY Daily Outlook
Daily Pivots: (S1) 161.76; (P) 162.16; (R1) 162.43; More...
No change in EUR/JPY's outlook and intraday bias stays neutral. On the upside, firm break of 164.16 will resume whole rise from 154.77. Next target will be 100% projection of 154.77 to 164.16 from 158.27 at 167.66. However, break of 158.27 will bring deeper fall back to 154.40/77 support zone.
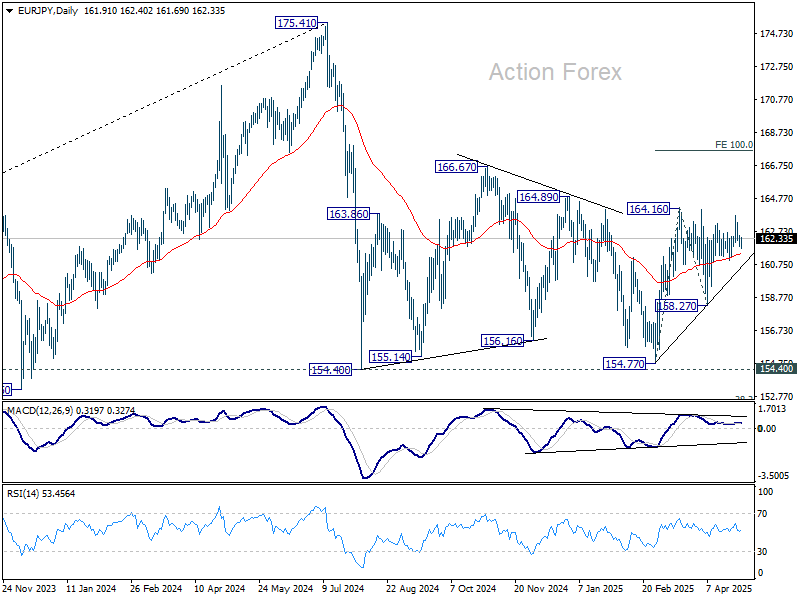
In the bigger picture, price actions from 175.41 are seen as correction to rally from 114.42 (2020 low). Strong support should be seen from 38.2% retracement of 114.42 to 175.41 at 152.11 to contain downside. However, sustained break of 152.11 will bring deeper fall even still as a correction.
Economic Calendar Today Goes Straight into Highest Gear
Markets
The US released a first batch of economic data yesterday. Both JOLTS (7.19mn March vs 7.48mn in February) and Conference Board consumer confidence (April) fell short of expectations. The latter saw a particular deterioration in the forward looking component, which tumbled to the lowest since 2011. Given the survey’s skew to the employment and income situation, the numbers are essentially a partial update of the labour market ahead of Friday’s payrolls. It explains the market reaction, consisting of a 3.4-4.7 bps yield drop across the US curve, wiping out earlier gains. There was a slight outperformance at the front as markets raised Fed easing bets to just shy of 100 bps for the year. President Trump would approve. He lashed out at Fed chair Powell again during an event to mark his 100th day in office. He also touted his tariff policy, saying it would bring growth and manufacturing back to the US. Net daily changes for Bund yields varied between -0.6 bps (2-yr) to -2.4 bps (10-yr). The dollar held a minor advantage in technically insignificant trading. EUR/USD oscillated around 1.14, the trade-weighted dollar index held north of 99. Sterling’s attack at the EUR/GBP 0.85 level is unrelenting but could soon face tough resistance around the 0.8474 area in case of a break. The economic calendar today goes straight into highest gear with GDP numbers in France this morning (printed in line with expectations), Germany and the euro area (expected at 0.2% q/q, 1.1% y/y). Those member states also release April inflation numbers. The ADP job report is due in the US and could show employment growth easing from 155k to 115k. Q1 GDP growth is also on tap. Heavy import frontloading ahead of the April 2 tariff announcement weighs on the expected headline print (-0.2% q/q annualized). We are therefore focused at the contribution coming from consumer and capital spending. US price deflators published simultaneously should confirm the Fed’s limited scope to cut rates in the near term – as long as the labour market remains resilient. A unidirectional market reaction against the backdrop of such a wide data range is not obvious. We’re instead looking for some bottoming out and consolidation in core bond yields, especially in Europe where we think markets went ahead of themselves. EUR/USD & DXY are locked in a stalemate in the 1.14 & 98-100 area.
News & Views
Australian Q1 inflation was a bit mixed but didn’t change market expectations for the Reserve Bank of Australia to continue with a second 25 bps rate cut at the May 19-20 meeting. Headline inflation printed 0.9% Q/Q (from 0.2% Q/Q). Y/Y measures unexpectedly stayed unchanged at 2.4%. The trimmed mean measure rose sightly more than expected from 0.5% Q/Q to 0.7% Q/Q. Even so, the Y/Y figure slowed from 3.3% to 2.9%, the lowest since 2021Q4. It also bring this inflation measure back within the 2-3% RBA inflation target range. Annual services inflation was 3.7% in the March quarter, down from 4.3% in the December quarter and the slowest since the June 2022 quarter. The Aussie dollar this morning rises modestly to AUD/USD 0.6415, but stays in consolidation modus after recent rebound against a broadly weaker dollar.
The central bank of Hungary (MNB) as expected yesterday left its policy rate unchanged at 6.50%. A careful and patient approach to monetary policy remains necessary due to risks to the inflation environment as well as trade policy and geopolitical tensions, it said. For now maintaining tight monetary conditions is warranted. The MNB expects inflation to cool further in April after a decline to 4.7% in March. From there it is expected to remain near the upper bound of the central bank tolerance band in the coming months. Profit margin caps introduced by the authorities are expected to moderate inflation, as will lower energy prices. However, upside risks to inflation could intensify in the event of increases in tariff rates. Rising uncertainty in international financial markets also increases risk aversion towards Hungarian assets, which also poses a risk of higher inflation. Despite current MNB cautious wait-and-see attitude markets still expect the MNB to cut interest rate further in 2025H2. The forint hardly reacted and maintained recent gains (EUR/HUF 404.35).
Soft Data, Dim Forecasts Put Fragile Optimism to the Test
Market sentiment somehow improved on news that Donald Trump would ease auto tariffs by lifting some levies on imported auto parts, and to avoid aluminium and steel levies stacking up alongside the rest of the tariffs—probably as a marketing move as he gave a speech in Michigan marking his 100 days in office. As a result, carmakers around the world and major US indices posted gains yesterday.
Part of the gains was also due to hope that US corporate earnings would be resilient to tariff uncertainty, that Scott Bessent is eyeing July 4th to pass a multi-trillion-dollar tax cut package to help improve the new administration’s plunging approval ratings, and that the Federal Reserve (Fed) would step in if things worsened. But the majority of the news was less than ideal—to say the least. So let me cite a few that caught my attention.
First, GM lowered its earnings guidance for the year citing tariff uncertainty, suspended a $4bn share buyback plan, and postponed its earnings call as it needed more clarity on tariffs before making additional statements. The tariff relief for carmakers helped GM recover most early losses, but the stock remained capped at its 50-DMA and the top of its November-to-date bearish trend channel.
Kraft Heinz cut its annual sales and profit outlook due to weakening consumer sentiment and the prospect of higher costs. Chipmaker NXP tanked nearly 7% after warning of a ‘very uncertain environment.’ UPS announced it will cut 20,000 jobs and close dozens of facilities. S&P Global lowered its revenue forecast, expecting that companies will delay debt sales due to highly uncertain market conditions.
Apple said it would produce iPhones in the US—good luck with that. Adidas said it would reflect tariff-led price increases in US prices. Amazon first suggested it could show the additional cost of tariffs on bills—like Chinese retailers do—but walked back the decision after facing the White House’s rage, which called the move ‘political’. Hilton lowered its earnings forecast, PayPal didn’t improve its forecast despite a stronger-than-expected quarter, while Spotify offered a muted outlook.
Then, Super Micro Computer posted softer-than-expected quarterly results after the bell, Snap flagged lower sales, and Starbucks' sales fell slightly faster than expected.
US futures are in the negative this morning.
The rest of the week will be crucial for Big Tech. Microsoft, Meta, and Qualcomm are due to release earnings today after the bell; Apple and Amazon report tomorrow. There are reports—pre-earnings—that Microsoft and Amazon could scale back spending plans due to an overestimation of AI demand that may have resulted in oversupply. Spending plans will be just as important as quarterly results. Hints of lower AI spending from the four biggest spenders globally (expected to spend over $300bn this year) could send markets back into bearish territory, while reiterating spending commitments could convince some investors to buy the dip—not knowing, however, how big a hit US Big Tech could take from the trade war, as Europe is now directly targeting these firms in retaliation against Trump’s tariff attacks.
Anyway, on the data front, the news isn’t brilliant either. US job openings fell in March, and the Atlanta Fed’s GDPNow forecast was revised down further to 2.7%—suggesting that the US economy may have contracted by 2.7% in Q1. The first official US GDP estimate is due today, with a Bloomberg consensus pointing to 0.4% growth—so expect some disappointment. But disappointment doesn’t mean a risk-off move. Since a sharp contraction has likely already been priced in, a weak number could lead to dip-buying on rising dovish Fed expectations.
Besides that, US ADP data and CPI updates from Eurozone countries will be in focus.
In FX, the US dollar is slightly better bid this week on signs that Trump is pulling back tariffs, but risks remain tilted to the downside. The EURUSD saw strong resistance into the 1.1420 level after data yesterday hinted at softer sentiment across the Eurozone: lower-than-expected GDP growth coupled with a higher-than-expected CPI print from Spain. Today, French and German numbers will be in focus. The euro needs strong growth and soft inflation to break the 1.15 resistance against the US dollar.
European equities, meanwhile, are enjoying a rare calm amid Trump’s attacks. The Stoxx 600 extended gains above the 200-DMA for a second straight session, yet trade negotiations with the US aren’t going in the right direction—which could limit enthusiasm as the index approaches a critical Fibonacci resistance.
Over in China, the CSI 300 remains particularly flat amid conflicting PMI numbers—official data suggests contraction, while the Caixin print hints at slight expansion in manufacturing activity. That, coupled with worsening global trade sentiment and a 3.76 million barrel rise in US weekly oil inventories, sent US crude below $60pb this morning. The outlook for oil and industrial metals remains negative given the gloomy global growth outlook.
In Australia, the latest CPI print came in stronger than expected, giving some support to AUDUSD. But the Aussie still needs reassurance that China is doing fine to clear its 200-DMA resistance.
Closer to home, UK food prices posted their biggest jump since January last year due to tax increases and a sharp rise in the national minimum wage, which hit supermarkets particularly hard. The 6.7% minimum wage hike fuelled UK inflation expectations and tamed dovish Bank of England (BoE) bets.
On the inflation spectrum, the euro appears to be in the best place—with potential disinflationary impact from a stronger euro and weaker energy prices. The UK sits in the middle, with an uncertain inflation and growth outlook as tax and wage hikes could offset disinflation from stronger sterling and softer energy. The US is in the worst place among the three, with sharply deteriorating growth and rising inflation expectations.
As such, the euro has the most positive outlook, followed by sterling, and lastly the US dollar.
Tier One Data Releases and US Consumer Confidence Continue Spiralling Down
In focus today
In the US, the preliminary Q1 GDP is due for release this afternoon. Front-loading of imports ahead of the trade war pushed growth contribution from net exports deeply into negative territory, and we think GDP contracted by 0.1% q/q AR. Underlying private consumption growth likely remained steady ahead of the sharpest 'Liberation Day' tariff hikes. March PCE data and the Q1 Employment Cost Index will also be released at the same time but might gather less attention than usual given the focus on more timely data. Finally, ADP's private sector employment report will provide markets with the first sense of what to expect from the Friday's April Jobs Report.
In the euro area, we follow inflation data from France, Germany, and Italy. It will be interesting after Spanish inflation yesterday surprised on the upside, both in headline and core inflation.
Also in the euro area, we receive the first estimate of GDP growth in Q1 2025, which we expect to show that real GDP rose 0.3% q/q. Growth likely picked up in the first quarter of the year as indicated by PMIs averaging 50.4 compared to 49.3 in Q4 2024 and industrial production rising. We expect growth to once again be especially driven by Spain, while Germany should also show positive growth in Q1.
Economic and market news
What happened overnight
In China, we received manufacturing PMIs from Caixin (private version) and NBS. Caixin fell to 50.4 (prior 51.2), marking the weakest growth since January. However, a figure above 50 still marks the seventh consecutive month of expansion, suggesting that Beijing's stimulus measures are supporting economic recovery. NBS fell below expectations, coming in at 49.0 (cons: 49.8, prior: 50.5). Both output and new orders declined, but the fall was mostly driven by foreign orders shrinking the most in 11 months.
Though China claims it has positioned itself to be more resistant to the negative implications of the trade war, the setback in the PMIs illustrate well that tariffs of this magnitude is a loser's game. As pain grow on each side, we find it likely that the US soon approaches China and aim for a short-term deal agreeing to lower tariffs from the current high levels.
What happened yesterday
In the US, JOLTs Job openings declined more than expected (7.2m vs. cons: 7.5m) in March, so before the Liberation Day. Other details from the JOLTs report were not as concerning. Hiring picked up in March, and the number of involuntary layoffs declined. Overall, it seems labour market conditions remained relatively steady.
In line with expectations, the Conference Board's consumer confidence measure ticked lower for the fifth consecutive month. The decline was driven especially by the expectations component, while current situation assessment remained steadier. Most sub-components weakened as well, as more consumers thought jobs were "hard to get" and plans for big-ticket purchases (vacations, cars, homes etc) slowed down. Inflation expectations, unsurprisingly, ticked higher as well. We pay close attention to the 'hard' data that we'll get over the coming days/weeks, as consumer confidence surveys have not had the best correlation to actual spending during the recent uncertainty.
In the euro area, credit growth continued its steady increase in March. The annual growth rate of loans to households increased to 1.7% y/y in March (prior 1.5%), while loans to non-financial corporations increased to 2.3% y/y (prior 2.1%). Rising credit growth following lower interest rates is supporting growth especially in the industry. Yet, the growth rate remains quite low in a sign that we should not expect activity to rise sharply but only gradually. The credit impulse, which measures the 6-month momentum in credit growth, and is often better correlated with GDP compared to the annual growth rate of credit, also supports the latter view.
Also in the euro area, the preliminary inflation data from Spain showed stronger than expected inflation in April. Headline inflation fell to 2.2% y/y (cons: 2.0% y/y) in April from 2.3% y/y in March. The move was driven mainly by energy prices that have declined over the month, after rising in the same month last year. Euro area HICP inflation is expected to tick down to 2.1% y/y from 2.2% y/y and we see upside risks to that forecast now with Spain coming in higher than expected.
In Sweden, the GDP indicator for Q1 landed on the weak side of expectations (0.0% q/q, 1.1% y/y). Note though that the GDP indicator is historically unreliable and tends to not only be volatile but also underestimating actual GDP data. Retail sales for March showed a healthy +0.3% m/m increase (+3.6% y/y), which must be viewed as positive given that consumer confidence dropped from 94.6 to 89.8 during the same month.
Continuing in Sweden, the NIER Survey showed a roughly unchanged overall tendency indicator (94.8 vs 95.2 in March) but in the underlying numbers we note a clear drop in consumer confidence, which dropped sharply to 88.8 from 81.6. Manufacturing confidence rose from 96.4 to 99.6. Furthermore, the survey showed a large increase in inflation expectations among companies, up from 1.7% to 2.7%. Overall, we would view ETI as "normal", but the inflation expectations and price plans are hawkish for the Riksbank and makes it hard to motivate a near-term cut.
In Norway, retail sales increased +0.6 % m/m in March (consensus: 0.3%, DB: 0.1%), taking the 3M/3m growth to 1.5% in Q1. Hence, the upward trend witnessed since last autumn continues, driven by higher real wage growth and fading headwinds from higher mortgage rates and saving ratios. The solid lift in retail sales could question the need for rate cuts, but keep in mind that a solid uptick in private consumption is well in line with our, and most other forecasters', expectations for 2025. That said, this was on the strong side of our expectations.
In the trade war, Trump signed orders to ease auto tariffs on the eve of his 100th day in office. The order gives carmakers two years to boost domestic component percentages in US-assembled vehicles, just days before 25% import taxes was set to kick off in automotive components. The order will not affect the 25% tariff on vehicle imports to the US.
Equities: Equities were higher yesterday. US markets posted solid gains with S&P 500 gaining 0.6%, close to day-highs. Market breadth was impressive, with little discrepancy between defensives/cyclicals, growth/value and so on. We interpret this as investors raising the overall equity allocation again, chasing the rally, rather than making selective bets. One unusual sector dynamic worth noting: Real estate and banks being top performers - at the same time. This is a combination few investors would buy into a few months ago but which makes fully sense now, as these sectors will benefit from a pause in the recession trade, but not get meaningfully impacted by the swings in FX or trade disruptions, if the tariff discussion would shift back again. US futures are heading lower this morning.
FI & FX: With risk appetite holding up well, US Treasury yields continued to drift lower, resulting in a modest bull steepening of the curve. In contrast, the 2Y German Bund yield was broadly unchanged around 1.74%, while the 10Y Bund yield fell 2bp, marginally tightening the transatlantic spread and continuing the recent convergence in US-European yield differentials. In an otherwise relatively quiet week, the USD found some support from the continued positive risk environment, bolstered by de-escalating tariff headlines - even as JOLTS job openings saw a larger-than-expected decline in March (ahead of Liberation Day). EUR/SEK has been in consolidation mode around current levels just below 11.00 for the last two weeks. Today, Norges Bank will announce its daily FX transactions (both fiscal and FX cap) for May. We expect an unchanged net NOK purchase amount just above 0.
GBP/JPY Daily Outlook
Daily Pivots: (S1) 190.39; (P) 190.87; (R1) 191.34; More...
Intraday bias in GBP/JPY is turned neutral first with current retreat. Rebound from 184.35 is in favor to continue as long as 189.28 minor support holds. Above 191.70 will target 195.95 resistance next. However, break of 189.28 will suggest that the rebound has completed and turn bias back to the downside.
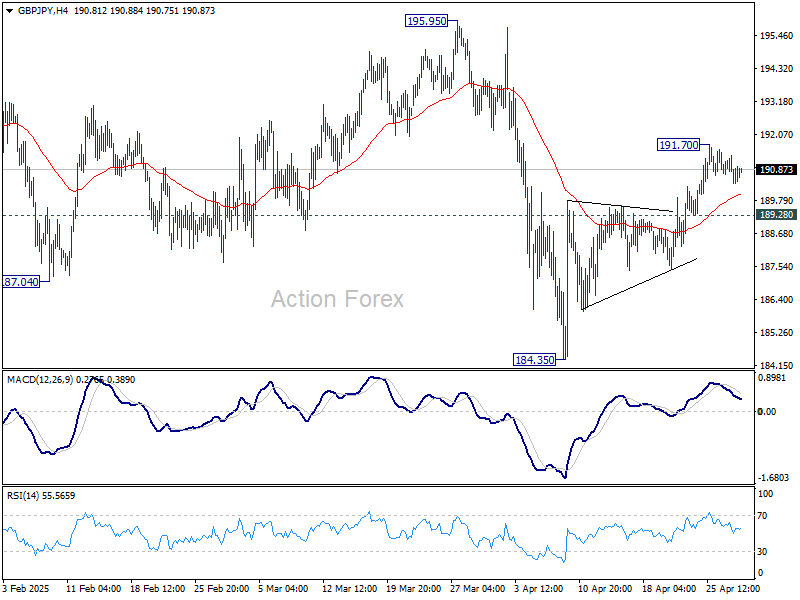
In the bigger picture, price actions from 208.09 are seen as a correction to rally from 123.94 (2020 low). Strong support should be seen from 38.2% retracement of 123.94 to 208.09 at 175.94 to contain downside. However, sustained break of 175.94 will bring deeper fall even still as a correction.

Markets Ignores Trade News Ahead of Data Barrage; Aussie Outperforms
Global financial markets are largely steady ahead of a packed economic calendar, with traders bracing for volatility as Eurozone and US GDP figures, as well as US PCE inflation data, are due shortly. Despite negative signals from China’s latest PMI reports, and another round of trade headlines, market reactions remain muted.
Risk sentiment is cautiously tilted to the positive side, reflected in the stronger performance of commodity-linked currencies like Australian, New Zealand, and Canadian Dollars. But major moves have yet to materialize. Euro, Sterling, and Yen are on the softer side, while Dollar and Swiss Franc are mixed.
Trade developments, which dominated headlines in recent weeks, offered some positive news but failed to stir markets significantly. US President Donald Trump signed a set of executive orders to ease the impact of automotive tariffs, including provisions for credits and relief on other levies. Commerce Secretary Howard Lutnick hinted at a breakthrough with one country to permanently remove reciprocal tariffs, though withheld specifics.
In Australia, Q1 CPI report slightly exceeded expectations on the headline but failed to derail market conviction on RBA policy. Crucially, the trimmed mean CPI—a preferred core measure—returned to within the RBA’s 2–3% target band for the first time since 2021. Services disinflation has also progressed notably. These trends, coupled with a slowing economic backdrop, have cemented expectations for a 25bps rate cut in May.
Nevertheless, RBA's path of easing is likely to remain steady and measured. Unless there is a material deterioration in the global or domestic outlook, the central bank is expected to proceed with one cut per quarter.
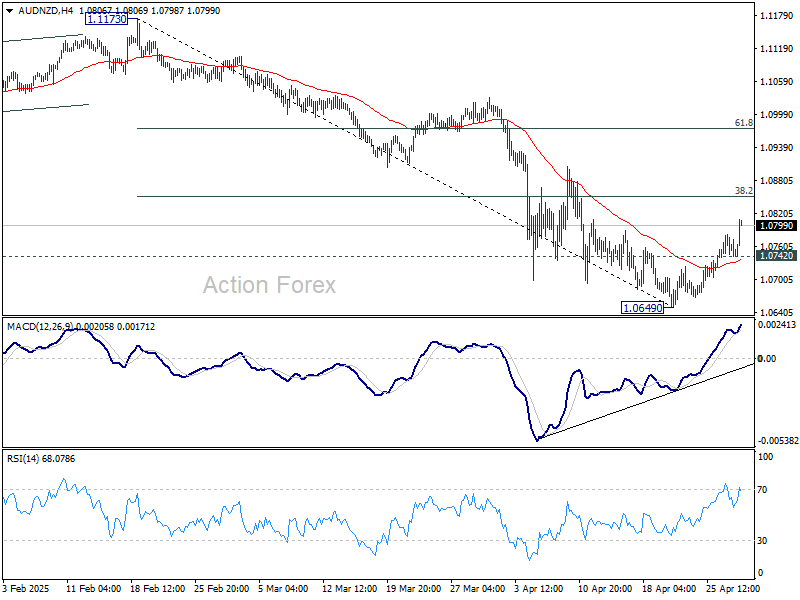
Technically, AUD/NZD is extending the rebound from 1.0649 short term bottom today. Nevertheless, this rally is currently seen as a corrective move only. Hence, upside should be limited by 38.2% retracement of 1.1173 to 1.0649 at 1.0849. Break of 1.0742 minor support will turn bias back to the downside for retesting 1.0649, and possibly resuming larger fall. However, firm break of 1.0849 will raise the chance of near term bullish reversal, and target 61.8% retracement at 1.0973 next.
In Asia, at the time of writing, Nikkei is up 0.30%. Hong Kong HSI is up 0.37%. China Shanghai SSE is down -0.09%. Singapore Strait Times is up 0.44%. Japan 10-year JGB yield is down -0.006 at 1.309. Overnight, DOW rose 0.75%. S&P 500 rose 0.58%. NASDAQ rose 0.55%. 10-year yield fell -0.043 to 4.173.
Looking ahead, Eurozone GDP is the main focus in European session. Later in the day, Canada GDP will be a feature today. But most attention would be on US ADP employment, Q1 GDP dance, March personal income and spending, and PCE inflation.
Australia's trimmed mean CPI returns to RBA's target band, services inflation eases further
Australia's headline CPI was unchanged at 2.4% yoy in Q1, above expectations of a slight decline to 2.2% yoy. On a quarterly basis, CPI rose 0.9% qoq, also exceeding forecast of 0.8% qoq.
The closely watched trimmed mean CPI, a core inflation gauge, slowed from 3.3% yoy to 2.9% yoy , falling back within RBA’s 2–3% target range for the first time since 2021, in line with market expectations. However, the quarterly increase of 0.7% qoq was a touch higher than the anticipated 0.6% qoq.
Annual goods inflation accelerated from 0.8% yoy to 1.3% yoy, driven by a notable rebound in electricity prices. Services inflation eased from 4.3% yoy to 3.7% yoy, its lowest since mid-2022, amid broad-based moderation in rent and insurance costs.
NZ ANZ business confidence falls to 49.3, inflation expectations steady
New Zealand's ANZ Business Confidence fell sharply in April, dropping from 57.5 to 49.3. The own activity outlook also edged lower from 48.6 to 47.7.
ANZ noted the decline may reflect growing apprehension over the global economic outlook, particularly uncertainty stemming from the escalating US-China trade war and broader policy unpredictability from the US administration.
Cost expectations three months ahead surged from 74.1 to 77.9, the highest level since September 2023. This contrasts with a slight dip in pricing intentions, which eased from 51.3 to 49.4. Inflation expectations one year out remained largely steady at 2.65%.
Japan’s industrial output slides -1.1% mom on auto weakness
Japan’s industrial production fell by -1.1% mom in March, significantly worse than the anticipated -0.7% mom decline.
According to the Ministry of Economy, Trade and Industry, the sharp drop was led by a -5.9% mom fall in motor vehicle output. Notably, regular passenger car production slipped -4.1% mom due to weaker export demand, while small vehicle output plunged -23.2% mom, reflecting disruptions in auto parts supply chains.
The slump in production comes against the backdrop of rising trade tensions, with US President Donald Trump imposing a 25% tariff on car and truck imports and a sweeping 24% tariff on all Japanese goods, later temporarily reduced to 10%.
Japanese manufacturers surveyed by METI project a recovery ahead, with output expected to rise 1.3% mom in April and 3.9% mom in May. But ministry officials remain cautious. “The environment surrounding production remains highly uncertain,” a METI representative warned, adding that manufacturers are clearly worried about the impact of US tariffs, though no changes to production plans have been formally announced yet.
Also released, retail sales rose 3.1% yoy in March, below expectations of 3.6%. Still, the result marks the 37th consecutive month of gains, indicating that domestic consumption has yet to show significant signs of stress.
China's factory activity slumps on trade conflicts, optimism near record lows
China’s factory activity slumped sharply in April as official NBS Manufacturing PMI dropped from 50.5 to 49.0, its lowest level since December 2023 and below expectations of 49.9. Non-manufacturing PMI also weakened from 50.8 to 50.4.
The decline points to early signs of strain from escalating trade tensions, with NBS citing “sharp changes in the external environment” as a key driver.
Private-sector data painted a similarly cautious picture. Caixin Manufacturing PMI dropped to 50.4, its lowest in three months and just narrowly remaining in expansion.
Caixin's Senior Economist Wang Zhe noted that while production and demand grew modestly, the pace has slowed and forward-looking optimism weakened significantly—plunging to the third-lowest level ever recorded. Trade-related uncertainty was a key concern for firms, weighing heavily on sentiment despite hopes for more policy support.
The April PMIs point to early-stage fallout from the China-US tariff standoff. Businesses are already reporting shrinking employment, delayed logistics, and inventory drawdowns. With both consumer and business confidence faltering, the government faces growing pressure to deploy stimulus measures. Unless domestic demand recovers and external risks subside, China’s economy could face more headwinds in Q2 and beyond.
GBP/JPY Daily Outlook
Daily Pivots: (S1) 190.39; (P) 190.87; (R1) 191.34; More...
Intraday bias in GBP/JPY is turned neutral first with current retreat. Rebound from 184.35 is in favor to continue as long as 189.28 minor support holds. Above 191.70 will target 195.95 resistance next. However, break of 189.28 will suggest that the rebound has completed and turn bias back to the downside.
In the bigger picture, price actions from 208.09 are seen as a correction to rally from 123.94 (2020 low). Strong support should be seen from 38.2% retracement of 123.94 to 208.09 at 175.94 to contain downside. However, sustained break of 175.94 will bring deeper fall even still as a correction.
Australia: March Quarter CPI Locks in Rate Cut
Headline CPI 0.9%qtr/2.4%yr; Trimmed Mean 0.7%qtr/2.9%yr; Weighted Median 0.7%qtr/2.9%yr. Momentum in core inflation at the bottom of the band.
The CPI gained 0.9% in the March quarter, stronger than market consensus (0.8%) and Westpac’s expectation (0.7%) but we did highlight upside risk to our estimate. The annual pace of headline inflation, at 2.4%yr now definitively below the mid-point of the RBA’s inflation target band.
The more important measure of core inflation, the Trimmed Mean, rose 0.7% taking the annual pace down into the RBA’s target band at 2.9%yr with the two-quarter annualised pace dropping down to 2.4%yr. Westpac and the market had been looking for a 0.6% increase while we did see the risk to the upside of our estimate.
With the momentum in core inflation definitively at the bottom of the target band inflationary pressures have moderated, and the door is open for a rate cut in May. Our Chief Economist, Luci Ellis, had already locked in a rate cut for May “Lock it in: RBA to cut 25bps in May” and today’s data provides no reason to question that view.
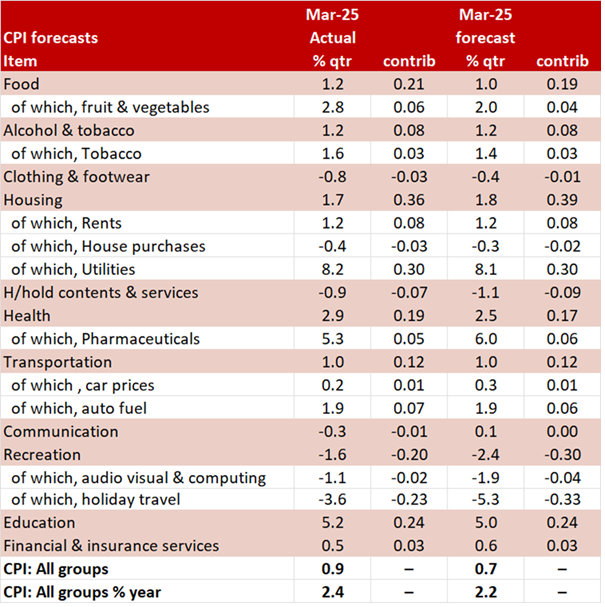
The Monthly CPI Indicator came in 2.4%yr, the market was expecting 2.2%yr, Westpac was at 2.0%yr. Most of the variation to our estimate was due to stronger than expected increases in food, electricity, health, travel and education.
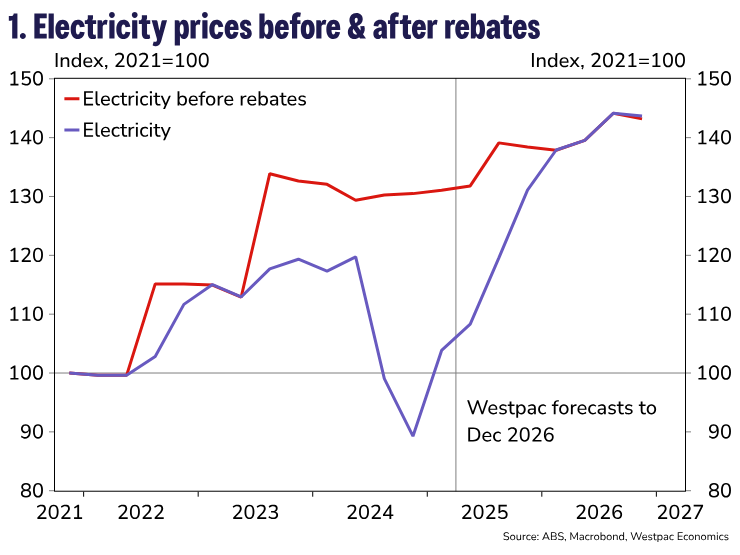
Headline inflation has been significantly reduced by various cost-of-living measures, but this is now being reversed as the energy rebates are being unwound, particularly the large $1,000 lump sum rebate in Qld. This quarter we saw a 16.3% increase in electricity prices which was stronger than our 14.5% estimate (worth an additional 0.05ppt on the CPI).
We estimated that these measures have shaved 0.5% off inflation in the year to March 2025. However, in the quarter with electricity prices rising we found that the rebates added 0.1ppt to the CPI. However, impact of these cost-of-living measures have had a limited impact on core inflation. As such the Trimmed Mean remains a reliable measure of core inflationary pressures and thus presents no hinderance to a rate cut by the RBA.
Core inflation is being held down by the moderation in housing inflation due to the moderation in rents and dwellings. Rents did rise a robust 1.2% in the quarter, but this is a step down from the 1.6% increase last September, 2.0% last June and 2.1% last March. The 0.6% increase last December was due to the maximum assistance from the Commonwealth Rent Assistance being increased by 10% on 20 September 2024. The annual pace of rental inflation is now down to 5.5%yr from 6.4%yr in December and a March 2024 peak of 7.8%yr.
This also has an impact on services inflation as the slower pace of services inflation in the March quarter was driven by moderating price growth for insurance and rents. Services inflation was 3.7%yr in March, down from 4.3%yr in December and a recent peak of 4.6%yr at September 2024. Market sector services, which is our preferred measure of domestic inflationary pressure, fell –0.1% in the March quarter, the first quarterly decline since June 2020. This took the annual pace down to 3.3%yr from 4.2%yr in December. This is the slowest pace of market services ex volatile inflation since March 2022. We had been expecting this measure to moderate as wages undershot expectations through 2024.
Dwelling prices fell –0.4% in March following a –0.2% fall in December taking the annual pace of dwellings inflation to 1.4%yr. Dwellings inflation peaked at 20.7yr in September 2022. The ABS notes that the moderation in dwellings inflation reflects project home builders increasing incentives and promotional offers to entice new business in a subdued new home market.
Compared to our expectations the main variations in the components of the CPI were:
- Food increased 1.2% vs 1.0% expected (+0.02ppt). The main contributors to the rise were fruit & vegetables (+2.8%), meals out & take away foods (+0.6%), non-alcoholic beverages (+3.2%) and food products n.e.c (+1.6%). Most of our error was with fruit & vegetables.
- Clothing footwear fell –0.8% vs –0.4% expected (–0.01ppt). The main contributors to the fall were garments (-1.1%) and footwear (-3.7%), driven by post-Christmas and back to school sales.
- Household contents & services fell –0.9% vs –1.1% expected (+0.01ppt). Furniture (-5.5%) was the main contributor to the fall, driven by post-Christmas sales on bedroom furniture. There was a partial offset from child care (+2.4%).
- Health rose +2.9% vs 2.5% expected (+0.03ppt). Medical & hospital services (+2.7%) and pharmaceutical products (+5.3%) rose because of the cyclical reduction in the proportion of consumers who qualify for subsidies under the Medicare Safety Net and Pharmaceutical Benefits Scheme (PBS). The safety net thresholds for both the PBS and Medicare are reset on 1 January each year.
- The most significant variation to our estimate was in recreation which recorded a –1.6% fall compared to –2.4 fall expected (0.10ppt) of which most was due to a smaller than expected fall in holiday travel: –3.6% vs –5.3% expected (0.11ppt). International holiday travel & accommodation (-7.6%) was the main contributor to the fall due to lower demand following the peak December holiday period.
- Education was a touch stronger at 5.2% vs 5.0% expected (0.01ppt). Secondary education (+6.4%) and preschool & primary education (+5.6%) rose reflecting fee increases at the start of the school year. The rises were driven by higher operating costs that were passed through as higher school fees. Tertiary education rose 3.6% due to the annual CPI indexation being applied to university course fees at the start of the year. This was partly offset by soft growth in TAFE fees as the federal government, in partnership with state and territory governments, continued fee-free TAFE places in 2025.