Sample Category Title
EURNZD Bullish from Blue Box Area, Upside Target is Close
Hello traders and welcome to a new blog post where we discuss trade ideas that Elliottwave-Forecast members took recently. Members recently went long on the EURNZD currency pair and are now close to the first target. The post will discuss how we came about the setup and how we intend managing the trade.
EURNZD has maintained a bullish corrective cycle since the lows of April 2015. The structure evolving is a double zigzag pattern for wave ((IV)) of the supercycle degree of the all-time bearish cycle. Meanwhile, it should be noted that this wave ((IV)) has not yet reached the target. Often times, corrective structures reach the extreme we expect unless price dictates otherwise. So far nothing of such information from the price. Thus, we continue to look forward to a higher prices until wave ((IV)) ends at the extreme area. Meanwhile, while it’s in progress, we explained to members why they should buy pullback in 3, 7 or 11 swing setup from the blue box. Thus, Group 2 members understand how to go about the trade. Good for us, a pullback emerged from the peak of April 2025. We were patient to see the pullback emerged into a clear 3-swing structure.
EURNZD Bullish Setup – 4.15.2025 Update
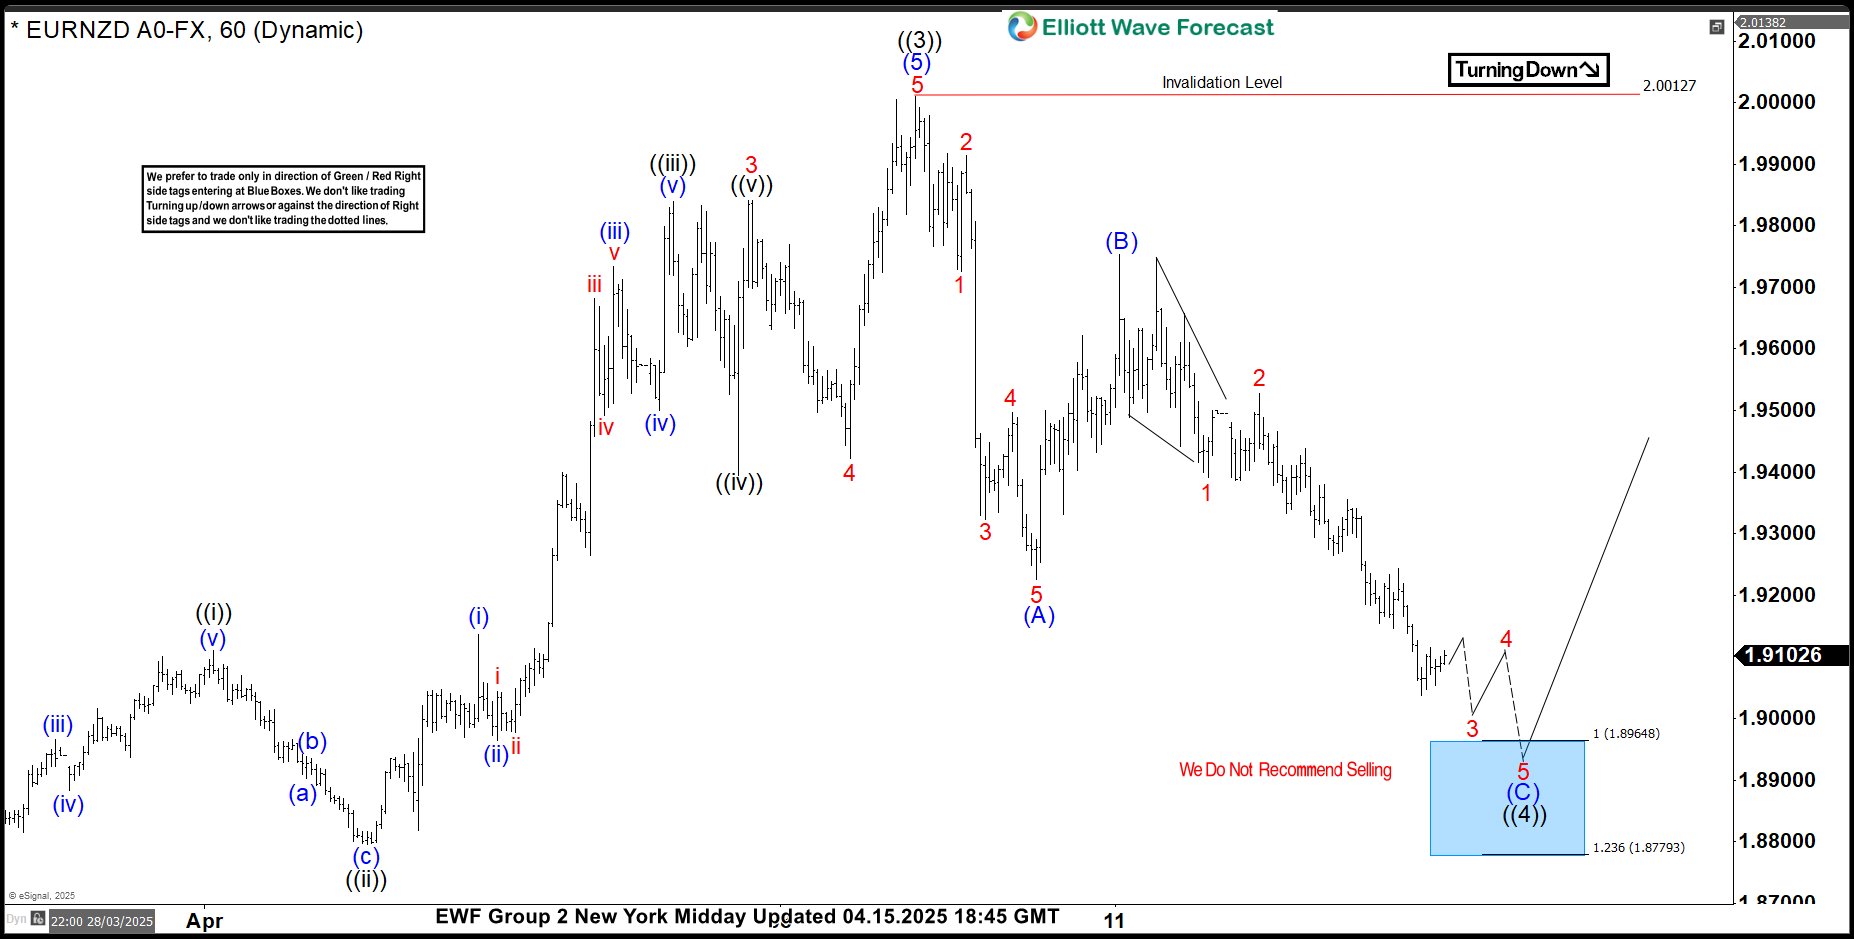
On 15th April 2024, we shared the chart above with members. The expected pullback was for wave ((4)) of the cycle degree wave c from September 2024. Wave ((4)) evolved lower with a 3-swing structure. Wave (A) of ((4)) finished with an impulse structure while wave (B) finished with a zigzag. As expected, wave (C) completed another impulse structure in the blue box. Thus, wave ((4)) was making a clear A-B-C corrective structure. We identified the blue box between 1.8964-1.8477 as the extreme area. Thus, we advised the group 2 members to buy at 1.8964 and set stop at 1.8477. What happened in the following few days?
EURNZD Bullish Setup – 4.15.2025 Update
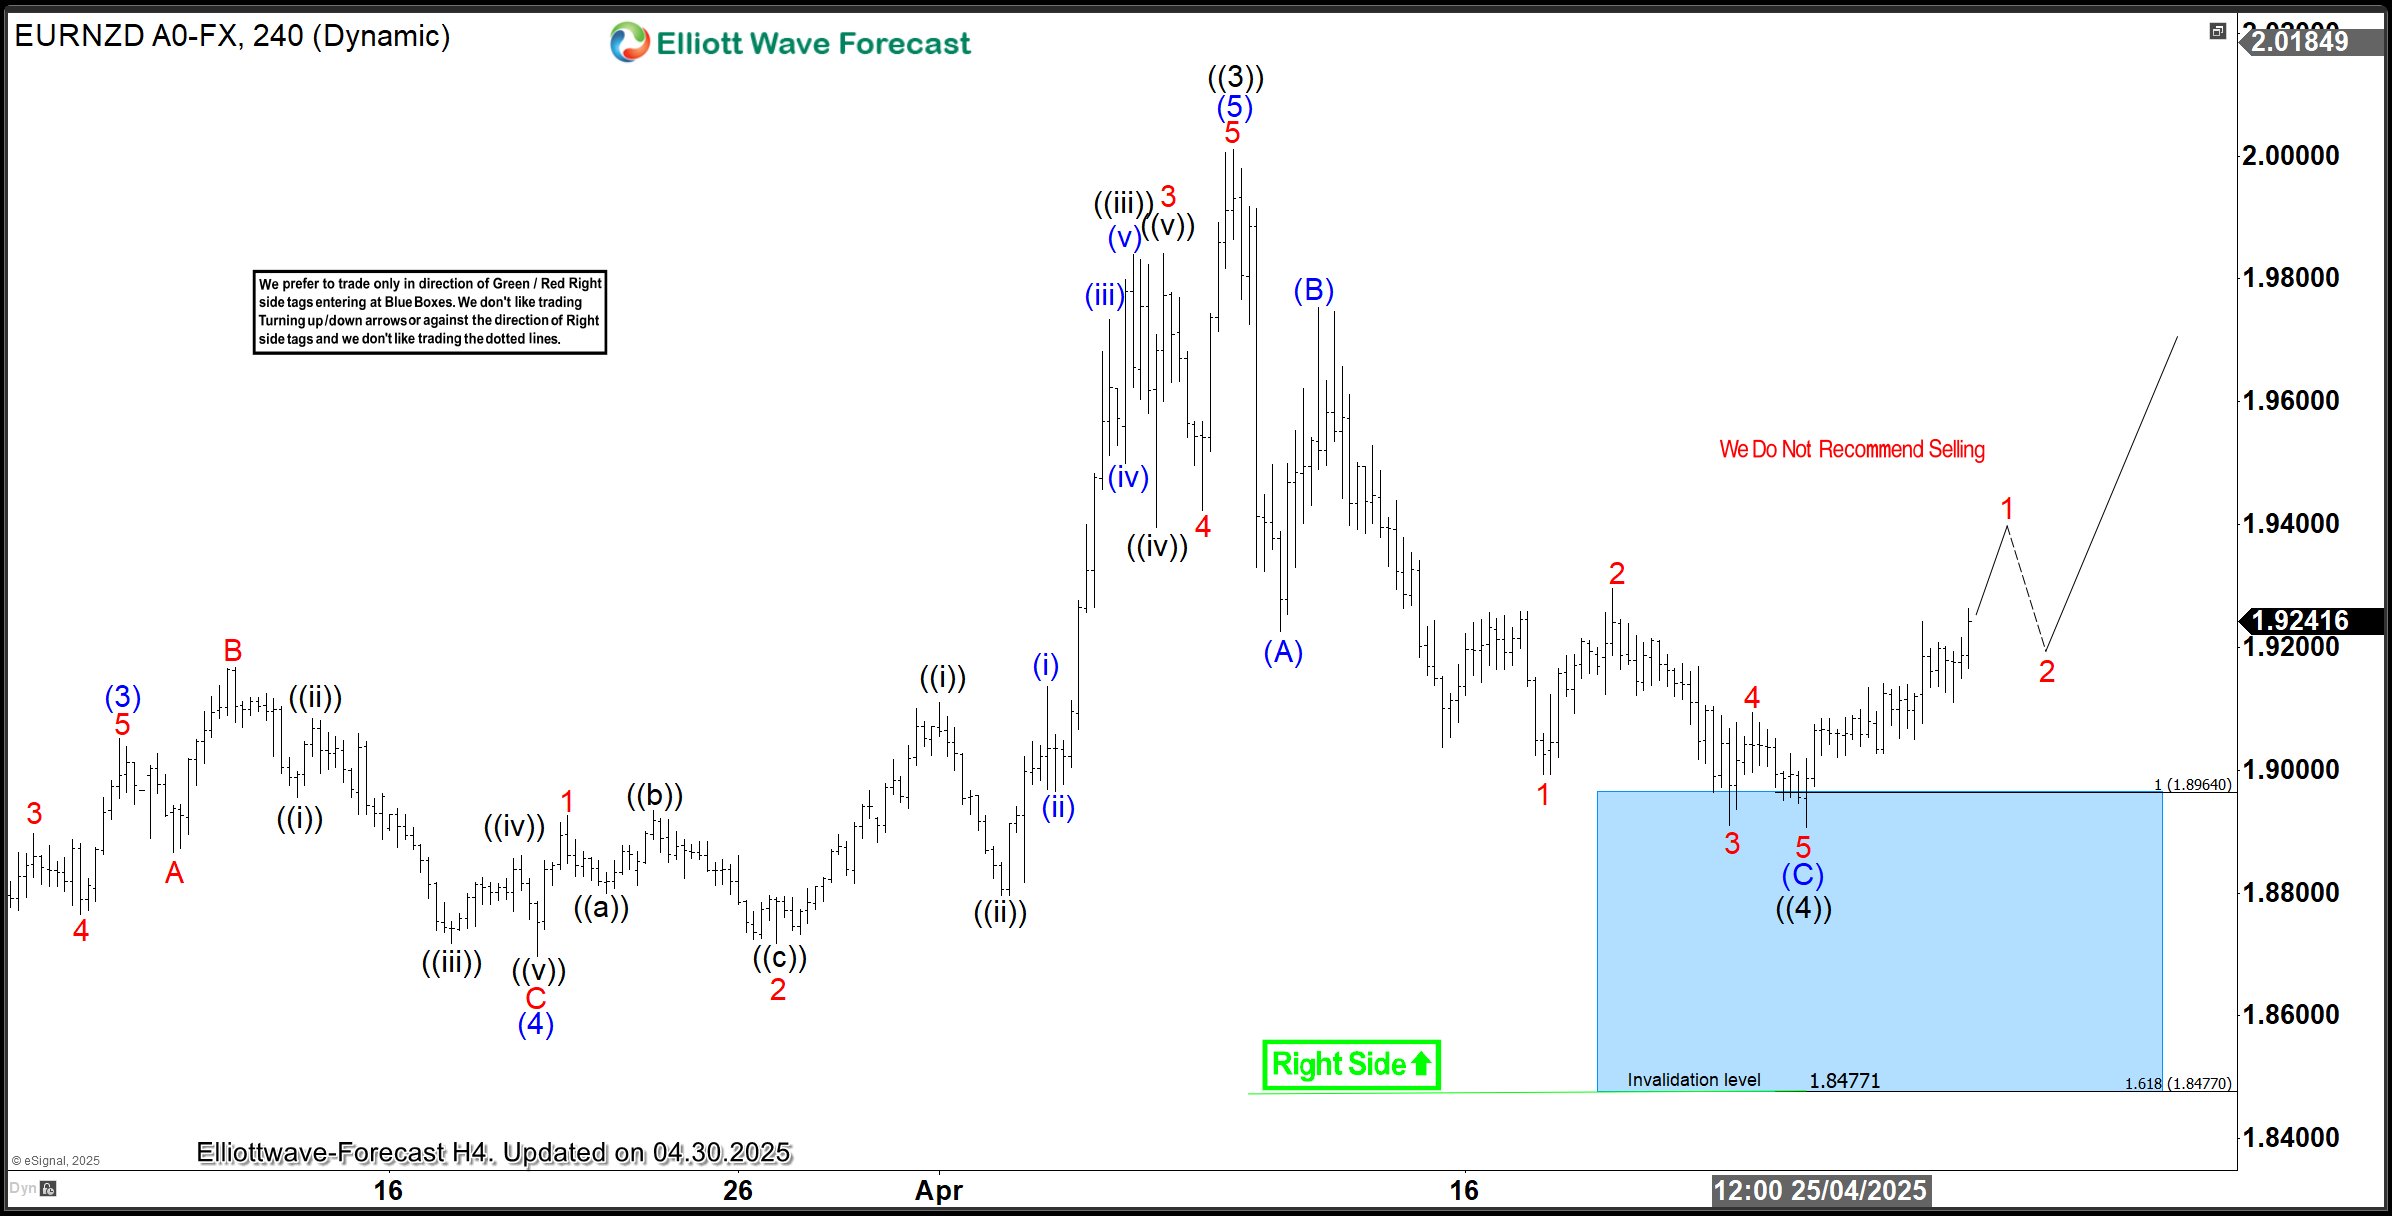
EURNZD found support in the blue box as expected. Price significantly touched the zone and triggered buyers into position. We shared the chart above with members on 25th April 2025. The chart shows price reacting higher from the blue box. The first target for this trade is at 1.933. At 1.933, members will close half of their positions in profit and adjust the rest to breakeven while expecting an impulse rally to evolve for wave ((5)). Meanwhile, the final target will be at 2.027 where traders can close the rest of their positions.
However, if the bullish response is not an impulse structure, it should be at least a 3-swing bounce before turning lower to attempt a double correction for wave ((4)) much lower. After a 3-swing bounce, price should at least hit the first target. Thus, this will allow members to hold some profit while closing down risk. If a 7-swing setup eventually happens lower for ((4)), we will like to buy again at the new extreme.
This is how we like managing this trade. We will expect an impulse rally and also prepare for a deeper ((4)). Until the wave ((IV)) cycle from April 2015 reaches the extreme, we will continue to go long from the blue box on both the H1 and H4 charts.
Dollar Index on Track for the Biggest Monthly Loss Since November 2022
The dollar index remains constructive and edged higher on Wednesday after data showed that US economy slipped in the first quarter against consensus for a small rise, though it showed better results from expectations of some big US banks.
The greenback is still firmly negative overall, suggesting that larger bearish cycle is far from over and bear-trend is likely to resume after consolidation, fueled by current conflicting signals about possible solution for US-China trade conflict or its escalation.
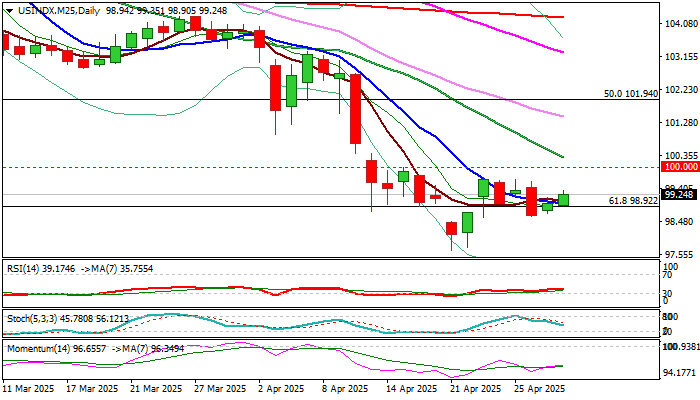
The dollar index is on track for the third consecutive month in red, with steep downtrend from February peak, showing strong acceleration.
April’s drop presents the biggest monthly loss since November 2022, with monthly close below psychological 100 level to add to bearish signal, which still looks for verification on clear break below the floor of 2023/24 range (99.20) that would expose next significant support at 96.30 (bull-trendline off 2011 low).
Bearish daily studies suggest consolidation / limited correction should be ideally capped under solid resistances at 100.00/30 (psychological / falling 20 DMA) with extended upticks to be capped by daily Kijun-sen (100.98) to keep larger bears intact
Res: 99.72; 100.00; 100.30; 100.98
Sup: 98.63; 97.65; 96.30; 95.18
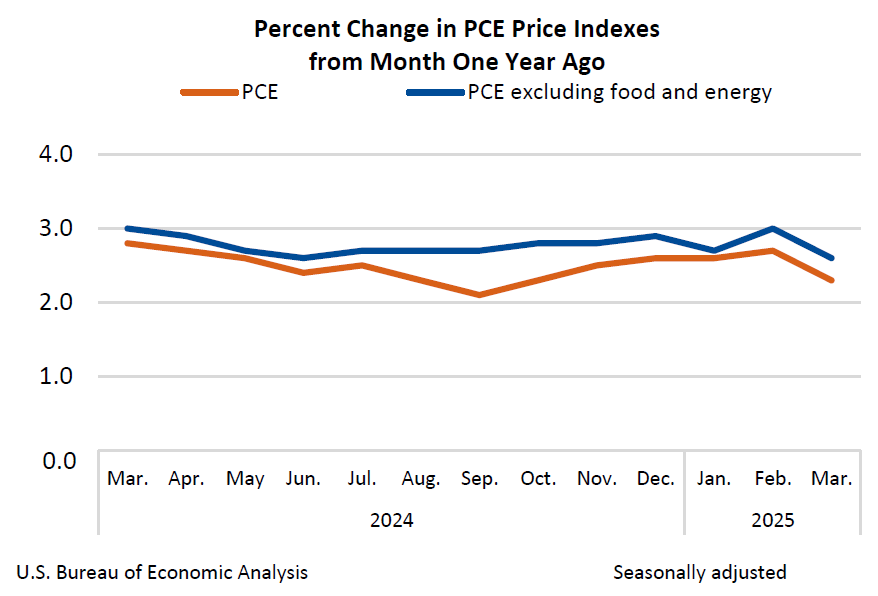
US core PCE inflation cools to 2.6%, spending remains resilient
US core PCE price index, Fed's preferred inflation gauge, came in flat on a monthly basis in March, undershooting expectations of 0.1% mom rise. Headline PCE index was also flat, matched expectations.
On a year-over-year basis, core PCE inflation eased from 3.0% to 2.6%, offering some reassurance that underlying price pressures are gradually moderating. Headline PCE inflation also slowed from 2.7% to 2.3% yoy, slightly above expectation of 2.2%.
Meanwhile, consumers continue to spend. Personal income rose 0.5% mom, outpacing forecasts of 0.6% mom. Spending jumped 0.7% mom above expectation of 0.6% mom, led by solid increases in both goods and services.
Sunset Market Commentary
Markets
Markets faced a difficult task today, navigating through a busy eco calendar. In the end, Q1 US GDP data triggered a temporary bear steepening of the US yield curve pushing yields in a first reaction 1 bp (2-yr) to 10 bps (30-yr) higher. EUR/USD was unnerved while US equity futures suffered the bigger (stagflation) hit, resulting in opening losses of 1% (Dow) to 2% (Nasdaq). Negative risk sentiment seems to be the dominant factor for the remainder of today’s trading session. GDP growth contracted marginally (-0.3% Q/Qa) in line with consensus (-0.2%). Details however showed that the pullback in personal consumption was less than feared (+1.8% Q/Qa vs 1.2%) while gross private investment (+21.9% Q/Qa !!) surged thanks to business outlays for equipment. Inventories also contributed positively (+2.25 ppt to GDP), but the trio of failed to offset the drag from government spending (-1.4% Q/Qa) and especially net exports (subtracting almost 5 ppt from GDP, most on record). Shallow export growth (1.8% Q/Qa) fainted against surging imports (+41.3% Q/Qa), frontrunning the hawkish shift in US trade policy. When extracting volatile swings in inventories and trade, final sales to private domestic purchasers accelerated marginally from 2.9% Q/Qa in Q4 to 3% in Q1. Better than feared domestic demand was complemented by stronger than expected price pressure with the core PCE price index accelerating from 2.6% Q/Q in Q4 to 3.5% Q/Q, the second fastest pace since Q2 2023. The employment cost index stabilized at 0.9% Q/Q. Today’s US GDP release outshadowed slower job growth pace in the ADP employment survey for April (+62k vs +115k expected) and an unaltered quarterly refunding statement by the US Treasury. EMU eco data for now fail to move the needle in market thinking on the future ECB policy rate path (June rate cut and 1.5% policy rate bottom). Even as today’s numbers showed stronger Q1 GDP growth (0.4% Q/Q from 0.2% and vs 0.2% expected). National inflation numbers generally point to upside risks to Friday’s EMU release as well with German inflation rising by 0.5% M/M (vs 0.4%) and both French and Spanish prices up by 0.6% M/M (vs 0.4% and 0.3% expected respectively). Only Italy bucked the trend (+0.5% M/M vs 0.6% consensus). Both stronger growth and higher inflation complicate the ECB’s June forecasting task.
News & Views
The Swiss KOF Economic Institute’s economic barometer pointed at a darkening outlook for the Swiss economy. The barometer declined by a strong 6.1 points in April to 97.1. After an increase in March, the index drops below its medium-term average for the first time this year. Negative developments are reflected in the majority of sub-indicators. In particular, manufacturing experiences a strong setback. Similarly, the bundles for other services and hospitality are under downward pressure. Solely financial and insurance services remains nearly unaltered. Within the producing industry (manufacturing and construction), the sub-indicators for different aspects of business activity all show negative developments, except for the sub-indicators for the stock of finished products. Particularly negatively impacted are the sub-indicators for exports, production activity and the competitive situation. Within manufacturing, the indicators for vehicle and also machinery and equipment, for paper and printing producers as well as for the electrical industry are slowing down most noticeably. After strengthening on safe haven flows to EUR/CHF 0.9225 mid-April, the Swiss franc recently eased modestly but at 0.9375 still is a potential deflationary factor to take into account for SNB policy.
Czech GDP rose by 0.5% Q/Q (+2% Y/Y), mainly driven by household final consumption expenditure. Gross capital formation and external demand also had a slightly positive influence. Hungarian GDP contracted by 0.2% Q/Q (-0.4% Y/Y). Polish CPI inflation rose by 0.4% M/M and 4.2% Y/Y (from 4.9% in March). Food prices rose by 0.8% M/M. Prices of electricity and gas (-0.4%) and fuel prices (-1.7%) declined. The further cooling in the Y/Y measure supports the case for the NBP to restart policy easing at the May 6-7 meeting. Even a 50 bps step might be on the cards.
GDP Contracts as Import Surge Brings Record Drag from Trade
Summary
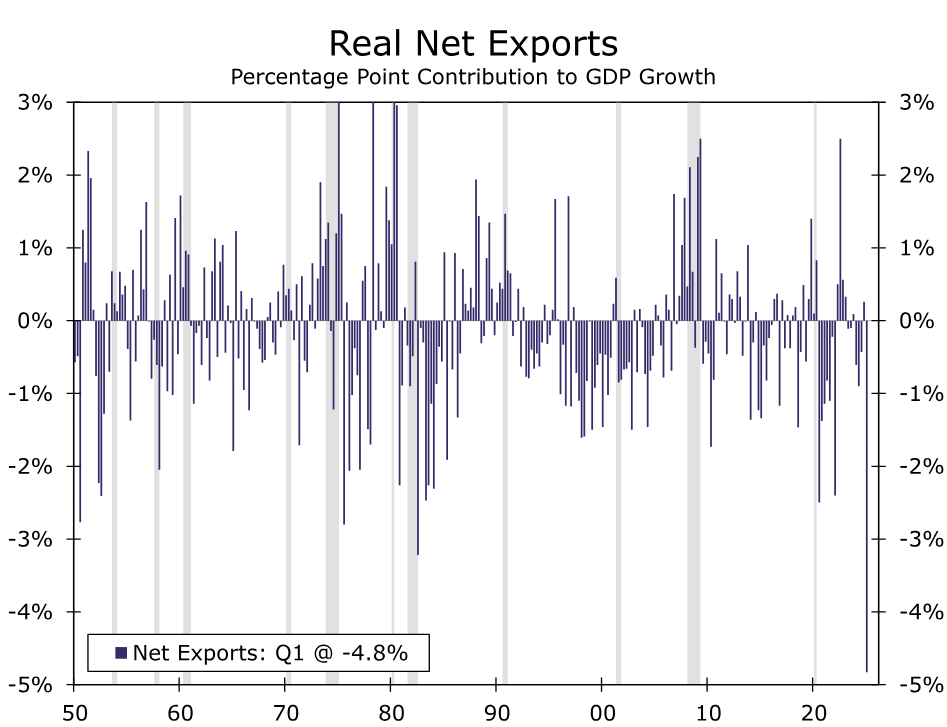
The U.S. economy is at a greater risk of recession now than it was a month ago, but this 0.3% contraction in Q1 GDP is not the start of one. It reflects instead the sudden change in trade policy that culminated in the biggest drag from net exports in data going back more than a half-century.
Economy Falls into the Trade Gap
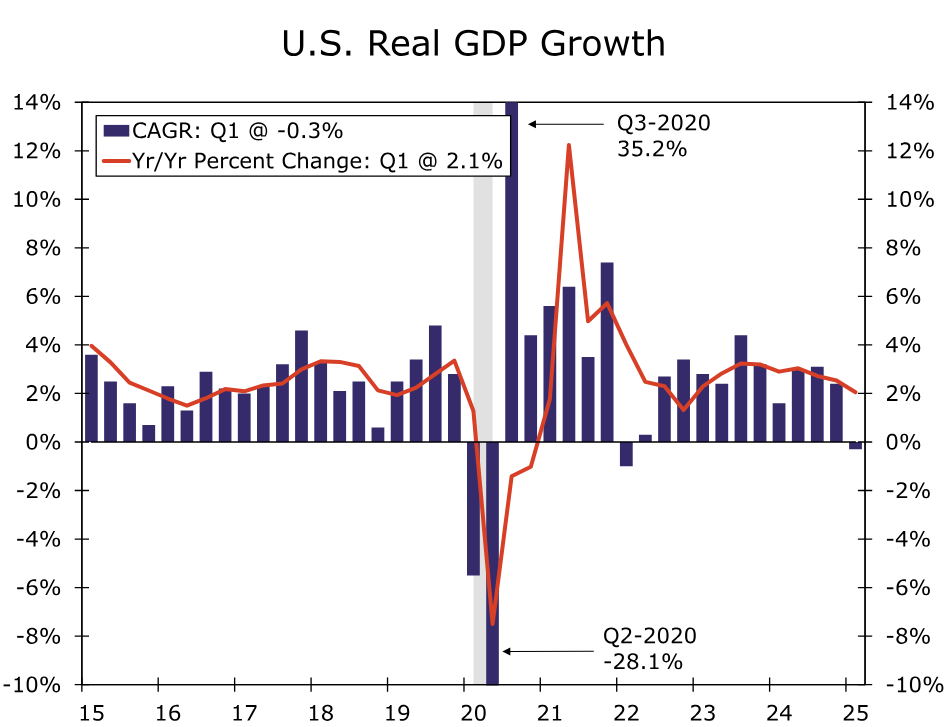
The U.S. economy contracted at a 0.3% annualized rate in the first quarter (chart). If you look at this development through the lens of businesses and households trying to get ahead of the tariffs, many of the big pieces of today's report fall into line. For starters, trade lopped 4.8 percentage points off of first quarter growth. It is rare for a drag that large to come from a comparatively small component of GDP such as net exports. In fact, we haven't seen a drag of this size in data going back to the late 1940s (chart). This is not because trade activity was grinding to a halt, but rather because imports shot up as firms tried to pull forward needed industrial supplies and retailers stocked their shelves with consumer goods.
Consumers pulled forward demand somewhat as well with overall PCE growth coming in stronger than expected at 1.8% during the period. That stronger-than-expected outturn exerted a 1.2 percentage point boost to the headline number which kept the contraction in GDP from being a larger one. While it might be handy to point to pre-tariff spending to explain the stronger consumer numbers, that is not an entirely accurate way to characterize what is happening. While monthly auto sales and anecdotal comments from retailers suggest a jump in March spending, most of the strength in PCE was in service outlays which rose 2.4%, much stronger than the 0.5% gain in goods outlays.
In a March report titled April Showers, we previewed some of the economic tumult that was in store for this month, saying that in a climate of uncertainty, April would bring some hard details. On this 30th and final day of the month, the first look at Q1 GDP was more or less right in line with what we described in that preview note when we said that “in anecdotal conversations we’re having with trucking and logistics clients, the rush to get product continued into March...if we see a continued pull-forward in demand, trade could be an even larger drag on first quarter growth.”
The curious thing about today's report, in our view, is that despite the 4.8 percentage point drag from trade, there was only a partial offset (2.3 percentage point boost) from inventories. If firms and retailers were indeed pulling forward needed inputs and consumer goods, it stands to reason that stockpiling would have offered more of a counterweight. We would not be surprised to see the inventory figures revised higher in subsequent releases, perhaps even enough to change this small contraction to small growth.
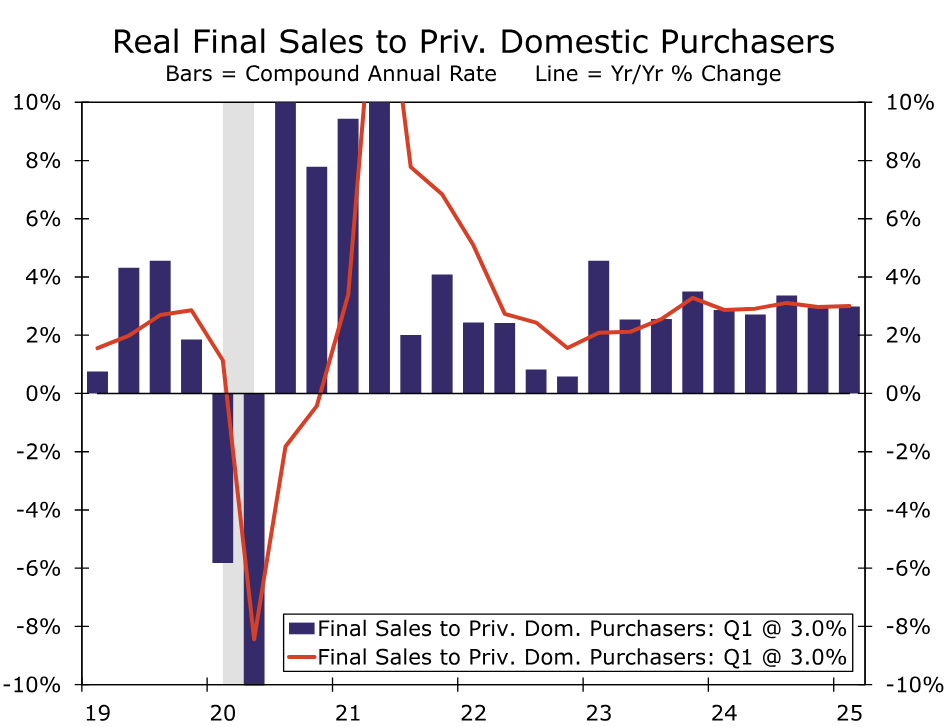
In other words, cutting through tariff effects are challenging. We often look to real final sales to domestic private purchasers for a somewhat cleaner measure of underlying domestic demand. This measure rose at an 3.0% annualized pace in Q1, suggesting a relatively steady pace of growth (chart). Yet still this measure isn't a perfect indication of underlying demand today given consumers may have pulled forward some purchases toward the tail-end of the quarter and equipment investment received a jolt, up at a 22.5% annualized pace in Q1, primarily due to a pickup in aircraft shipments.
In a nutshell, tariff disruption introduced a lot of noise into the headline Q1 growth number. The question is for how long consumers and businesses can withstand uncertainty. If Q1 growth was influenced by a pull-forward in demand to get ahead of tariffs, to what extent should we brace for a hangover effect in Q2? Consumer and business optimism has tumbled as fear of inflation and recession permeate the economic environment. The U.S. economy is at a greater risk of recession today than it was even a month ago, but this contraction in GDP is not the start of one.
U.S. Economy Sagnates, as International Trade Weighs Heavily on Q1 Growth
The U.S. economy contracted by a meager 0.3% quarter-on-quarter (q/q, annualized) in the first quarter – in line with the consensus forecast – but a sharp reversal from Q4-2024's gain of 2.4%.
Consumer spending rose 1.8% q/q, a notable deceleration from Q4's 4.0%. Spending on goods was relatively flat (+0.5% q/q), while services expanded by a healthy 2.4%.
Business investment surged 9.8% q/q, as firms appeared to front-load capital spending ahead of the tariffs taking effect. Equipment spending (+22.5% q/q) accounted for the bulk of the gain, though intellectual property products (+4.1 q/q) registered its strongest gain in a year. Structures investment remained relatively flat.
Residential investment rose by a modest 1.3% q/q, following a gain of 5.5% q/q in Q4. But even with the recent pick-up in activity, housing investment remains over 10% below its 2022 pre-Fed tightening levels.
Government spending contracted by 1.4%, as outlays for both federal defense (-8.0% q/q) and non-defense (-1.0%) declined in Q1. State & local spending rose 0.8% q/q.
International trade was the main culprit weighing on growth. Imports surged by 41.3% q/q, largely owing to a strong gain in goods imports (+50.9% q/q). Meanwhile, exports rose by a more modest 1.8% q/q, resulting in net trade subtracting 4.8 percentage points (pp) from Q1 GDP. Some of the uptick in imports showed up in inventory investment, which added 2.3pp to headline growth.
Final domestic demand slowed, but still expanded by a healthy 2.3% q/q.
Core PCE inflation – the Fed's preferred inflation gauge – rose 3.5% q/q (annualized), an acceleration from Q4's 2.6%.
Key Implications
While the U.S. economy entered 2025 with considerable momentum, the vast policy changes undertaken by the new administration have undermined the growth outlook. The pullback in first quarter GDP was overwhelmingly driven by a sharp widening in the trade deficit, as businesses scrambled to boost inventories ahead of the tariff hikes. There was also evidence of DOGE efforts weighing on growth, with federal spending shaving 0.3pp from Q1 GDP, after largely being a small source of growth in recent years. While private domestic activity held up reasonably well, it's likely the next shoe to drop.
There remains considerable uncertainty on the economic outlook. The administration's on-again-off-again tariff approach has eroded consumer and business confidence, pushed the economic policy uncertainty index to levels not seen since the pandemic and has led to a tightening in financial conditions. While consumer spending for March (released at 10:00 am ET) will show some bounce back following a sluggish start to the year, the rebound will in part be driven by a pull-through of big-ticket purchases ahead of the tariffs. This could very well persist into April, though once these effects peter out, consumption is likely to hit a wall. Fixed investment is also at risk of drying up amidst the persistent tariff policy uncertainty, suggesting a more meaningful slowdown in domestic activity is likely on deck over the coming quarters.
Canada’s Economy Flatlined in February, Small Rebound Expected in March
Canadian GDP fell by 0.2% month-on-month (m/m) in February, unwinding part of the strong gain the month prior. The reading was a touch softer than Statistics Canada and consensus expectations for flat growth. For March, Statistics Canada's flash guidance points to modest GDP growth of 0.1% m/m.
February's reading was broad-based, with output contracting in 12 of 20 industries. Growth in goods industries contributed most to the decline (-0.6% m/m), while the services sector edged lower by a smaller 0.1% m/m.
On the goods side, mining/quarrying/oil & gas (-2.5% m/m) contributed most to the drop in February GDP. A 0.9% m/m decline in residential building construction pulled the overall construction sector down for the first time in four months. Modest growth in utilities (0.8% m/m) and manufacturing (0.6% m/m) provided a positive counterbalance
On the services side, the real estate sector (-0.4% m/m) was the biggest detractor to growth, consistent with slowing homebuying activity in February. The transportation and warehousing sector (-1.1% m/m) also contributed to February's GDP decline, impacted by major snowstorms in the month. Elsewhere, the finance and insurance sector (+0.7% m/m) grew for a third consecutive month.
Key Implications
The economic momentum that carried into the early stages of 2025 is starting to wane. With the information we have at hand, Q1-2025 growth is tracking around 1.5%, a few ticks below the Bank of Canada's April MPR projections. Past this, the outlook is turbulent, with clear downside risks to Canada's economy as the direct impact from tariffs add to the headwinds from plunging sentiment.
Policymakers at the BoC have their work cut out for them. The Bank opted to hold the policy rate steady at 2.75% last meeting, despite appearing reasonably downbeat about economic growth prospects highlighted in their scenario analysis. With Canada's housing market visibly strained, and some rollover in labour markets and consumer spending, we'd expect the BoC to cut its policy rate by 25 bps at their next meeting in June.
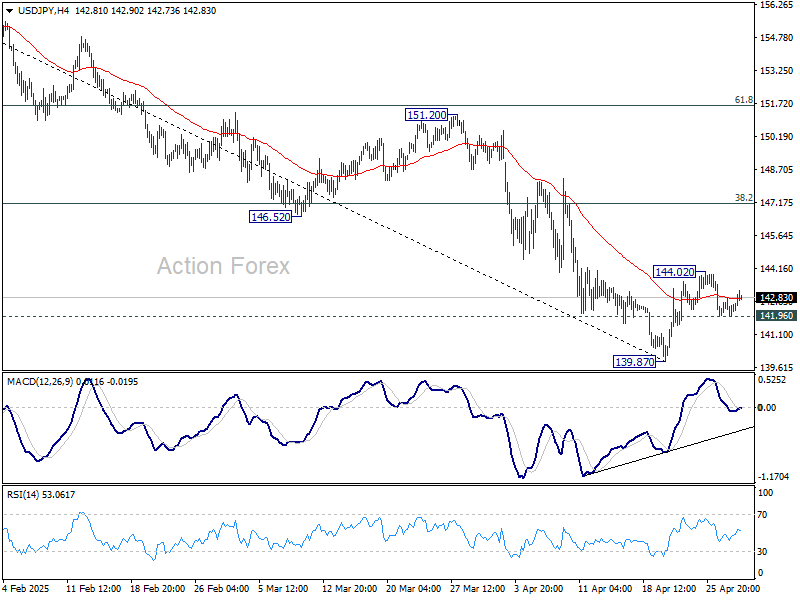
USD/JPY Mid-Day Outlook
Daily Pivots: (S1) 141.92; (P) 142.34; (R1) 142.77; More...
Intraday bias in USD/JPY remains neutral at this point. On the upside, above 144.02 will resume the rebound from 139.87. But near term outlook will stay bearish as long as 38.2% retracement of 158.86 to 139.87 at 147.12 holds. On the downside, firm break of 141.96 will argue that the recovery from 139.87 short term bottom has completed as a corrective move. Retest of 139.87 should then be seen next in this case.
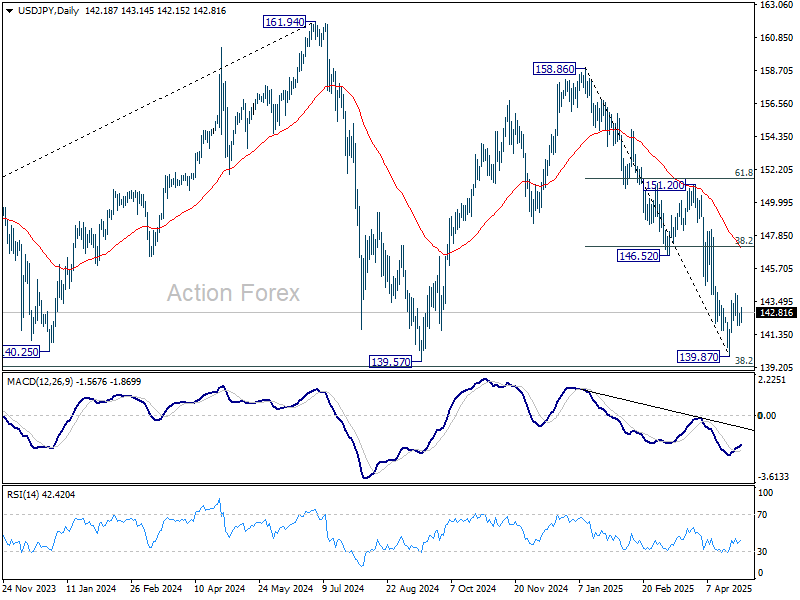
In the bigger picture, price actions from 161.94 are seen as a corrective pattern to rise from 102.58 (2021 low), with fall from 158.86 as the third leg. Strong support should be seen from 38.2% retracement of 102.58 to 161.94 at 139.26 to bring rebound. However, sustained break of 139.26 would open up deeper medium term decline to 61.8% retracement at 125.25.
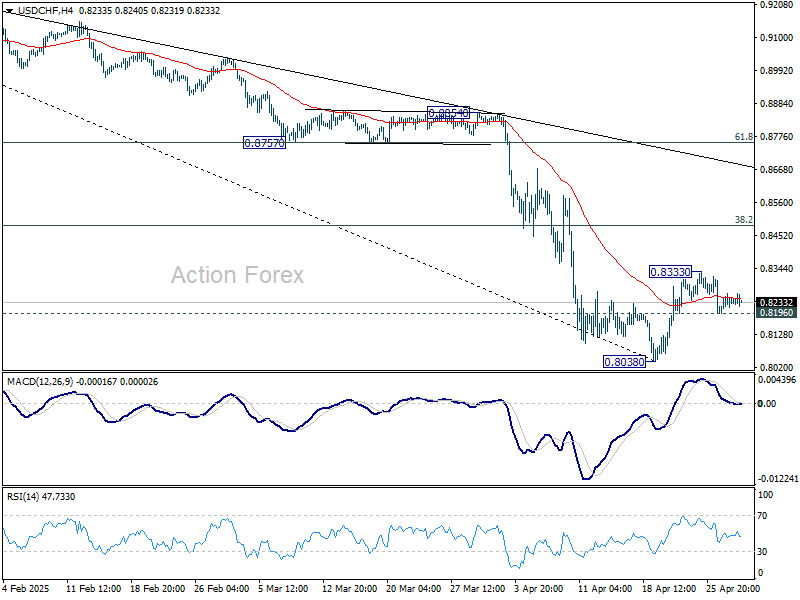
USD/CHF Mid-Day Outlook
Daily Pivots: (S1) 0.8201; (P) 0.8232; (R1) 0.8271; More….
USD/CHF is staying in tight range and intraday bias remains neutral. On the upside, above 0.8333 will resume the rebound from 0.8038 short term bottom. But upside should be limited by 38.2% retracement of 0.9200 to 0.8038 at 0.8482. On the downside, below 0.8196 minor support will bring retest of 0.8038. Firm break there will resume larger down trend.
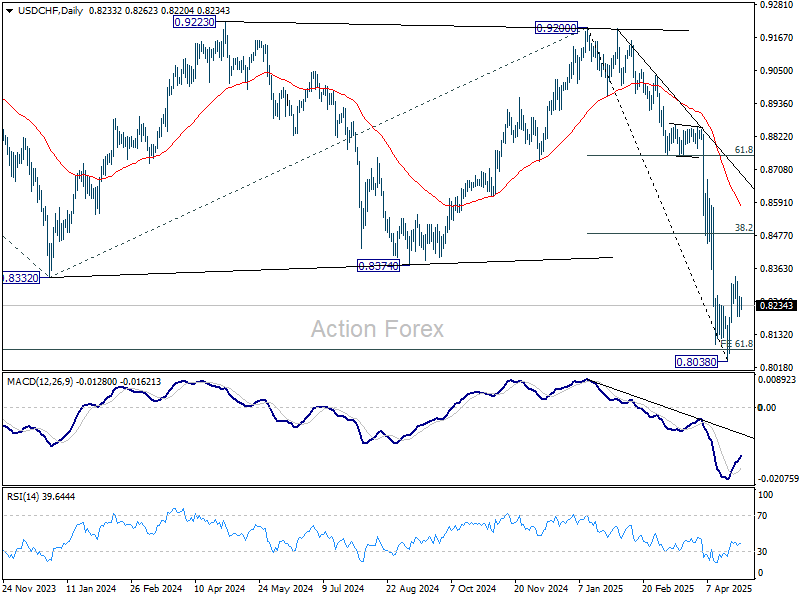
In the bigger picture, long term down trend from 1.0342 (2017 high) is still in progress and met 61.8% projection of 1.0146 (2022 high) to 0.8332 from 0.9200 at 0.8079 already. In any case, outlook will stay bearish as long as 55 W EMA (now at 0.8783) holds. Sustained break of 0.8079 will target 100% projection at 0.7382.
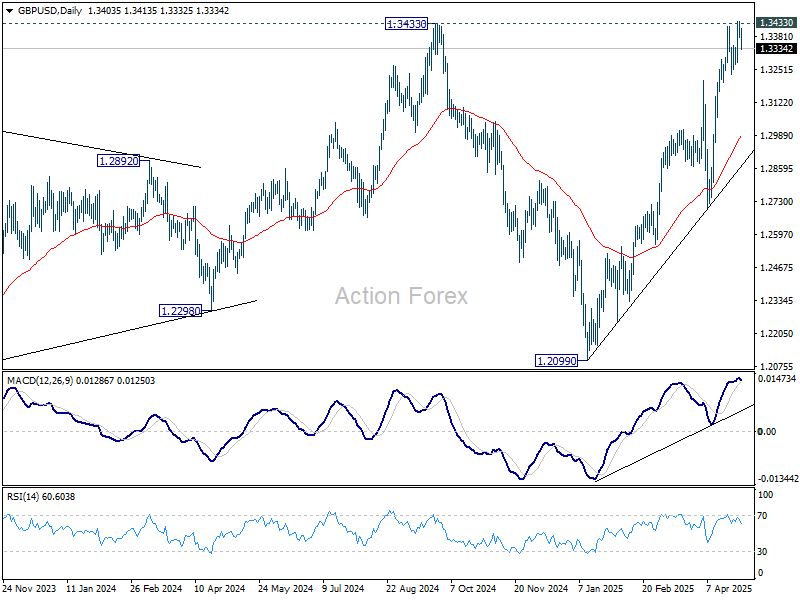
GBP/USD Mid-Day Outlook
Daily Pivots: (S1) 1.3377; (P) 1.3411; (R1) 1.3440; More...
Intraday bias in GBP/USD is turned neutral first with current retreat. On the upside, firm break of 1.3433 key resistance confirm larger up trend resumption. However, break of 1.3232 support will indicate rejection from 1.3433, and bring deeper decline back to 55 D EMA (now at 1.2993) and possibly below.
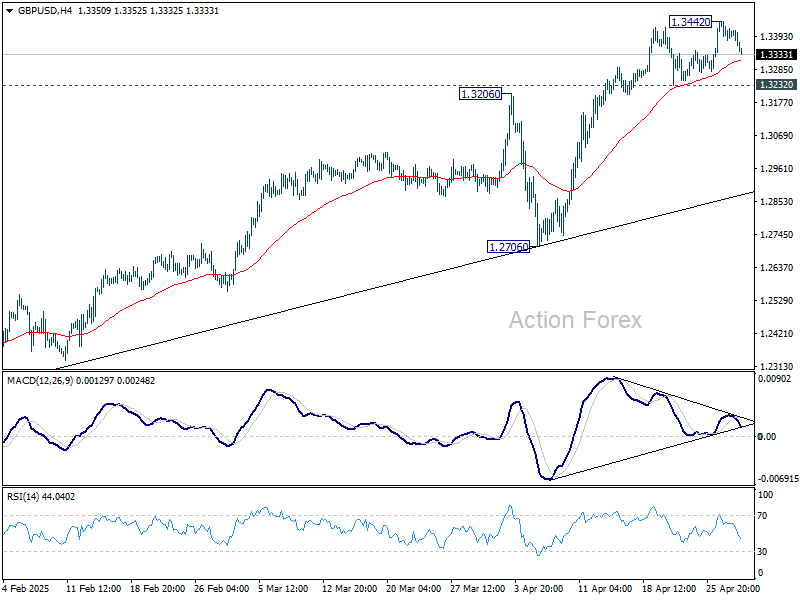
In the bigger picture, price actions from 1.3433 are seen as a corrective pattern to the up trend from 1.3051 (2022 low). Rise from 1.2099 could either be resuming the up trend, or the second leg of a consolidation pattern. Overall, GBP/USD should target 1.4248 key resistance (2021 high) on break of 1.3433 at a later stage.