Sample Category Title
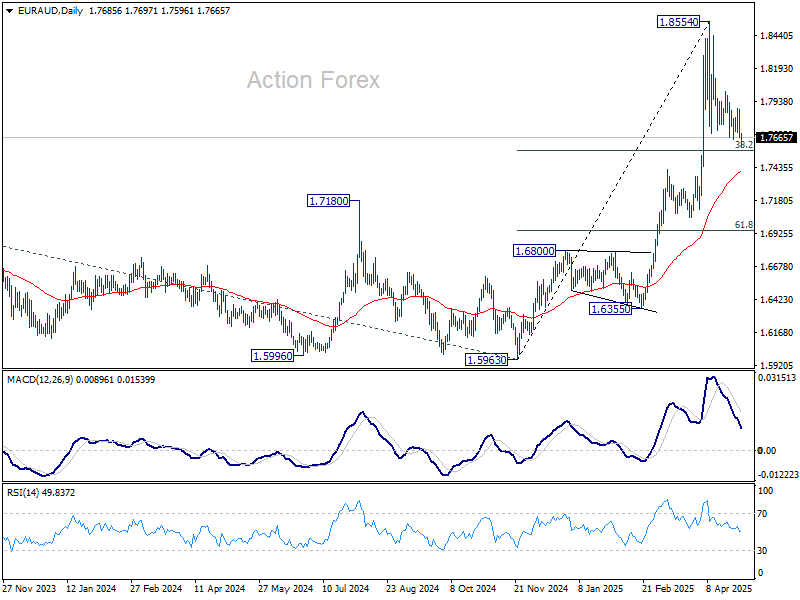
EUR/AUD Daily Outlook
Daily Pivots: (S1) 1.7616; (P) 1.7750; (R1) 1.7828; More...
Intraday bias in EUR/AUD remains neutral at this point. Corrective pattern from 1.8554 could extend, but downside should be contained by 38.2% retracement of 1.5963 to 1.8854 at 1.7750. On the upside, above 1.8014 minor resistance will bring retest of 1.8554 first. Firm break there will resume larger up trend. However, firm break of 1.7750 will bring deeper fall to 55 D EMA (now at 1.7399) and possibly below.
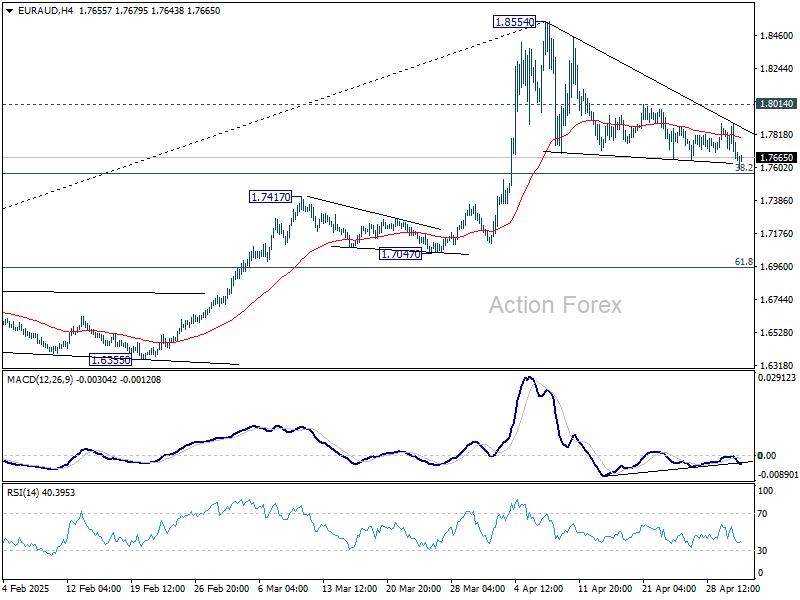
In the bigger picture, up trend from 1.4281 (2022 low) is in progress for 100% projection of 1.4281 to 1.7062 from 1.5963 at 1.8744. Firm break there will pave the way to 138.2% projection at 1.9806, which is close to 1.9799 (2020 high). Outlook will remain bullish as long as 1.7062 resistance turned support (2023 high) holds even in case of deep pullback.
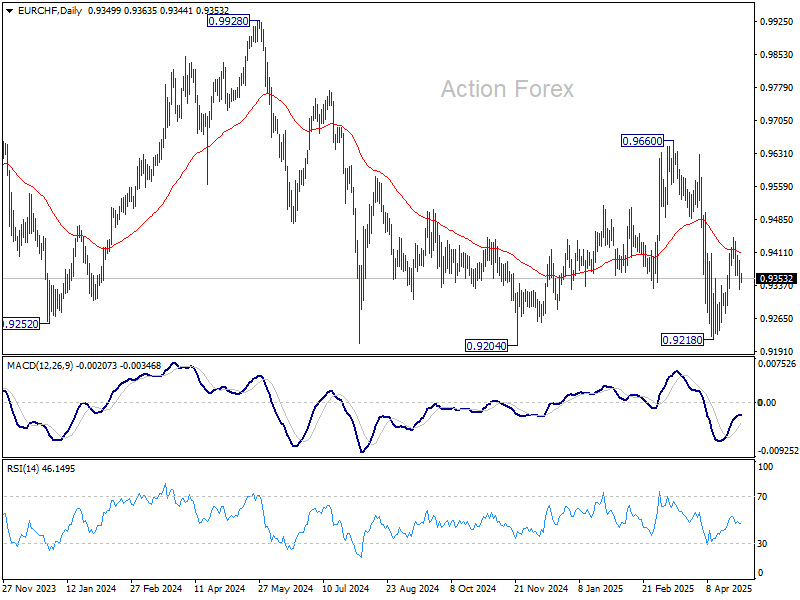
EUR/CHF Daily Outlook
Daily Pivots: (S1) 0.9330; (P) 0.9362; (R1) 0.9395; More....
Intraday bias in EUR/CHF remains neutral neutral for the moment. Rebound from 0.9218 is either a corrective move, or the third leg of the pattern from 0.9204. Break of 0.9445 will resume the rebound towards 0.9660 resistance. However, on the downside, break of 0.9336 will bring retest of 0.9204/18 support zone.
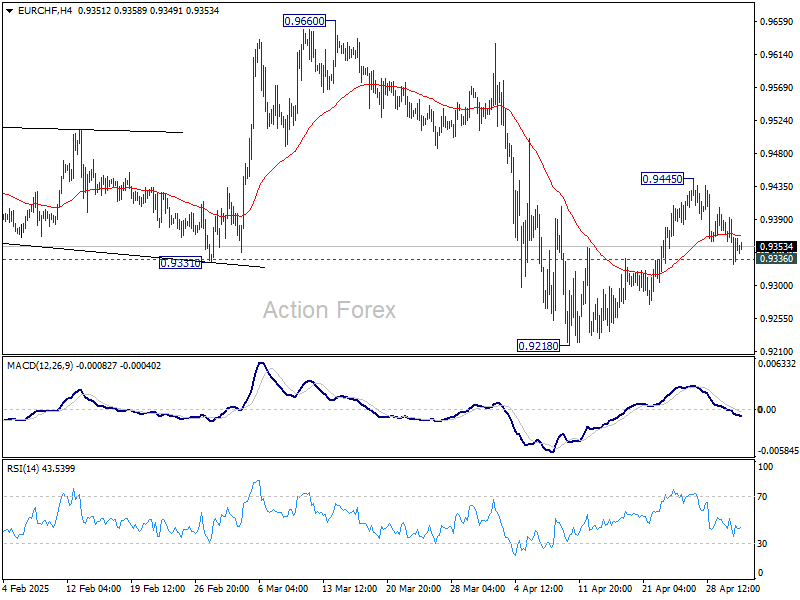
In the bigger picture, prior rejection by long-term falling channel resistance (now at 0.9555) retains medium term bearishness. That is, down trend from 1.2004 (2018 high) is still in progress. Firm break of 0.9204 (2024 low) will confirm resumption. This will remain the favored case as long as 0.9660 resistance holds.
Meta, Microsoft Shine Through Trade Fog
Market sentiment has improved following a deluge of data and earnings announcements on both sides of the Atlantic. In Europe, CPI updates from major eurozone economies came in stronger than expected, raising questions about the European Central Bank’s (ECB) ability—or immediate need—to continue cutting rates. The eurozone economy grew by 0.4% in Q1 - dim compared to the US growth figures, but it’s twice as fast as expected. Combined with eurozone countries’ pledges to spend heavily on defense and security, it suggests that part of the growth loss due to the tariff war could be counterbalanced by higher government spending. Growing through government spending is not ideal, but it may explain the Q1 GDP beat. Still, the EURUSD’s decline despite stronger-than-expected inflation data makes sense if we consider that falling inflation and dovish ECB expectations were major drivers of the euro’s rally against the dollar this year. However, the diverging growth outlook between the eurozone and the US - though mostly priced in - should limit downside corrections in EURUSD. Pullbacks could offer opportunities to strengthen long euro positions. The medium-term bullish trend remains intact above 1.1025 (the major 38.2% retracement distinguishing trend from consolidation).
Back to the diverging growth story: US GDP sharply fell in Q1 (surprise!). The US economy contracted by 0.3% in the first quarter, down from 2.4% in the prior quarter, just before Donald Trump took office again. Sales tumbled 2.5%, down from 3.3%, while a core inflation gauge jumped from 2.6% to 3.5% - well above the 3.1% expected. The ADP report confirmed that jobs are being lost faster than forecast.
In short: US growth contracted and inflation accelerated in Q1. That’s the worst possible combination of data. Not only could the US be heading for a recession, but stagflation may be knocking on the door. That’s why the S&P500 initially dropped 2% after the release - compounded by a wave of cautious earnings statements and companies’ reluctance to provide forecasts amid the uncertain trade backdrop.
Thankfully, the core PCE data - the Federal Reserve’s (Fed) preferred inflation gauge - came in line with expectations year-over-year and was flat month-on-month, helping cool bearish momentum. The S&P500 rebounded to close 0.15% higher on hopes the Fed could cut rates sooner rather than later to support the tariff-hit economy. But should the Fed act, knowing inflation could spike in coming months due to tariff-driven price jumps? Trump himself said kids might end up with “2 dolls instead of 30—and those two could cost a couple bucks more.” But how much more—and for how long?
For now, the declining US 2-year yield suggests that part of the stock rebound is being driven by rising expectations of deeper Fed cuts. The 2-year yield briefly slipped below 2.60% yesterday, down from nearly 4.40% at the start of the year. Meanwhile, the US dollar index marked its third consecutive daily gain. Still, Fed optimism is fragile and increasingly at risk if inflation heats up.
Elsewhere, the Bank of Japan (BoJ) left rates unchanged but slashed its growth forecasts for this year and next. It simultaneously released an updated CPI outlook of 1.9–2% for the next fiscal year, warning that inflation is likely to remain near target despite a slowing economy. This keeps BoJ rate hikes on the table despite growth worries. Interestingly, investors responded to the weaker GDP outlook by pushing the yen lower and lifting the Nikkei above its 50-day moving average—perhaps underestimating the hawkish risks.
The best for last
Let’s enjoy the ride while it lasts. Futures point toIpek a positive US open today, after both Meta and Microsoft posted stronger-than-expected earnings after the bell.
Microsoft’s cloud revenue grew by a third last quarter, confirming that AI demand remains robust despite oversupply concerns. Notably, Microsoft spent less last quarter—for the first time in a while—but that’s not the plan elsewhere.
Meta not only delivered strong sales and advertising revenue (boosted by AI), but also raised its full-year spending plans from $60–65bn to $64–72bn. That’s exactly what AI investors wanted to hear. Both Meta and Microsoft shares jumped in after-hours trading—5.3% and 7%, respectively.
Apple and Amazon report after the bell today and will need to convince investors they can weather US tariffs. Apple has already announced plans to move some production from China to India and to the US. Trump backed off his plan to tax smartphones, after warnings that US-made iPhones could cost up to $3000. Still, Apple remains one of the most tariff-exposed Big Tech names, given its complex global supply chain and lagging AI progress.
Amazon, also highly exposed to tariffs, will likely see its e-commerce revenue pressured by tariffs. Morgan Stanley analysts estimate that 18% of products on Amazon are imported from China, and around 60% of third-party sellers have ‘some China exposure’ that could impact ad spend. But Amazon has cards to play. Its cloud business gives it a stake in the AI race. And the company just launched 27 Kuiper satellites to provide Starlink-style internet to consumers and businesses. From a valuation perspective, Amazon is sitting on its long-term price target—strong earnings could tempt buyers despite the choppy macro environment.
US GDP Contracts for the First Time in Three Years
In focus today
Today is a quieter day in terms of releases due to International Workers' Day, which is a public holiday in many European countries.
In the US, the April ISM Manufacturing index is due for release in the afternoon. The regional Fed manufacturing surveys are pointing towards a clear decline as earlier front-loading of orders appears to have slowed down when the sharp tariff hikes were announced in early April.
Economic and market news
What happened overnight
In Japan, the Bank of Japan (BoJ) kept rates unchanged this morning as widely expected. At the same time, the central bank cut the outlook for growth by 0.6pp in the fiscal year (FY)2025 and 0.3pp in FY2026, blaming the trade war. Also, inflation forecasts have been cut by 0.2pp to 2.2% for FY2025 and 0.3pp for FY2026 to 1.7%. The new FY2027 forecast is 1.9%.
The policy statement is extremely short and there is no mention that the BoJ still expects to hike rates further down the road. That is perhaps also why USD/JPY traded quite a bit higher from 143.1 to 143.7 levels and JGB yields traded lower on the back of the decision. The BoJ needs to walk a fine line these days, postponing further rate hikes because of the trade war uncertainty but still sounding hawkish enough to not weaken the yen too much, which is not desirable during trade negotiations with the US. We will witness this balancing act at the press conference this morning.
With solid wage growth this year, reflating the economy is on track and thus we still believe the BoJ is ready to hike rates further. We expect the next hike in the fall with the timing of course largely depending on the outcome of the trade war.
What happened yesterday
In the US, GDP contracted 0.3% (forecast -0.1%, cons. +0.3%, Q4 +2.4%), which was fairly close to our expectations. Looking at the details, private consumption growth in services and non-durable goods held up well, while durable goods consumption declined. Net exports contributed negatively by 4.8pp due to import front-loading, with around half of this offset by rising inventories. Overall, while the headline growth number was negative, the underlying growth trend remained relatively solid. Quarterly PCE inflation and Employment Cost Index surprised to the upside, causing rates to tick slightly higher. The quarterly figures suggest that core services inflation momentum picked up towards the end of the quarter, which could be seen as modestly hawkish signal.
Also in the US, the ADP private sector employment report for April came in well below market expectations at 62k (cons: 115k, prior 155k). It was the softest increase since July of last year, highlighting the impact of tariffs by the US government on businesses' hiring of new labour, and giving the markets a first sense of what to expect from Friday's April Jobs Report.
In the euro area, GDP grew 0.4% q/q in Q1 2025, beating expectations of 0.2% q/q growth. The print was a "low" 0.4% as growth was 0.35% q/q, but it still shows that the euro area economy had a good start to the year by European growth standards. The first aggregate print does not provide details on the growth drivers, but country data shows that growth in the first quarter was once again held up by Spain, which rose 0.6% q/q, while France was weak at 0.1% q/q, Italy grew 0.3% q/q, and Germany activity rose 0.2% q/q.
Also in the euro area, French CPI inflation remained at 0.8% y/y in April, slightly above expectations of a decline to 0.7% y/y from 0.8% y/y in March. Energy inflation pulled inflation down, while core services and goods inflation were unchanged. In Germany, CPI inflation came in slightly higher than expected, in line with signals from regional data. The German CPI index declined to 2.1% y/y in April from 2.2% y/y in March, above expectations of a fall to 2.0% y/y. The decline was due to energy, food, and goods inflation. Overall, with data from France, Spain, and Germany data out, euro area inflation (out on Friday) is heading for a slightly higher reading in April than expected.
Equities: Equities rose yesterday, notably after a sharp intraday rebound, particularly towards the close of US cash trading. While the day ended with only modest gains, the scale and timing of the recovery was remarkable. Early in the session, equities were under pressure, partly due to unfavourable macroeconomic data, but political narratives remained the dominant driver throughout the day.
It is noteworthy that markets have now clawed back to levels seen before "Liberation Day" - prior to 2 April, when Trump reignited tariff rhetoric with aggressive reciprocal proposals. Since then, trade tensions between the US and China have escalated significantly. Meanwhile, bond markets - both at the front and long ends - have retraced, with short-term yields now sitting even lower than pre-Liberation Day levels. Similarly, implied volatilities in both equities (VIX) and rates (MOVE) have compressed back to those early-April levels.
One could rightly ask whether the world now looks better - or even remotely as good - as it did on 1 or 2 April. Objectively, that seems doubtful. Economists have aggressively slashed growth forecasts, earnings revisions have turned sharply negative, and despite the postponement of the reciprocal tariffs, US-China trade is operating at tariff levels effectively incompatible with meaningful exchange. In the US yesterday, Dow +0.4%, S&P 500 +0.2%, Nasdaq -0.1% and Russell 2000 -0.6%. This morning, Asian equity markets are mixed, but with a modest positive bias. The bigger story is in US equity futures, especially in tech, where strong aftermarket earnings yesterday have propelled futures higher.
FI & FX: The UST curve steepened modestly yesterday, led by front-end outperformance. The 2Y yield declined 6bp, while the 10Y fell 2bp and the 30Y rose 2bp, reflecting a front-led rally and some upward pressure further out the curve. The transatlantic spread narrowed slightly, as German Bunds outperformed across the curve. The 2Y Bund yield fell 6bp, while the 10Y declined 5bp, resulting in a mild bull steepening of the German curve. EUR/USD remains confined within the 1.13-1.14 range, as has been the case for most of the second half of April. Yesterday's economic data had little impact on the cross, and for now, the broader FX market appears relatively unresponsive to incoming releases. USD/JPY is trading nearly one figure higher this morning following the BoJ's widely expected decision to hold policy steady. With downward revisions to both growth and inflation forecasts, the overall message from the BoJ was dovish.
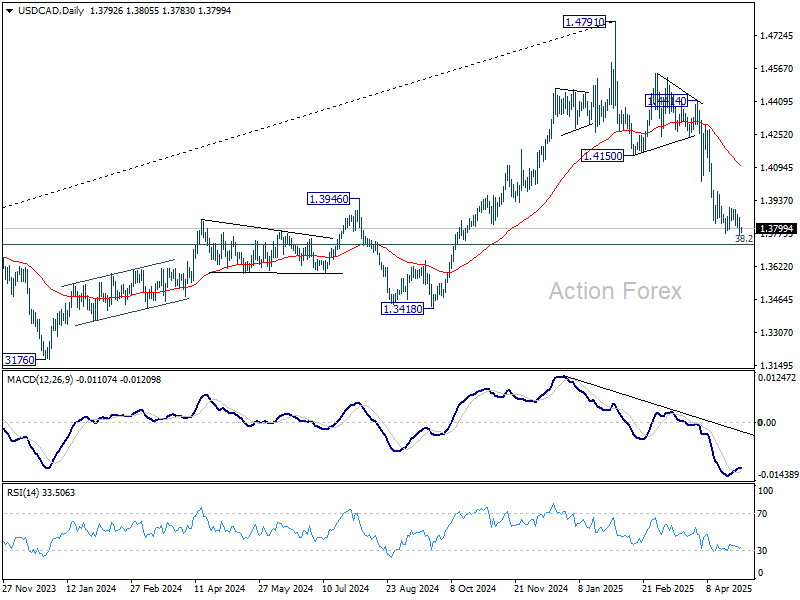
USD/CAD Daily Outlook
Daily Pivots: (S1) 1.3759; (P) 1.3809; (R1) 1.3847; More...
USD/CAD's breach of 1.3780 suggests that fall from 1.4791 is resuming. Intraday bias is back on the downside for 1.3727 fibonacci level next. On the upside, break of 1.3903 resistance is needed to indicate short term bottoming. Otherwise, outlook will stay bearish in case of recovery.
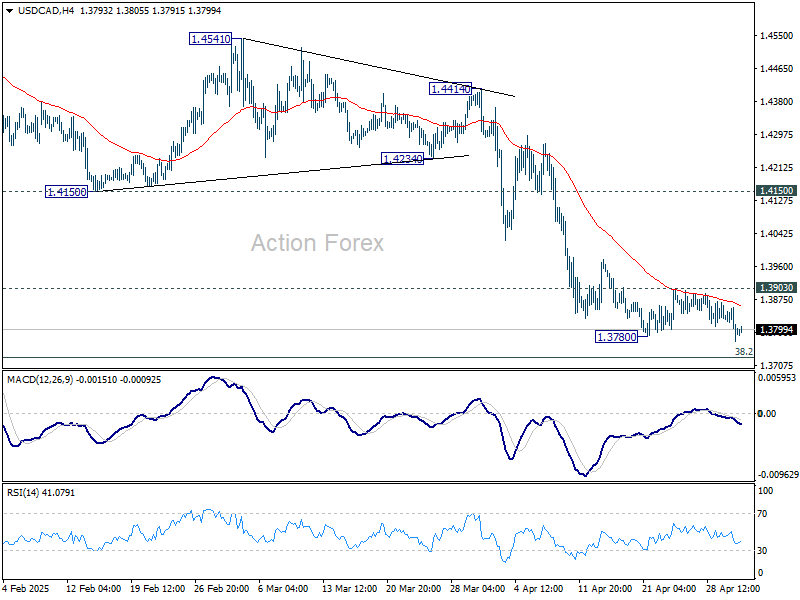
In the bigger picture, price actions from 1.4791 medium term top could either be a correction to rise from 1.2005 (2021 low), or trend reversal. In either case, further decline is expected as long as 1.4150 resistance turned support holds. Firm break of 38.2% retracement of 1.2005 (2021 low) to 1.4791 at 1.3727 will pave the way back to 61.8% retracement at 1.3069.
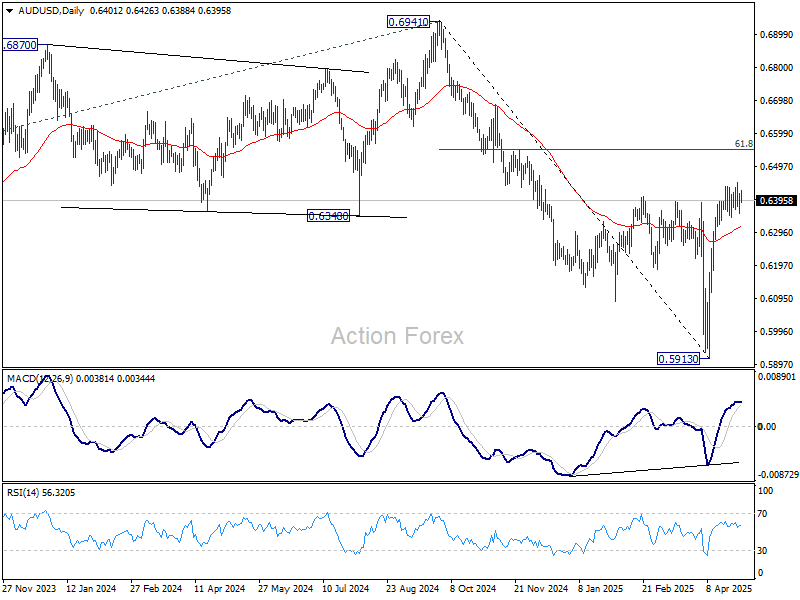
AUD/USD Daily Report
Daily Pivots: (S1) 0.6366; (P) 0.6392; (R1) 0.6428; More...
Range trading continues in AUD/USD and intraday bias stays neutral. On the upside, above 0.6448 will resume the rebound from 0.5913 to 61.8% retracement of 0.6941 to 0.5913 at 0.6548. However, firm break of 0.6343 support will confirm short term topping. Intraday bias will be turned back to the downside for 38.2% retracement of 0.5913 to 0.6448 at 0.6244.
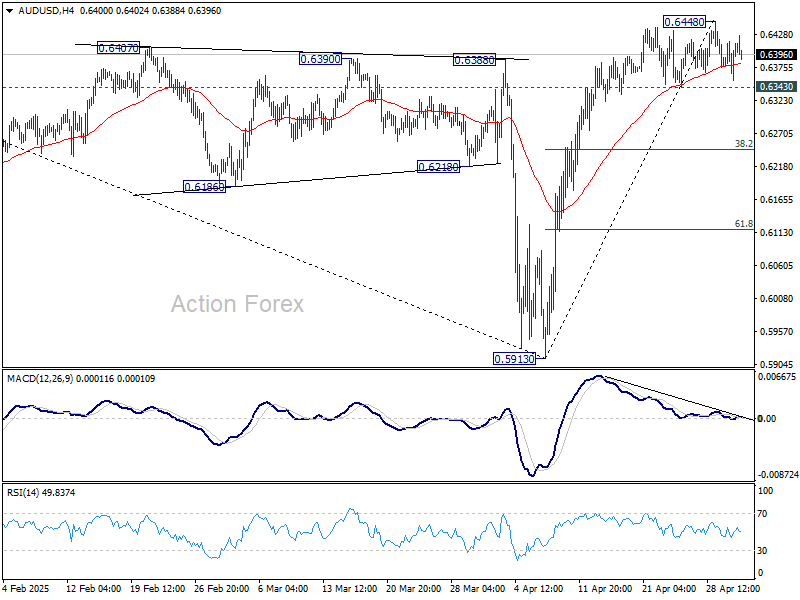
In the bigger picture, as long as 55 W EMA (now at 0.6440) holds, the down trend from 0.8006 (2021 high) should resume later to 61.8% projection of 0.8006 to 0.6169 from 0.6941 at 0.5806. However, sustained trading above 55 W EMA will argue that a medium term bottom was already formed, and set up further rebound to 0.6941 resistance instead.
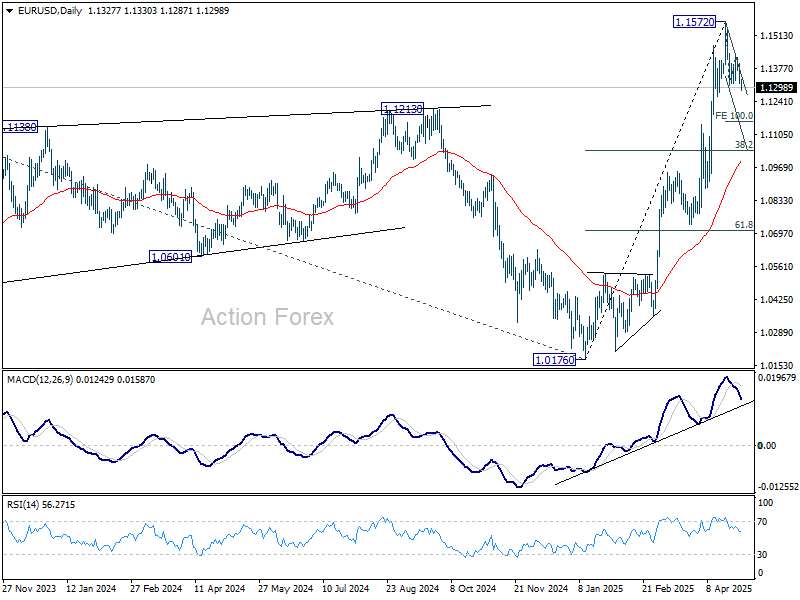
EUR/USD Daily Outlook
Daily Pivots: (S1) 1.1298; (P) 1.1349; (R1) 1.1381; More...
EUR/USD's fall from 1.1572 resumed by breaking through 1.1306 support. Intraday bias is back on the downside for 100% projection of 1.1572 to 1.1306 from 1.1424 at 1.1158. But downside should be contained by 38.2% retracement of 1.0176 to 1.1572 at 1.1039 to complete the correction. On the upside, break of 1.1424 will bring retest of 1.1572 high first.
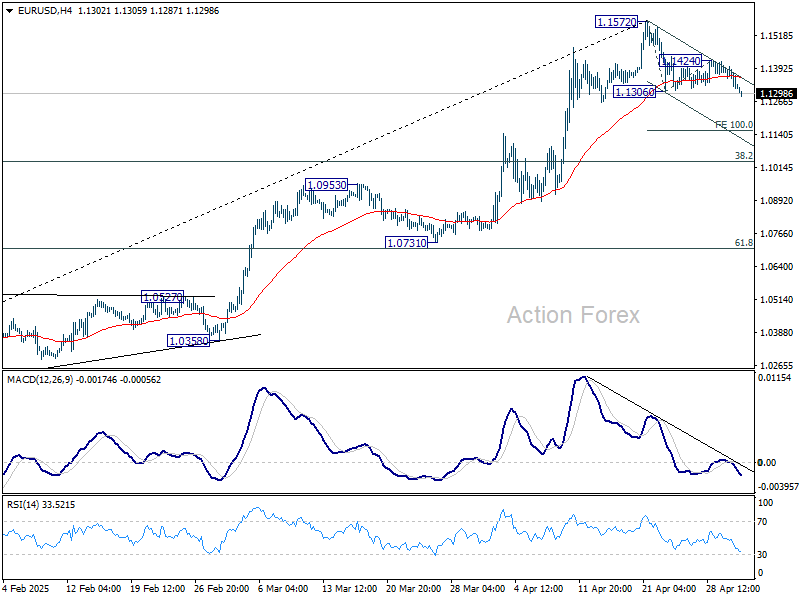
In the bigger picture, rise from 0.9534 long term bottom could be correcting the multi-decade downtrend or the start of a long term up trend. In either case, further rise should be seen to 100% projection of 0.9534 to 1.1274 from 1.0176 at 1.1916. This will now remain the favored case as long as 55 W EMA (now at 1.0792) holds.
GBP/USD Daily Outlook
Daily Pivots: (S1) 1.3288; (P) 1.3352; (R1) 1.3394; More...
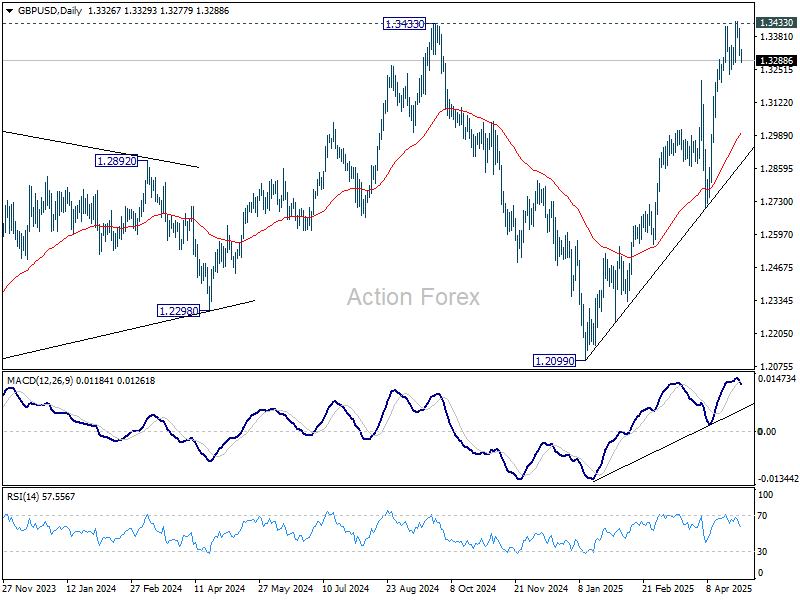
Intraday bias in GBP/USD remains neutral for the moment. On the downside, firm break of 1.3232 support will indicate short term topping and rejection by 1.3433 key resistance. Intraday bias will be back on the downside for deeper pullback to 55 D EMA (now at 1.3001) and possibly below. On the upside, firm break of 1.3433 key resistance confirm larger up trend resumption.
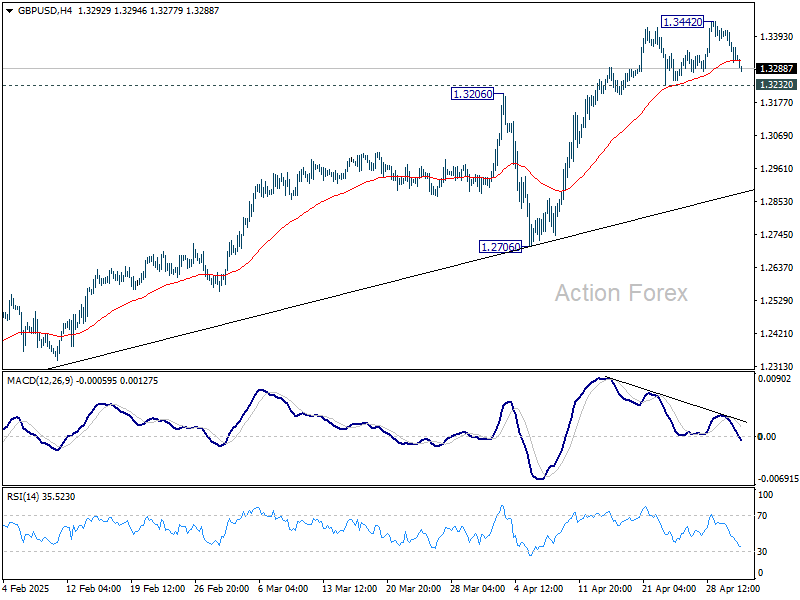
In the bigger picture, price actions from 1.3433 are seen as a corrective pattern to the up trend from 1.3051 (2022 low). Rise from 1.2099 could either be resuming the up trend, or the second leg of a consolidation pattern. Overall, GBP/USD should target 1.4248 key resistance (2021 high) on break of 1.3433 at a later stage.
USD/CHF Daily Outlook
Daily Pivots: (S1) 0.8228; (P) 0.8251; (R1) 0.8287; More….
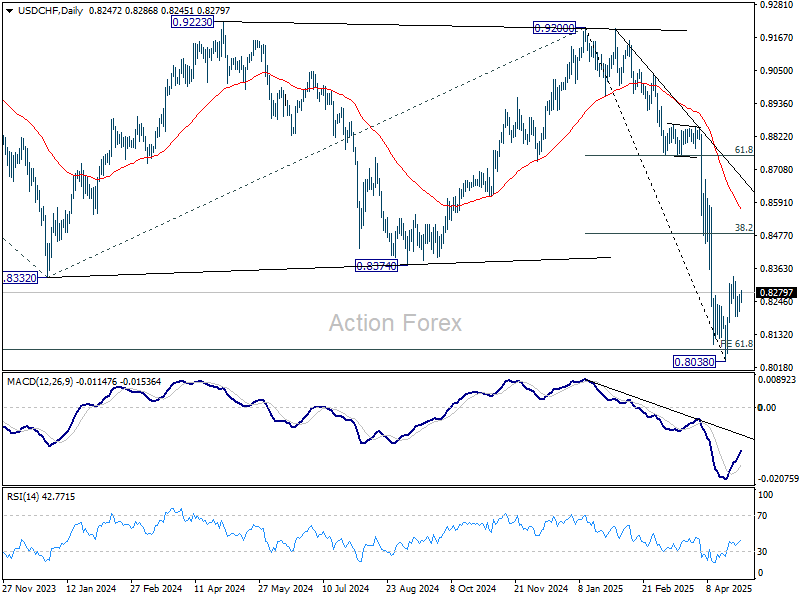
Intraday bias in USD/CHF remains neutral for the moment. On the upside, above 0.8333 will resume the rebound from 0.8038 short term bottom. But upside should be limited by 38.2% retracement of 0.9200 to 0.8038 at 0.8482. On the downside, below 0.8196 minor support will bring retest of 0.8038. Firm break there will resume larger down trend.
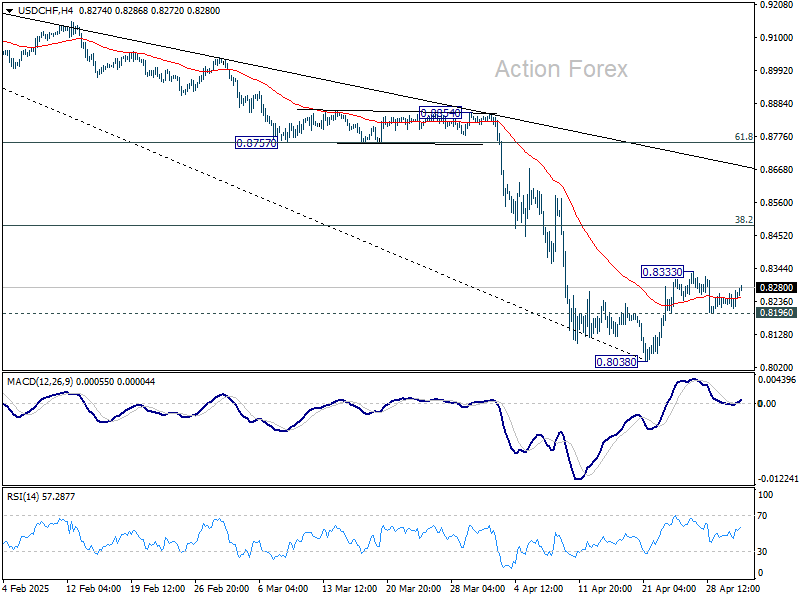
In the bigger picture, long term down trend from 1.0342 (2017 high) is still in progress and met 61.8% projection of 1.0146 (2022 high) to 0.8332 from 0.9200 at 0.8079 already. In any case, outlook will stay bearish as long as 55 W EMA (now at 0.8783) holds. Sustained break of 0.8079 will target 100% projection at 0.7382.
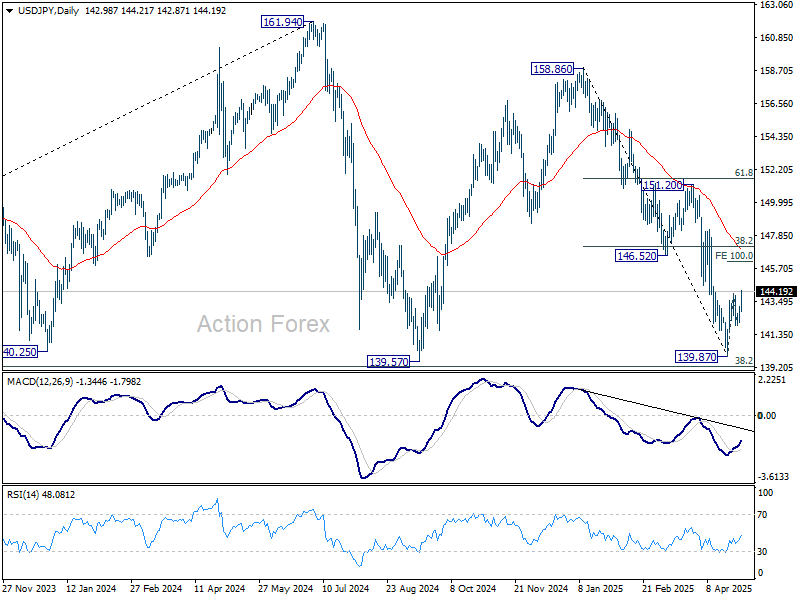
USD/JPY Daily Outlook
Daily Pivots: (S1) 142.42; (P) 142.81; (R1) 143.45; More...
USD/JPY's rebound from 139.87 short term bottom resumed by breaking through 144.02 today. Intraday bias is back on the upside for 100% projection of 139.87 to 144.02 from 141.96 at 146.11. But still, near term outlook will stay bearish as long as 38.2% retracement of 158.86 to 139.87 at 147.12 holds. On the downside, firm break of 141.96 will argue that the rebound has completed as a corrective move. Retest of 139.87 should then be seen next in this case.
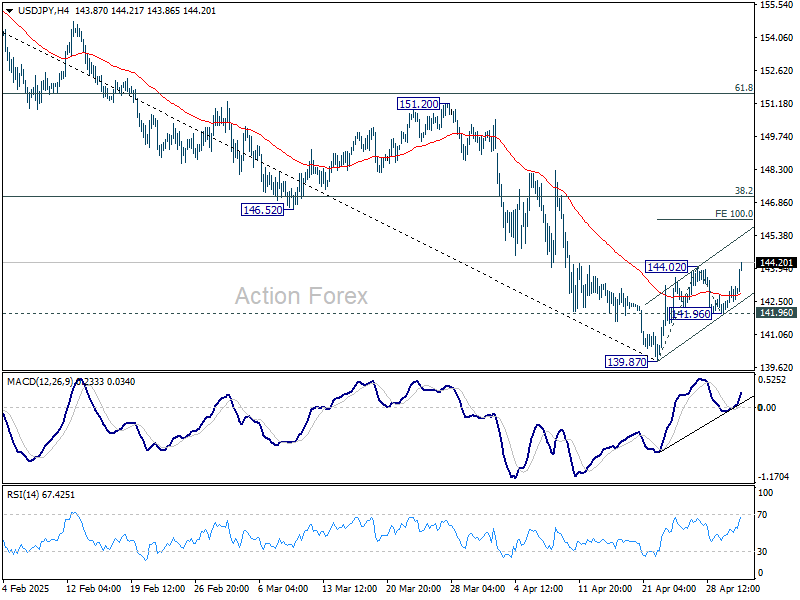
In the bigger picture, price actions from 161.94 are seen as a corrective pattern to rise from 102.58 (2021 low), with fall from 158.86 as the third leg. Strong support should be seen from 38.2% retracement of 102.58 to 161.94 at 139.26 to bring rebound. However, sustained break of 139.26 would open up deeper medium term decline to 61.8% retracement at 125.25.