
Sample Category Title
Bitcoin Wave Analysis
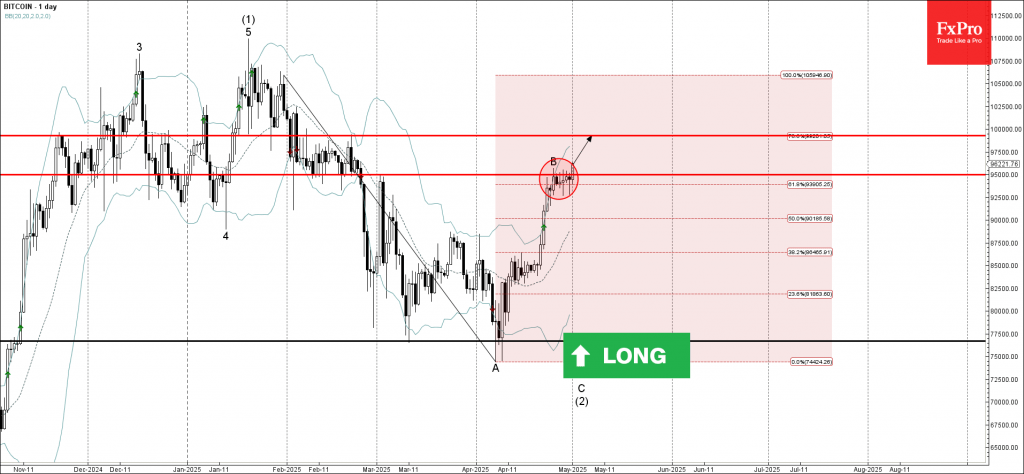
Bitcoin: ⬆️ Buy
- Bitcoin broke key resistance level 95000.00
- Likely to rise to resistance level 99300.00
Bitcoin cryptocurrency recently broke the resistance zone between the key resistance level 95000.00 (which stopped the previous wave B at the end of April) and the 61.8% Fibonacci correction of the downward impulse from January.
The breakout of this resistance zone should strengthen the bullish pressure on Bitcoin.
Bitcoin can be expected to rise to the next resistance level 99300.00, which reversed the price multiple times in February.
EURUSD Elliott Wave: Forming Double Three Pattern
Hello fellow traders. In this technical article we’re going to look at the Elliott Wave charts of EURUSD Forex pair published in members area of the website. As our members know, EUR/USD is undergoing a three-wave pullback against the March 26th low. Recently, we forecasted the decline in the pair following a three-wave bounce. In the following text, we’ll explain the Elliott Wave analysis and outline the target areas.
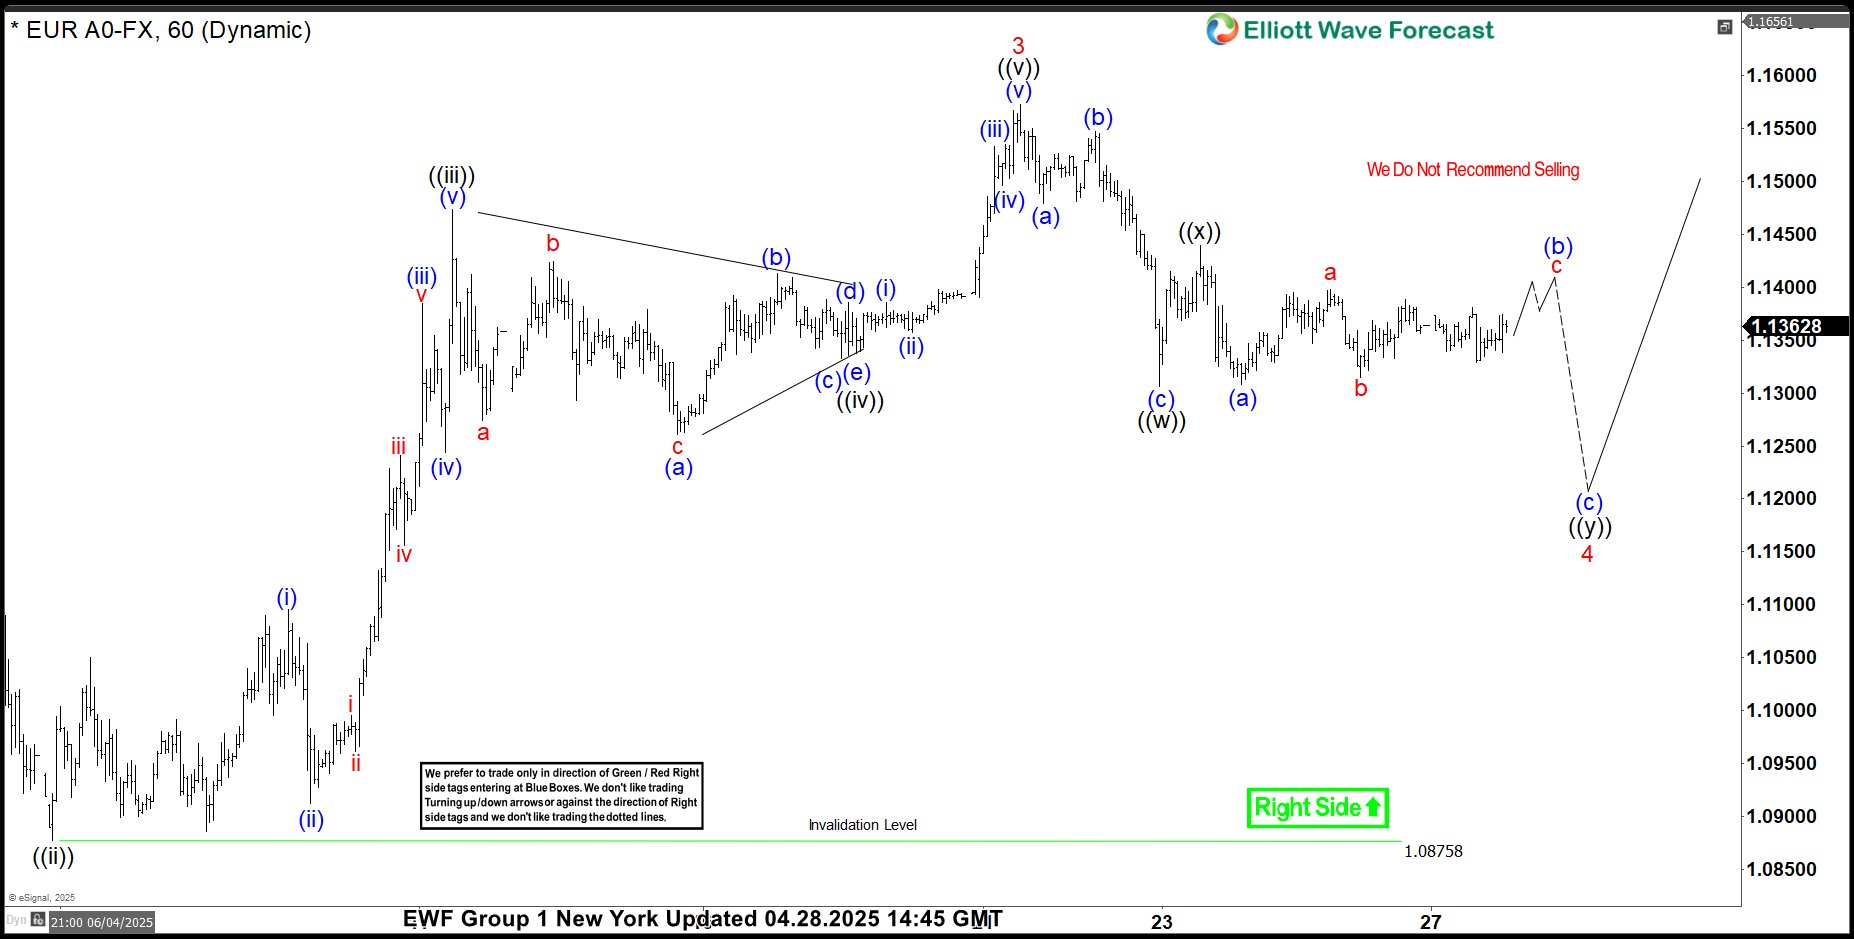
EURUSD Elliott Wave 1 Hour Chart 04.28.2025
The current view suggests that EUR/USD is correcting the cycle from the March 26th low. We count the ((x)) connector as completed at the 1.1444 high. While the price remains below that level, we expect to see another leg down to complete the wave 4 (red) correction.
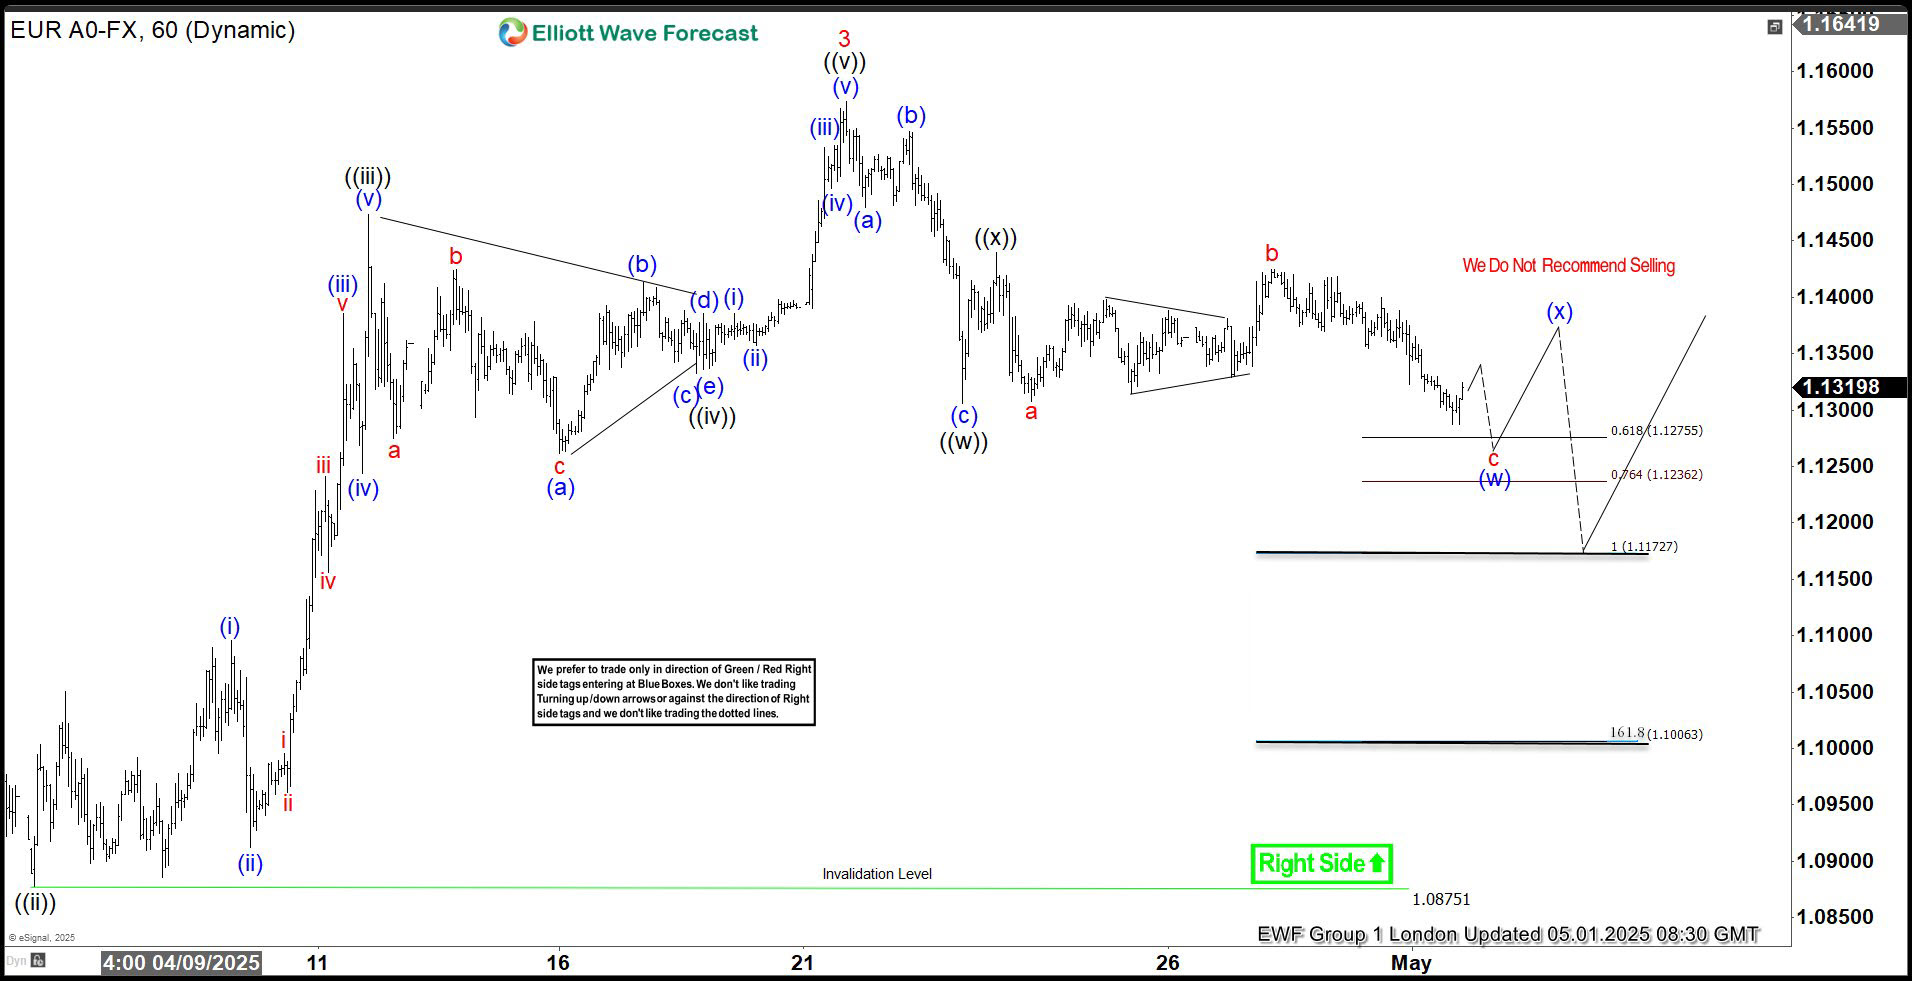
EURUSD Elliott Wave 1 Hour Chart 05.01.2025
The price held the 1.1444 peak and then declined. Eventually, it broke the previous low ((w)) black, confirming that the next leg down is in progress. The next technical zone comes in the 1.12755–1.1236 area, which might give us a three-wave bounce before the pair reaches the main target at the 1.11727 area (buyers zone).
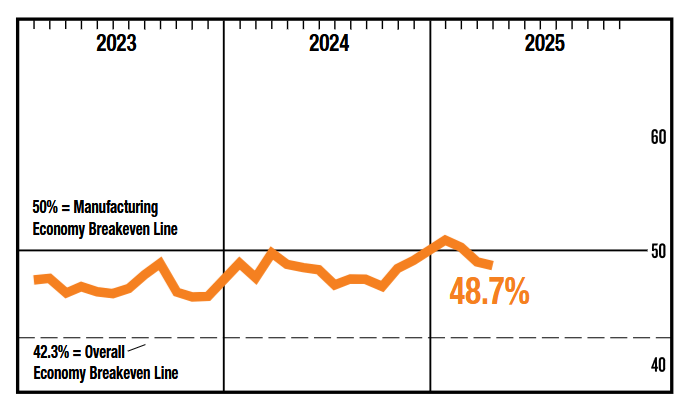
ISM Manufacturing Index Contracted in April, Marking Two Consecutive Months of Decline
The ISM Manufacturing Index declined slightly in April, to 48.7 from 49.0 in March.
Eleven of 18 industries reported growth for the month, up from nine in February. In another sign of slowing momentum, 41% of manufacturing GDP contracted in April, comparable to the 46% in March.
Demand conditions continued to be weak. The new orders index improved marginally but remains in contractionary territory (47.2, 45.2 in March), and new export order growth declined sharply further into contraction (43.1 vs 49.6 in March). The backlog of orders also shrank at a faster pace than in March (43.7 vs 44.5) and imports slid into contractionary territory.
Like new export orders, the production index tumbled further into contraction, falling to 44.0 from 48.3. This marks the second month in a row where the production index and the backlog of orders have both been in contractionary territory. Employment contracted at a slower pace than in March, ticking up to 46.5.
Price gains held steady at a high level after having accelerated in April, coming in at 69.8, compared to 69.4 in March (and 62.4 in February). The prices index is again at its highest level since June 2022.
Key Implications
Respondents are indicating there is disruption to their operations from tariffs, both in the form of rising costs, delays in border crossings, and a lack of clarity on exactly what duties are owed. While last month it seemed that we were heading toward a significant inventory build to get ahead of tariffs, it seems that now tariffs are in place, the build in inventories has slowed, and is mirrored in lower production and lower demand.
We are only one short month into the current tariff environment, and it remains uncertain how long these tariffs will be in place. Notably, the 145 percent tariffs on China were cited as disruptive, paralyzing, and inflationary. But for all that has changed, this month's report was very similar to last month's. The big difference is that we are seeing weak demand and price pressures now accompanied by evidence of production declines – in other words, the manufacturing sector is experiencing stagflation.
EUR/USD Mid-Day Outlook
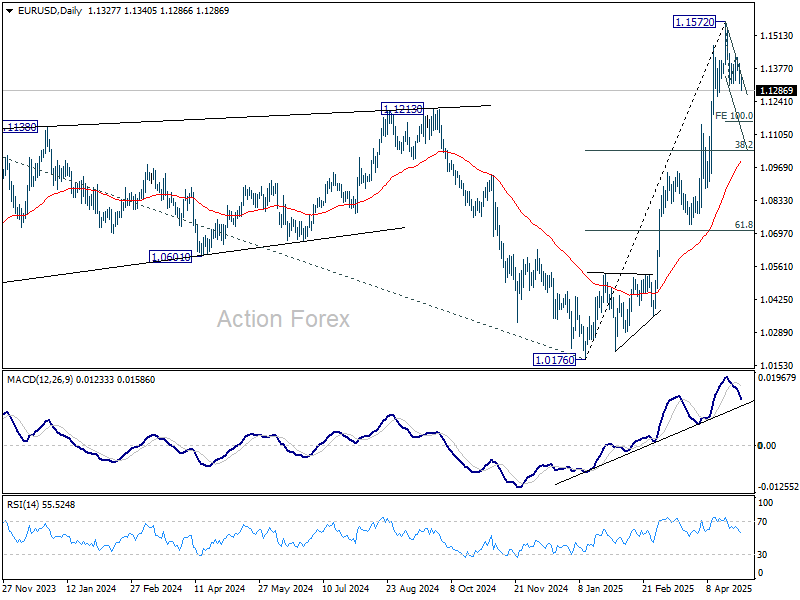
Daily Pivots: (S1) 1.1298; (P) 1.1349; (R1) 1.1381; More...
Intraday bias in EUR/USD stays on the downside for the moment. Correction from 1.1572 is in progress for 100% projection of 1.1572 to 1.1306 from 1.1424 at 1.1158. But downside should be contained by 38.2% retracement of 1.0176 to 1.1572 at 1.1039 to complete the correction. On the upside, break of 1.1424 will bring retest of 1.1572 high first.
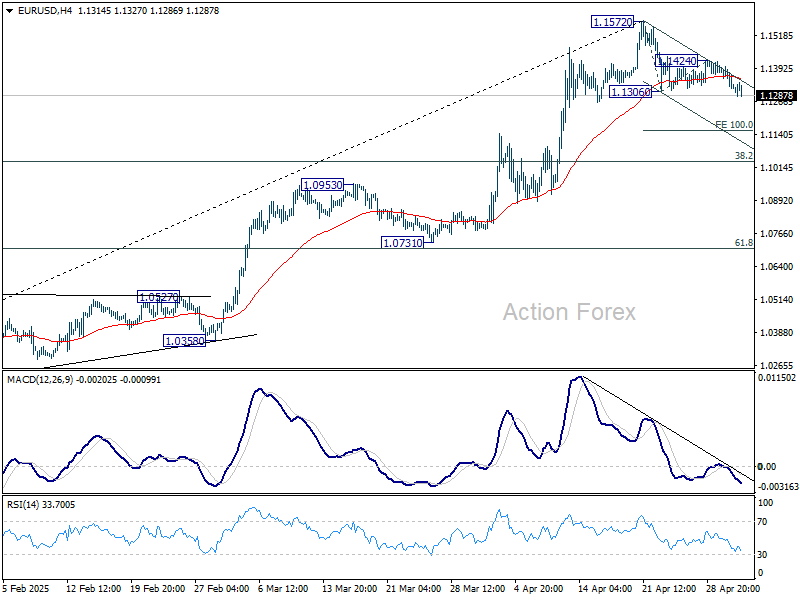
In the bigger picture, rise from 0.9534 long term bottom could be correcting the multi-decade downtrend or the start of a long term up trend. In either case, further rise should be seen to 100% projection of 0.9534 to 1.1274 from 1.0176 at 1.1916. This will now remain the favored case as long as 55 W EMA (now at 1.0792) holds.
GBP/USD Mid-Day Outlook
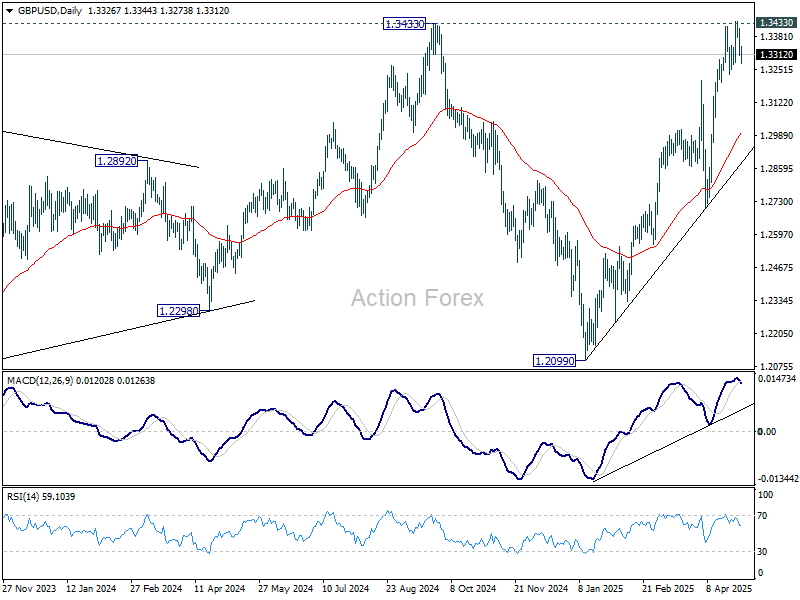
Daily Pivots: (S1) 1.3288; (P) 1.3352; (R1) 1.3394; More...
Outlook is GBP/USD remains unchanged and intraday bias stays neutral. On the downside, firm break of 1.3232 support will indicate short term topping and rejection by 1.3433 key resistance. Intraday bias will be back on the downside for deeper pullback to 55 D EMA (now at 1.3001) and possibly below. On the upside, firm break of 1.3433 key resistance confirm larger up trend resumption.
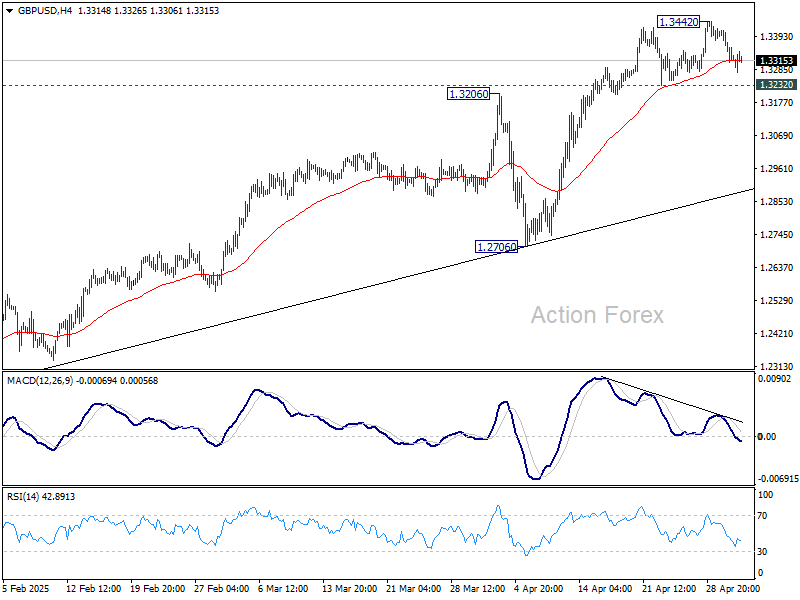
In the bigger picture, price actions from 1.3433 are seen as a corrective pattern to the up trend from 1.3051 (2022 low). Rise from 1.2099 could either be resuming the up trend, or the second leg of a consolidation pattern. Overall, GBP/USD should target 1.4248 key resistance (2021 high) on break of 1.3433 at a later stage.
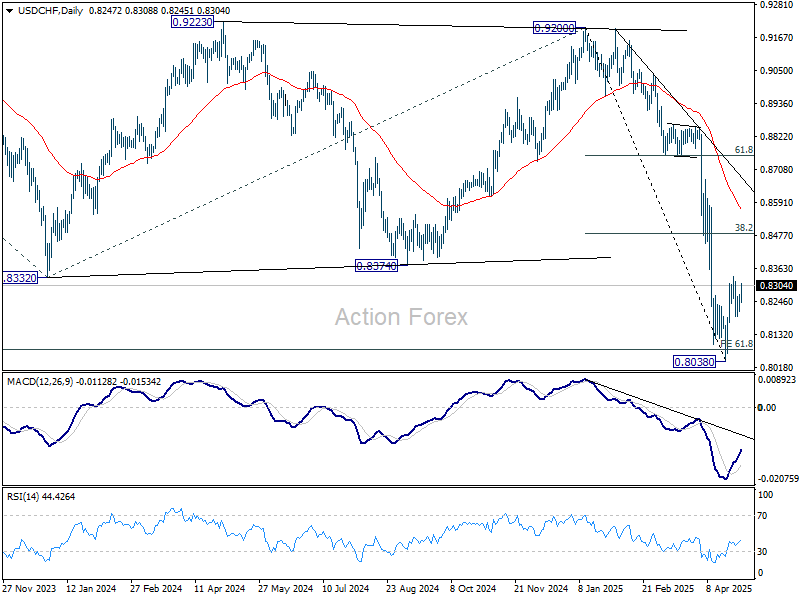
USD/CHF Mid-Day Outlook
Daily Pivots: (S1) 0.8228; (P) 0.8251; (R1) 0.8287; More….
No change in USD/CHF's outlook and intraday bias stays neutral. On the upside, above 0.8333 will resume the rebound from 0.8038 short term bottom. But upside should be limited by 38.2% retracement of 0.9200 to 0.8038 at 0.8482. On the downside, below 0.8196 minor support will bring retest of 0.8038. Firm break there will resume larger down trend.
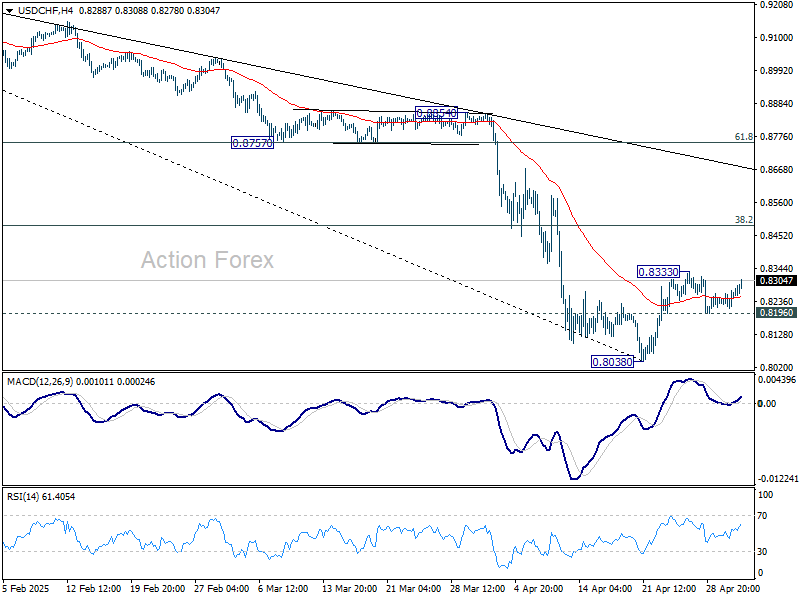
In the bigger picture, long term down trend from 1.0342 (2017 high) is still in progress and met 61.8% projection of 1.0146 (2022 high) to 0.8332 from 0.9200 at 0.8079 already. In any case, outlook will stay bearish as long as 55 W EMA (now at 0.8783) holds. Sustained break of 0.8079 will target 100% projection at 0.7382.
US ISM manufacturing falls less than expected to 48.7, output drops, prices climb further
US ISM Manufacturing PMI edged lower from 49.0 to 48.7 in April, slightly better than expectations of 47.9, but still firmly in contraction territory.
The report paints a mixed picture beneath the headline: new orders improved modestly from 45.2 to 47.2, signaling tentative stabilization in demand. But production dropped sharply from 48.3 to 44.0, marking the eighth straight month of contraction. Employment remained weak, rising only slightly from 44.7 to 46.5, with job losses continuing across the sector.
Export activity was a particular drag, with new export orders plunging from 49.6 to 43.1, reflecting growing external headwinds and perhaps early signs of tariff impacts. Imports also fell back into contraction, dipping from 50.1 to 47.1.
The rise in the Prices Index—from 69.4 to 69.8—marks the highest level since mid-2022 and reflects growing cost pressures, especially from tariffs, which are now being passed through to buyers amid longer supplier delivery times and rising inventories.
According to ISM, the overall backdrop suggests weakening demand and output amid rising input costs, "not considered positive for economic growth. ISM estimates the current PMI level aligns with a modest 1.8% annualized GDP growth rate.
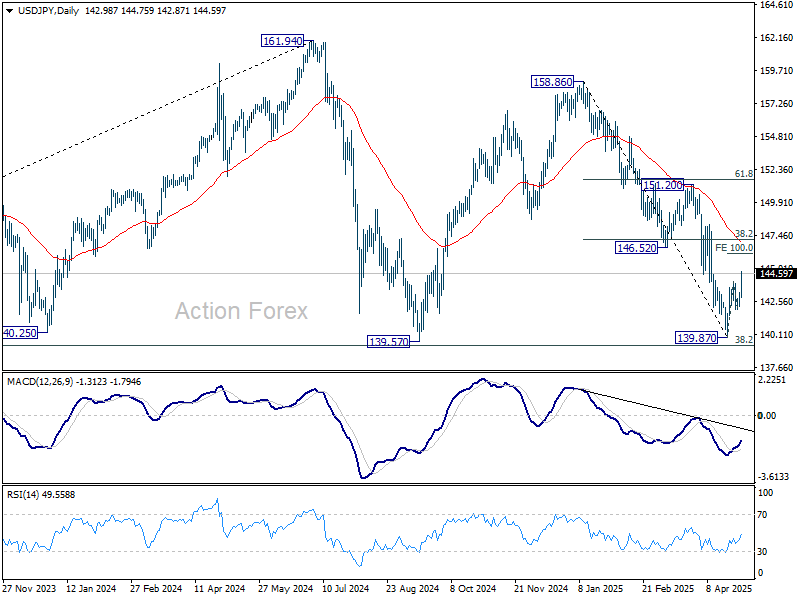
USD/JPY Mid-Day Outlook
Daily Pivots: (S1) 142.42; (P) 142.81; (R1) 143.45; More...
Intraday bias in USD/JPY remains on the upside for the moment. Rebound from 139.87 should target 100% projection of 139.87 to 144.02 from 141.96 at 146.11. But still, near term outlook will stay bearish as long as 38.2% retracement of 158.86 to 139.87 at 147.12 holds. On the downside, firm break of 141.96 will argue that the rebound has completed as a corrective move. Retest of 139.87 should then be seen next in this case.
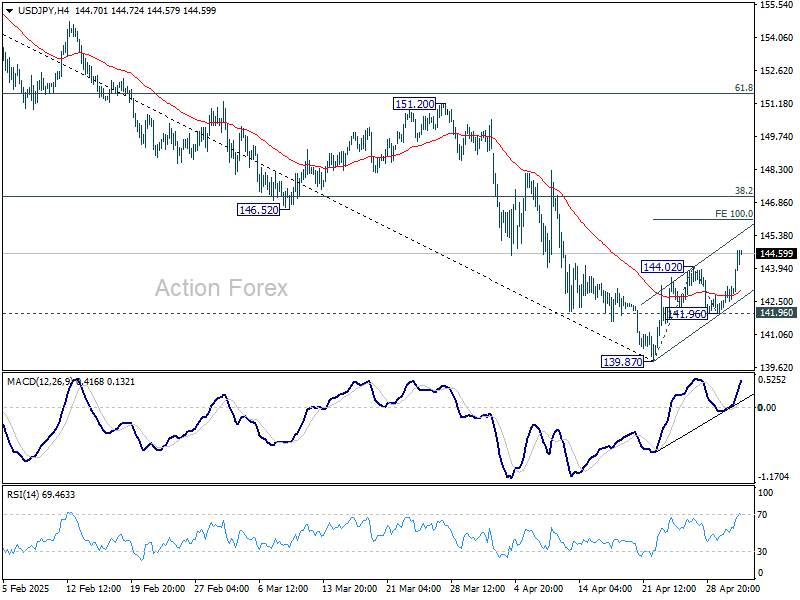
In the bigger picture, price actions from 161.94 are seen as a corrective pattern to rise from 102.58 (2021 low), with fall from 158.86 as the third leg. Strong support should be seen from 38.2% retracement of 102.58 to 161.94 at 139.26 to bring rebound. However, sustained break of 139.26 would open up deeper medium term decline to 61.8% retracement at 125.25.
FX Markets Hold Range While Yen Extends Slide
Yen weakness remains the dominant theme in an otherwise range-bound forex market today. While all other major pairs and crosses are contained within yesterday’s trading range, the Japanese currency continues to lose ground as traders react to BoJ’s dovish tone. Governor Kazuo Ueda attempted to soften the impact of the downgraded growth outlook and emphasized that a delay in inflation convergence wouldn’t necessarily mean a delay in rate hikes.
However, markets took greater note of his admission that the baseline scenario for Japan's economy “no longer has very high probability,” a statement that effectively resets expectations for near-term tightening. The prospect of a move in June has effectively diminished, and the odds for a Q3 hike now hinge heavily on how trade negotiations evolve between the US and its key partners, including Japan.
In the US, equity market sentiment is buoyant today as strong earnings from tech giants Meta Platforms and Microsoft lifted futures. Initial jobless claims rose more than expected, but the data has been largely brushed aside for now. Markets are instead turning attention to the upcoming ISM manufacturing report, which will offer more timely insights into how business activity and pricing dynamics are responding to the trade policy shockwaves. Still, the real litmus test for broader sentiment will be Friday’s non-farm payrolls release.
On the week, Kiwi leads losses for now, followed by Yen and Euro. Loonie outperforms, along with Sterling and Swiss Franc. Dollar and Aussie are treading water in the middle of the pack.
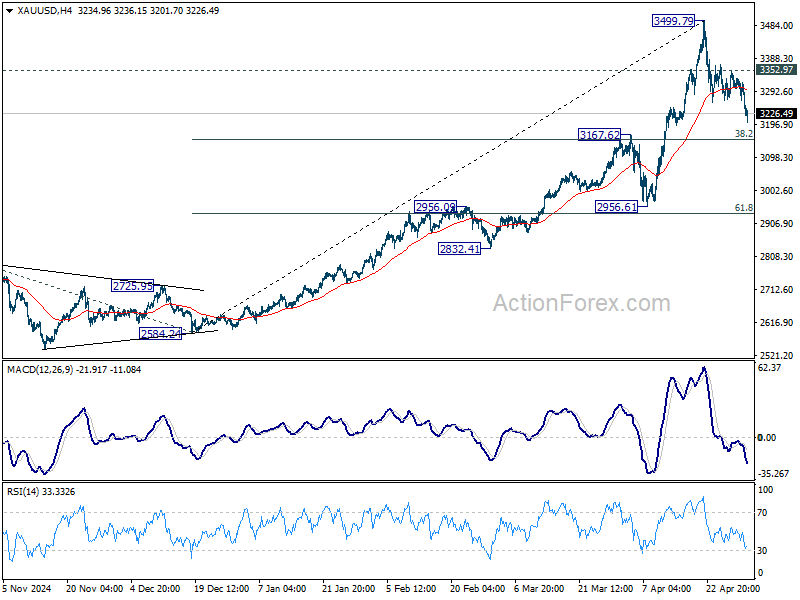
Technically. Gold's correction from 3499.79 extended lower today. Deeper fall might be seen, but downside should be contained by 3167.62 resistance turned support, which is close to 38.2% retracement of 2584.24 to 3499.79 at 3150.04. Break of 3352.92 resistance will bring retest of 3499.79 high.
 In Europe, at the time of writing, FTSE is down -0.13%. UK 10-year yield is down -0.01 at 4.436. Germany and France are on holiday. Earlier in Asia, Nikkei rose 1.13%. Japan 10-year JGB yield fell -0.04 to 1.275. Hong Kong, China, and Singapore were on holiday.
US initial jobless claims rise to 241k vs exp 221k
US initial jobless claims rose 18k to 241k in the week ending April 26, above expectation of 221k. Four-week moving average of initial claims rose 5.5k to 226k.
Continuing claims rose 83k to 1916k in the week ending April 19, highest since November 13, 2021. Four-week moving average of continuing claims rose 6k to 1868k.
UK PMI manufacturing finalized at 45.4, rising costs, declining demand
UK manufacturing continued to contract in April, with PMI finalized at 45.4, a modest rise from March’s 44.9.
The sector is facing mounting challenges as output, new orders, and exports all declined further. Business confidence also fell to its lowest level since late 2022, reflecting growing unease over global trade disruptions and rising input costs.
S&P Global’s Rob Dobson highlighted a nearly five-year record drop in new export orders, particularly from the US, Europe, and China.
Manufacturers are also being squeezed by a surge in purchase price inflation, now at a 28-month high. This is prompting firms to raise prices and cut discretionary spending, reinforcing a troubling mix of "rising costs, declining demand".
BoJ holds rates, slashes growth outlook on trade headwinds
BoJ kept its benchmark interest rate unchanged at 0.50% today, by unanimous vote, in line with expectations. However, it struck a cautious tone on the economic outlook by sharply cutting its growth forecasts.
The central bank now projects Japan’s real GDP to grow just 0.5% in fiscal 2025, down from the 1.1% forecast in January, and 0.7% in fiscal 2026 (downgraded from 1.0%). Growth is expected to recover to 1.0% in fiscal 2027, assuming stabilization in global conditions.
In its statement, BoJ acknowledged that “Japan's economic growth is likely to moderate” as global trade and policy uncertainty weigh on external demand and corporate profitability. Still, the bank expects activity to reaccelerate once overseas economies resume “a moderate growth path.”
On inflation, BoJ maintained that price pressures are broadly on course toward the 2% target, but revised its CPI core forecast down from 2.4% to 2.2% for fiscal 2025, and from 2.0% to 1.7% for fiscal 2026.
BoJ raised its projection for the core-core CPI from 2.1% to 2.3% for fiscal 2025, reflecting persistent domestic inflation pressures. However, this is followed by a downgrade from 2.1% to 1.8% in 2026 before stabilizing at 2.0% in 2027.
BoJ's Ueda: Inflation target delay won’t necessarily postpone rate hikes
At the post meeting press conference, BoJ Kazuo Ueda acknowledged that the surge in global trade tensions, sparked by the US's "reciprocal" tariffs, has sharply elevated uncertainty over global policy direction. He warned that these tariff shocks would "weigh on" on Japan’s growth and inflation in the near term, but expressed hope that such effects would fade as overseas economies stabilize.
Ueda noted that BoJ downgraded its growth outlook for fiscal 2025 and 2026, with both inflation and wage gains expected to "likely slow somewhat. However, he maintained that Japan’s "severe labour shortage" should keep the positive wage-inflation cycle intact over the medium term.
Despite pushing back the timeline for inflation to converge with the 2% target, Ueda stressed "that doesn't mean the timing of further rate hikes will automatically be delayed by the same margin."
Ueda emphasized that BoJ's forecasts hinge on the assumption that trade negotiations will progress and avoid serious supply chain disruptions. However, he admitted that the probability of the baseline scenario being realized "is no longer very high." Further tariff escalation could alter both the economic outlook and BoJ’s future policy stance.
Japan’s PMI manufacturing finalized at 48.7, slump persists amid trade uncertainty
Japan’s manufacturing sector remained in contractionary territory in April, with the final PMI reading at 48.7, up slightly from March’s 48.4. While the deterioration in business conditions marked the tenth consecutive month of decline, it remained modest.
However, underlying components revealed more concerning trends, with sharper drops in new orders and exports, highlighting persistent demand-side weakness.
According to S&P Global, firms responded by scaling back purchasing and adjusting inventories, while overall sentiment worsened.
Business confidence around future output fell to its lowest since mid-2020, as companies expressed caution amid ongoing global trade tensions and muted demand. Without a significant turnaround in both domestic and external demand, "firms are likely to struggle to see a recovery in conditions".
USD/JPY Mid-Day Outlook
Daily Pivots: (S1) 142.42; (P) 142.81; (R1) 143.45; More...
Intraday bias in USD/JPY remains on the upside for the moment. Rebound from 139.87 should target 100% projection of 139.87 to 144.02 from 141.96 at 146.11. But still, near term outlook will stay bearish as long as 38.2% retracement of 158.86 to 139.87 at 147.12 holds. On the downside, firm break of 141.96 will argue that the rebound has completed as a corrective move. Retest of 139.87 should then be seen next in this case.
In the bigger picture, price actions from 161.94 are seen as a corrective pattern to rise from 102.58 (2021 low), with fall from 158.86 as the third leg. Strong support should be seen from 38.2% retracement of 102.58 to 161.94 at 139.26 to bring rebound. However, sustained break of 139.26 would open up deeper medium term decline to 61.8% retracement at 125.25.