Sample Category Title
USD/CAD Daily Outlook
Daily Pivots: (S1) 1.3804; (P) 1.3834; (R1) 1.3883; More...
Intraday bias in USD/CAD is turned neutral again with current recovery. Deeper fall is expected as long as 1.3903 resistance holds. Below 1.3768 temporary low will resume the decline from 1.4791 to 1.3727 fibonacci level next. However, firm break of 1.3903 will indicate short term bottoming, and turn bias back to the upside for stronger rebound towards 55 D EMA (now at 1.4086).
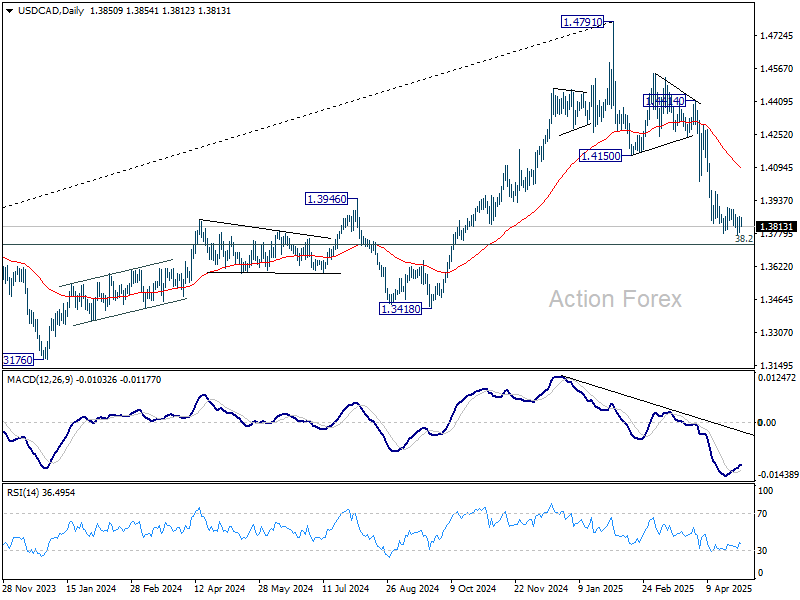
In the bigger picture, price actions from 1.4791 medium term top could either be a correction to rise from 1.2005 (2021 low), or trend reversal. In either case, further decline is expected as long as 1.4150 resistance turned support holds. Firm break of 38.2% retracement of 1.2005 (2021 low) to 1.4791 at 1.3727 will pave the way back to 61.8% retracement at 1.3069.
Markets Lifted by US-China Trade Thaw Hopes, But All Eyes on US Jobs Report
Markets trade on a cautiously optimistic in Asian session, supported by fresh signs that US-China trade tensions may be starting to thaw. China's Commerce Ministry said the US has repeatedly expressed interest in reopening negotiations, adding that Beijing is "evaluating" these overtures. This marks the most constructive public tone from Beijing since the US enacted sweeping tariffs in April, raising hopes that some form of de-escalation could follow.
US Treasury Secretary Scott Bessent and White House adviser Kevin Hassett both echoed this optimism. Hassett told CNBC there have been informal discussions across both governments, and China’s recent move to ease duties on select US goods was interpreted as a possible opening gesture.
Despite the improving geopolitical mood, FX markets remain directionless outside of continued weakness in Yen following BoJ’s dovish posture and downgraded growth forecasts. Kiwi and Euro are also under mild pressure, while commodity currencies like the Aussie and Loonie are faring better, alongside Sterling. Dollar and Swiss Franc are mixed in the middle. This price action hints at budding risk-on sentiment, but conviction is still lacking ahead of today’s key US jobs report.
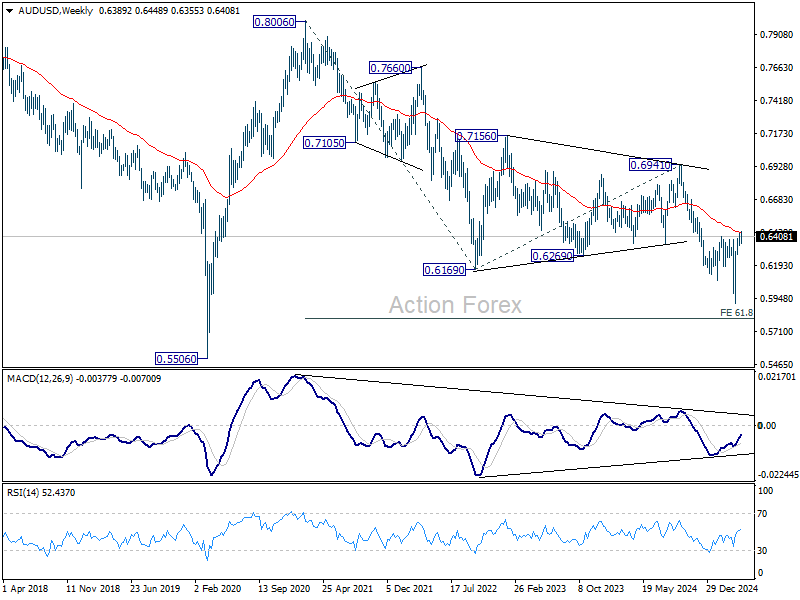
Technically, AUD/USD has been struggling in tight range for nearly two weeks already. The resistance from 55 W EMA is notable. Today's US job data might finally give a clear direction to AUD/USD. Sustained break of the 55 W EMA should confirm that medium term bottom was already formed at 0.5916 in early April, and stronger rally would then be seen towards 0.6941 resistance even as a corrective move. However, rejection by the 55 W EMA will retain bearishness for a break through 0.5916 sooner rather than later.
In Asia, at the time of writing, Nikkei is up 1.18%. Hong Kong HSI is up 1.72%. China is on holiday. Singapore Strait Times is up 0.36%. Japan 10-year JGB yield is down -0.009 at 1.266. Overnight, DOW rose 0.21%. S&P 500 rose 0.63%. NASDAQ rose 1.52%. 10-year yield rose 0.054 to 4.231.
Looking ahead, Eurozone CPI flash will be the major focus in European session. Eurozone unemployment rate and PMI manufacturing final, Swiss PMI manufacturing will be released. Later in the day, US non-farm payroll employment and factory orders will be published.
Downside risks to NFP after ADP miss and rising Claims
The US April non-farm payroll report today will serve as a critical barometer of the labor market’s resilience amid rising macroeconomic uncertainty. While the recent flip-flopping of reciprocal tariffs may not yet be fully reflected in the data, other indicators suggest growing fragility.
A notable miss in today’s report could reignite concerns about recession, particularly following this week's Q1 GDP data which showed unexpected contraction. For Fed, a disappointing jobs print would increase pressure to resume easing in June.
Markets expect 130K jobs growth in April, following a much stronger-than-expected 228K gain in March. Average hourly earnings are seen rising 0.3% mom. Unemployment rate likely held steady at 4.2%.
Recent labor market signals, however, lean toward downside risks. Initial jobless claims surged to 241K last week, pushing the 4-week average up to 226K. Meanwhile, ADP Employment report showed private payrolls rising by just 62K, a sharp deceleration from the revised 147K in March. The ISM Manufacturing PMI Employment sub-index also remained in contraction at 46.2, though it did tick up slightly from 44.7.
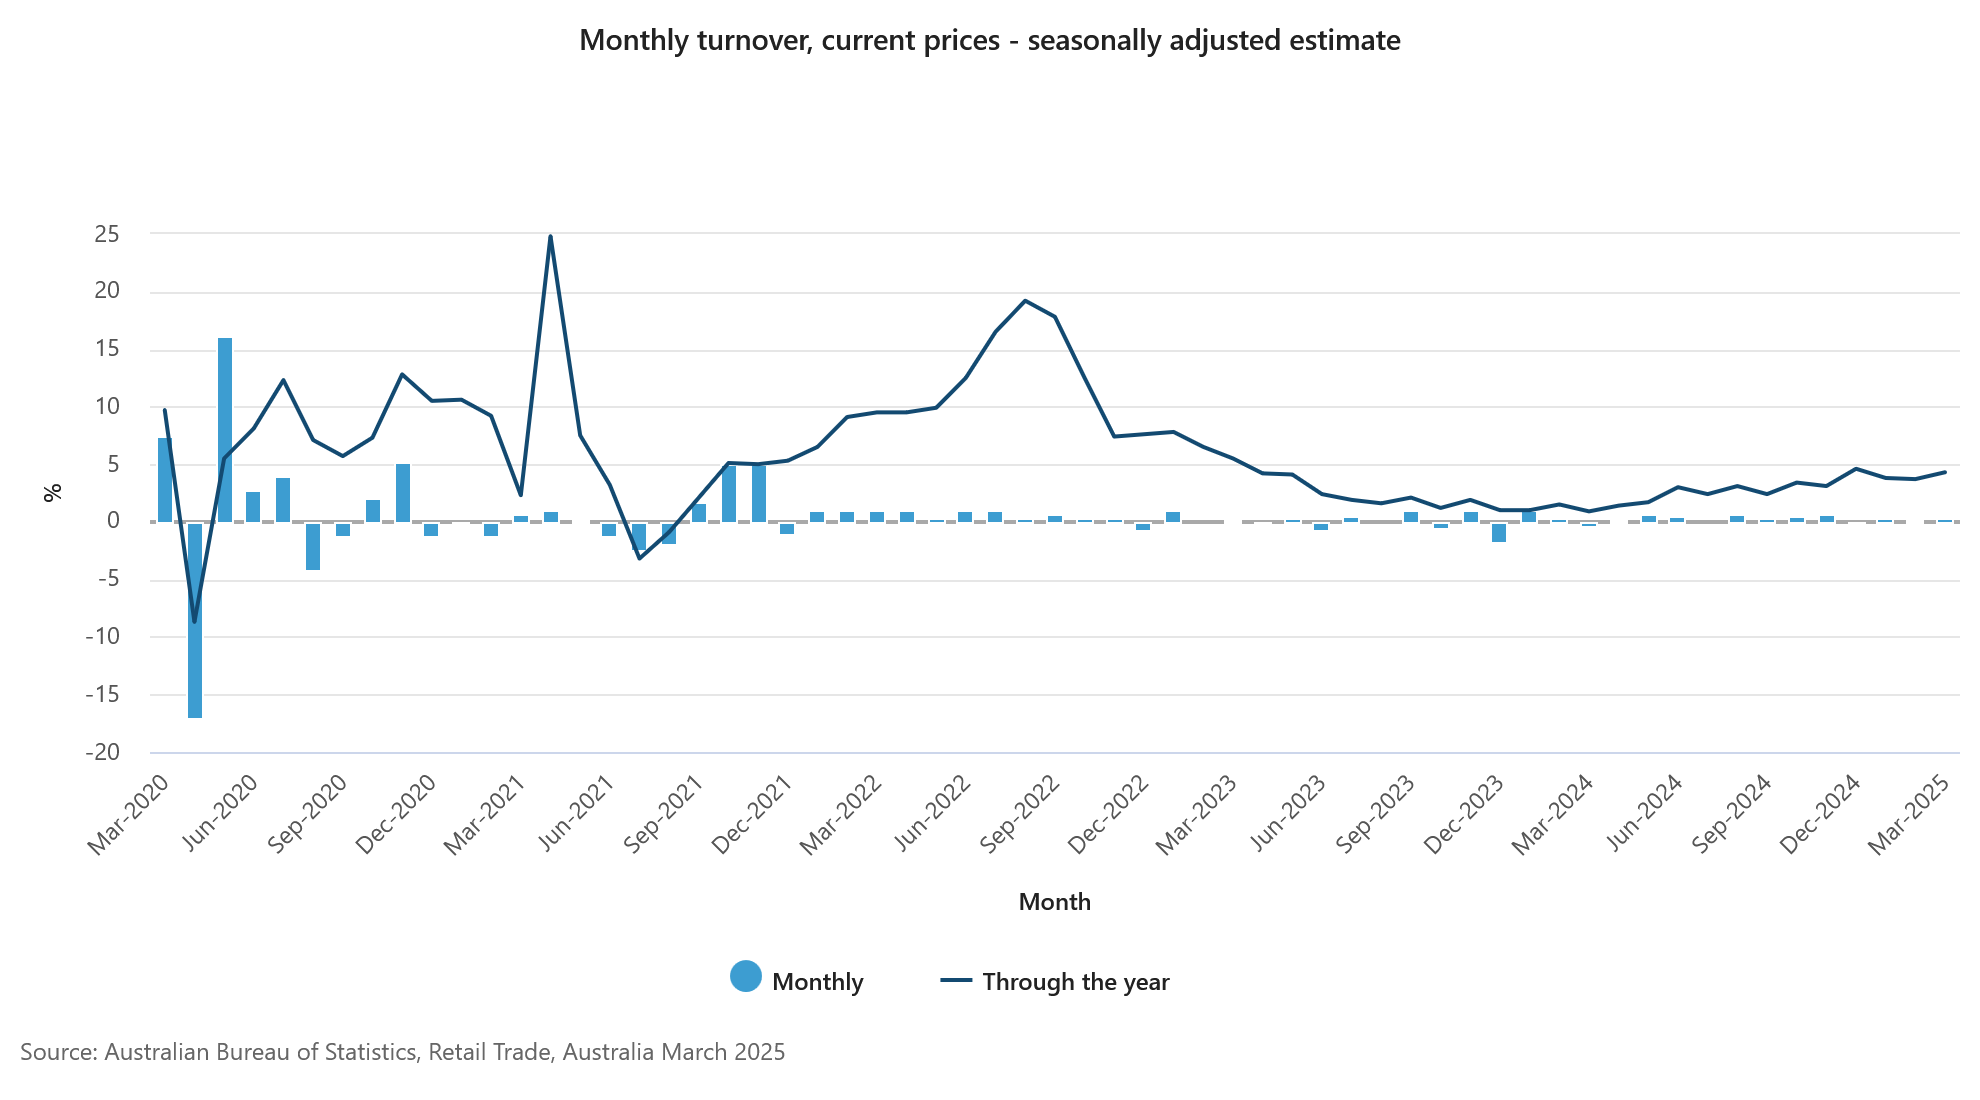
Australian retail sales grow 0.3% mom in March, but volumes flat in Q1
Australian retail sales rose by 0.3% mom in March to AUD 37.28 billion, slightly below expectations of 0.4% growth.
According to the ABS, food-related spending, particularly in supermarkets and grocery stores, was the main contributor to the uptick, with food and miscellaneous retailing both rising 0.7%. Clothing-related sales also edged higher, but household goods retailing was flat.
However, the broader trend is subdued, with retail sales volumes—adjusted for inflation—essentially flat over Q1. ABS Head of Business Statistics Robert Ewing noted that the lack of growth reflects weaker household appetite for discretionary goods, following a boost in spending late last year due to heavy promotions.
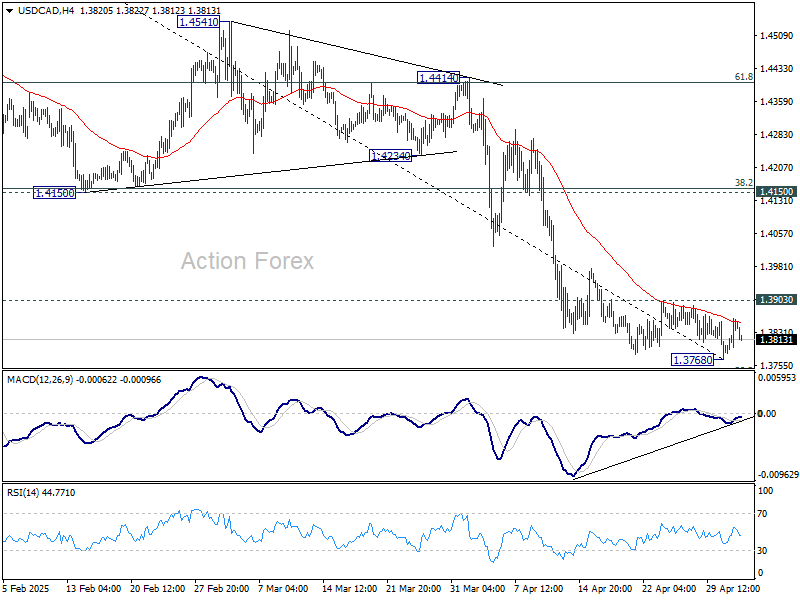
USD/CAD Daily Outlook
Daily Pivots: (S1) 1.3804; (P) 1.3834; (R1) 1.3883; More...
Intraday bias in USD/CAD is turned neutral again with current recovery. Deeper fall is expected as long as 1.3903 resistance holds. Below 1.3768 temporary low will resume the decline from 1.4791 to 1.3727 fibonacci level next. However, firm break of 1.3903 will indicate short term bottoming, and turn bias back to the upside for stronger rebound towards 55 D EMA (now at 1.4086).
In the bigger picture, price actions from 1.4791 medium term top could either be a correction to rise from 1.2005 (2021 low), or trend reversal. In either case, further decline is expected as long as 1.4150 resistance turned support holds. Firm break of 38.2% retracement of 1.2005 (2021 low) to 1.4791 at 1.3727 will pave the way back to 61.8% retracement at 1.3069.
Downside risks to NFP after ADP miss and rising Claims
The US April non-farm payroll report today will serve as a critical barometer of the labor market’s resilience amid rising macroeconomic uncertainty. While the recent flip-flopping of reciprocal tariffs may not yet be fully reflected in the data, other indicators suggest growing fragility.
A notable miss in today’s report could reignite concerns about recession, particularly following this week's Q1 GDP data which showed unexpected contraction. For Fed, a disappointing jobs print would increase pressure to resume easing in June.
Markets expect 130K jobs growth in April, following a much stronger-than-expected 228K gain in March. Average hourly earnings are seen rising 0.3% mom. Unemployment rate likely held steady at 4.2%.
Recent labor market signals, however, lean toward downside risks. Initial jobless claims surged to 241K last week, pushing the 4-week average up to 226K. Meanwhile, ADP Employment report showed private payrolls rising by just 62K, a sharp deceleration from the revised 147K in March. The ISM Manufacturing PMI Employment sub-index also remained in contraction at 46.2, though it did tick up slightly from 44.7.
Australian retail sales grow 0.3% mom in March, but volumes flat in Q1
Australian retail sales rose by 0.3% mom in March to AUD 37.28 billion, slightly below expectations of 0.4% growth.
According to the ABS, food-related spending, particularly in supermarkets and grocery stores, was the main contributor to the uptick, with food and miscellaneous retailing both rising 0.7%. Clothing-related sales also edged higher, but household goods retailing was flat.
However, the broader trend is subdued, with retail sales volumes—adjusted for inflation—essentially flat over Q1. ABS Head of Business Statistics Robert Ewing noted that the lack of growth reflects weaker household appetite for discretionary goods, following a boost in spending late last year due to heavy promotions.
Cliff Notes: Gauging Confidence Effects
Key insights from the week that was.
Australia’s Q1 CPI report was this week’s main event domestically, The key outcomes were slightly above consensus, the headline measure rising 2.4%yr (0.9%qtr) and the underlying trimmed mean measure 2.9%yr (0.7%qtr). Arguably there is less need to intensely scrutinise the detail now annual inflation is back in the RBA’s 2-3%yr target range, but it is worth highlighting the deceleration in market services inflation to 3.3%yr after being stuck at 4.2%yr throughout 2024 as it has been regularly cited by the RBA when discussing the upside risks to inflation. The current pulse is constructive too. On a six-month annualised basis, both headline and trimmed mean inflation are now in the bottom half of the RBA’s 2-3% target band, all but locking in a cash rate cut at the May policy meeting in roughly two weeks’ time.
As discussed by Chief Economist Luci Ellis in this week’s essay, many other indicators also warrant moving towards a neutral monetary policy stance. This includes our Q1 Westpac-DataX Consumer Panel update which revealed that Australians have now saved 80¢ from every extra dollar of income received from the tax cuts. With households opting to rebuild savings buffers – following a lengthy period of declining real per capita disposable income – there is limited scope for a ‘strong’ rebound in real consumer spending and instead larger downside risks to growth.
On the broader growth outlook, the latest update on trade reported a significant rebound in the goods surplus, up to $6.9bn in March. The data has been incredibly volatile over the past few months; but, overall, Australian goods exporters look to have benefitted from tariff front-running, setting up a positive contribution to GDP from net exports in Q1. Later this morning, we will also receive an update on retail sales volumes, another key guide for Q1 GDP, due in early June.
Offshore, US data made clear the downside risks from the Trump Administration’s trade policy.
US GDP disappointed expectations at the margin, declining 0.3% on an annualised basis. A key contributor to this deterioration was household consumption which slowed from a 4.0% annualised pace in Q4 to 1.8% in Q1 2025. This is despite continued robust gains in employment and wage growth. While the latest read for ADP employment points to downside risks for employment, the monthly gain decelerating from 147k to 62k in April, wage growth as measured by the employment cost index remained healthy in Q1, rising another 0.9%.
Coming back to the Q1 GDP detail, the other results were diverse and arguably susceptible to revision. In Q1, government spending declined and dwelling investment stalled, but business investment surged. The pull-forward of imports to get ahead of tariffs (from not only Australia but the world) was clear in the trade detail too, imports growing at a 41% annualised pace against exports' 1.8%. Another way to highlight the significance of the trade effect is to note that, while GDP growth declined from 2.4% annualised to -0.3% in Q1, annualised growth in domestic demand (which omits the impetus from the trade position) was only 0.5ppts lower in Q1 at 2.4% annualised.
Assessed in isolation, this outcome would imply there is no reason to be concerned over domestic demand in the US hence. But this activity and price data pre-dates April's tariff escalation. Consumer and business sentiment has since jolted lower.
On the final release for April, University of Michigan consumer sentiment is almost 30% lower than in December and most certainly due to concern over tariffs – the 1-year view for inflation now 6.5%, more than three times the FOMC’s 2.0%yr target. The Conference Board’s measure was similarly downbeat, particularly expectations which declined 12.5pts to only 54.4, the lowest level since October 2011. Respondents to this survey also showed acute concern over inflation, their 1-year inflation expectation now 7.0%yr, but also felt tariffs were likely to impact the labour market, the assessment of ‘jobs plentiful’ minus ‘jobs hard to get’ down to the second lowest level in this cycle. To date, labour market data has been consistent with a deceleration in employment growth, not outright decline; but, as made clear by the ADP reading above, risks are heavily skewed.
This risk is also evinced by the business surveys. Most notably, the ISM manufacturing employment index is currently almost 10pts below its 20-year average. The various Federal Reserve district business surveys also point to apprehension and concern over the outlook amongst a wide variety of US businesses. Tonight we will receive the April employment report, giving a full view of US labour market dynamics as President Trump’s tariffs were announced and implemented.
While of limited interest to markets this week, developments outside the US are worthy of close assessment. In contrast to the deterioration in US economic activity, Euro Area GDP surprised to the upside, rising 0.4% in Q1 to remain 1.2% higher over the year – a trend pace. Detail is still forthcoming, but European Commission economic sentiment and recent labour market data point to resilience across the region. Ahead, Europe is not only likely to receive financial inflows from those looking to diversify away from the US, but also additional tourism-related activity.
Albeit to a lesser extent, and likely with a lag, the same can be said of Asia. While news reports assessed the headline readings for China’s official PMI’s this week against the supposed 50 expansion/ contraction divide, manufacturing at 49.0 and services circa 50.4, it is best to instead assess current outcomes against the historic relationship between the PMIs and GDP.
Over the past decade or so, outcomes for the PMIs around the current level have occurred coincident to GDP growth at or above the 2025 target of 5.0%. This is before we take into consideration the stimulus being readied by authorities to support the consumer and housing, or the highly-accommodative stance of monetary policy. Asia more broadly will receive benefit from robust growth in China and India, but also has a strong pipeline of development opportunities before it.
Obviously the more developed an economy, the less power this pipeline has. However, even for a highly developed economy like Japan, the outlook remains constructive.
This week the Bank of Japan met and, unsurprisingly given current US policy uncertainty, left policy unchanged. Yet they still expect any shock to growth to prove modest and temporary, with activity growth forecast to accelerate from a downwardly revised 0.5%yr in FY2025 (from 0.7% in FY2024 and compared to January’s 1.1%yr forecast for FY2025) to 1.0%yr in FY2027. Core inflation (ex fresh food and energy) meanwhile is expected to hold either side of the BoJ’s 2.0%yr target in FY2025 and FY2026 and achieve it come FY2027. As such, the BoJ’s focus remains slowly normalising policy, targeting a policy rate of 1.0%. One 25bp hike remains likely by end-2025, but the last not until 2026.
USD/JPY Rises, Bulls Aim Larger Move Toward 150.00
Key Highlights
- USD/JPY started a fresh increase above the 144.00 resistance.
- A connecting bullish trend line is forming with support at 143.80 on the 4-hour chart.
- EUR/USD is correcting gains and might dip below the 1.1250 level.
- Bitcoin is gaining pace above the $96,200 resistance.
USD/JPY Technical Analysis
The US Dollar started a fresh increase from the 140.00 zone against the Japanese Yen. USD/JPY cleared the 141.20 and 142.00 resistance levels.
Looking at the 4-hour chart, the pair settled above the 143.20 level and the 100 simple moving average (red, 4-hour). The bulls even pushed the pair above the 50% Fib retracement level of the downward move from the 150.48 swing high to the 139.88 low.
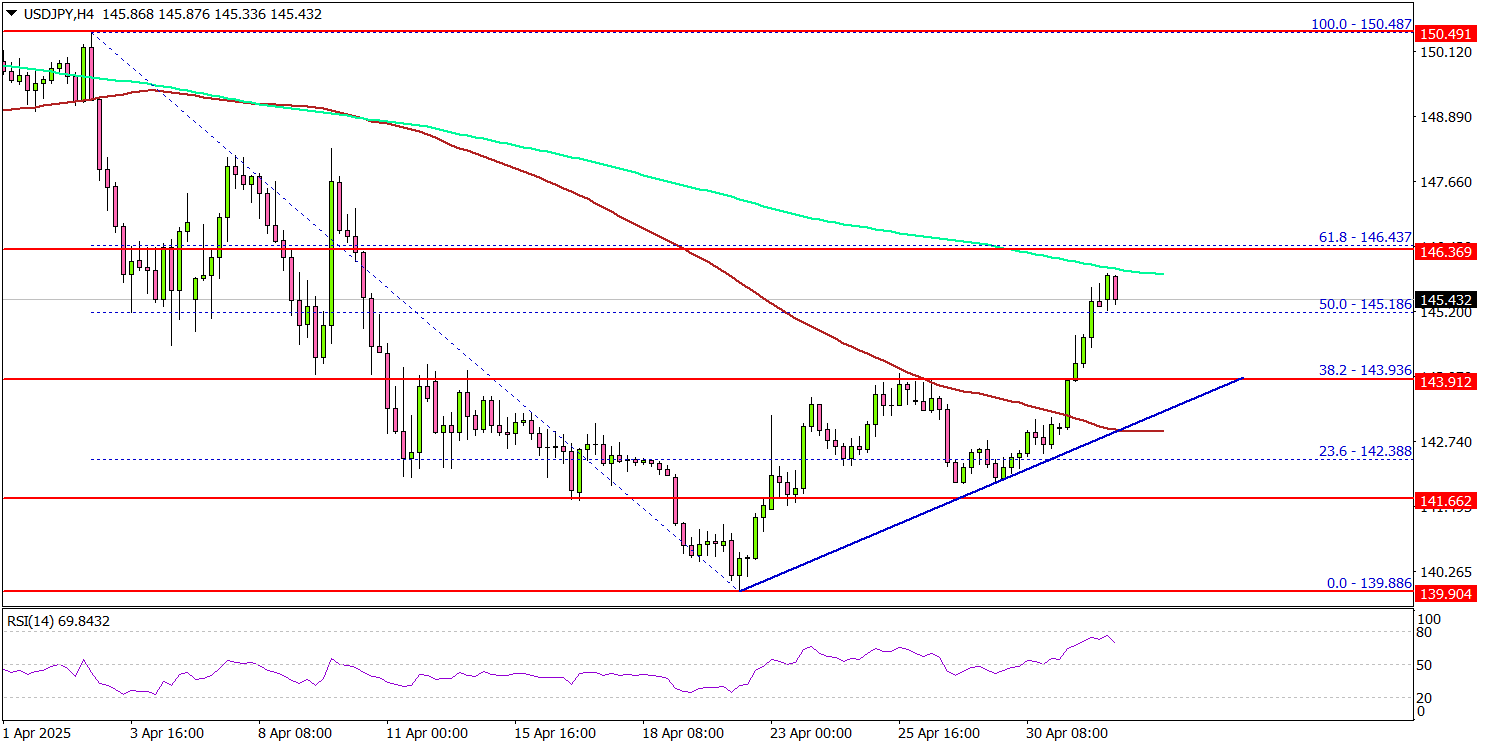
It is now facing resistance near the 146.00 level and the 200 simple moving average (green, 4-hour). If there is a fresh increase, the pair could face resistance near the 146.20 level.
The next major resistance is near the 146.50 zone and the 61.8% Fib retracement level of the downward move from the 150.48 swing high to the 139.88 low. A close above the 146.50 level could set the tone for another increase. In the stated case, the pair could even clear the 147.20 resistance.
On the downside, immediate support sits near the 145.20 level. The next key support sits near the 144.20 level. Any more losses could send the pair toward the 143.50 level.
Looking at Bitcoin, the price remains in a positive zone and might soon aim for a move above the $97,200 resistance zone.
Upcoming Economic Events:
- US nonfarm payrolls for April 2025 – Forecast 130K, versus 228K previous.
- US Unemployment Rate for April 2025 - Forecast 4.2%, versus 4.2% previous.
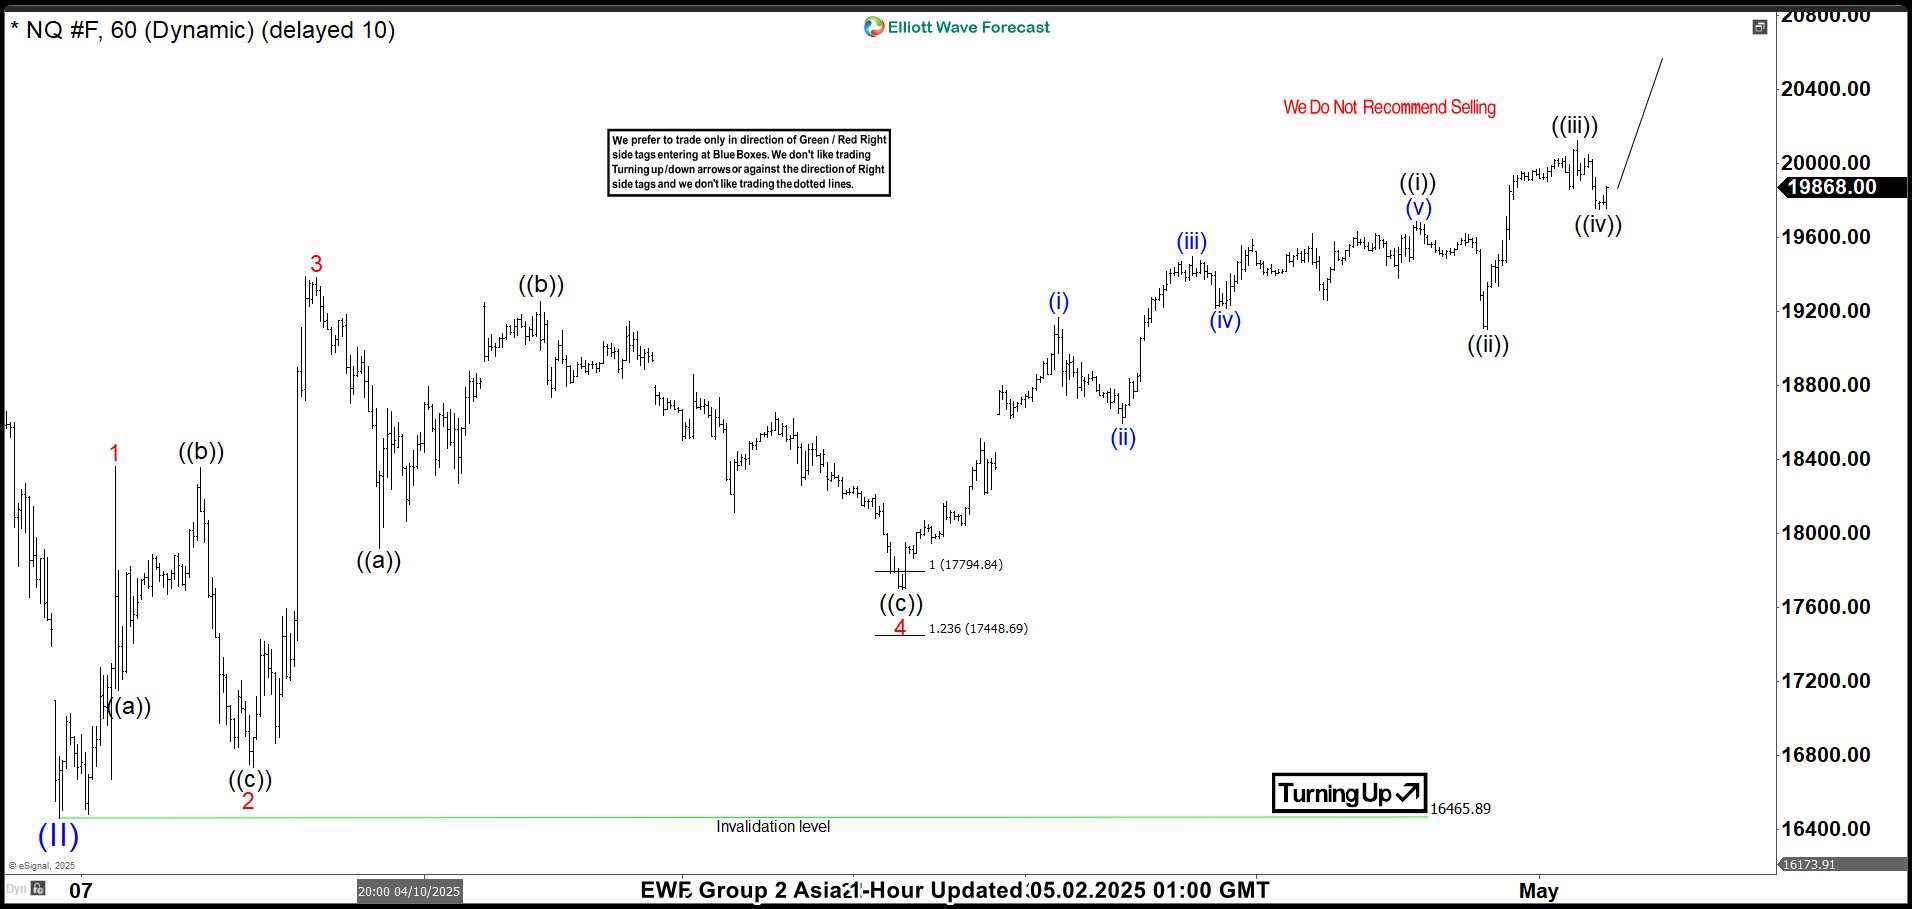
Nasdaq Futures (NQ): 5 Swing Pattern Points to Further Gain
Nasdaq Futures (NQ) experienced a sharp selloff following a tariff announcement by President Trump, with the decline starting from a peak on December 16, 2024, at 22,450. The selloff concluded at 16,465.89 on April 7, 2025, which we’ve labeled as wave (II). For the Index to confirm a bullish trend and rule out a potential double correction, it must break above the December 16, 2024, high of 22,450. In the short term, the rally from the April 7 low of 16,465.89 is unfolding as a five-swing pattern. It is a motive sequence that suggests further upside potential.
From the April 7 low, the rally is developing as a five-wave diagonal structure. Wave 1 peaked at 18,361.5, followed by a wave 2 pullback to 16,735. The Index then surged in wave 3 to 19,386.75, with a wave 4 dip ending at 17,700. Currently, wave 5 is in progress, with sub-wave ((i)) topping at 19,688.5 and sub-wave ((ii)) bottoming at 19,103.75. Sub-wave ((iii)) reached 20,125.75, and a potential sub-wave ((iv)) pullback may have concluded at 19,749.5.
The Index is expected to push higher once more in sub-wave ((v)) to complete wave 5 of (1). After this, a wave (2) pullback should occur, likely in a 3, 7, or 11-swing pattern, before the Index resumes its upward trend. As long as the 16,465.89 low holds, dips are expected to attract buyers in 3, 7, or 11-swing patterns, supporting further gains in the near term
Nasdaq 60 Minute Elliott Wave Chart
Nasdaq (NQ) Video Analysis
https://www.youtube.com/watch?v=RGOTrsl5wrk
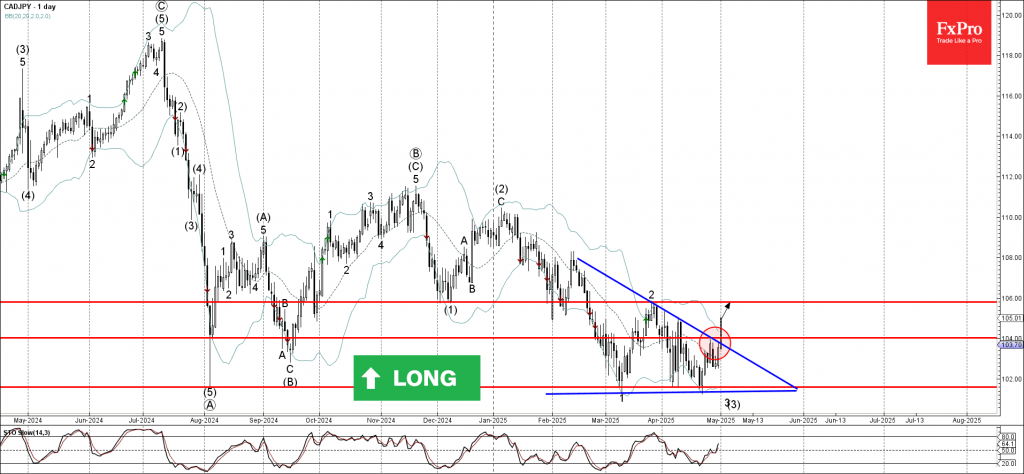
CADJPY Wave Analysis
CADJPY: ⬆️ Buy
- CADJPY broke the resistance zone
- Likely to rise to resistance level 106.00
CADJPY currency pair recently broke the resistance zone between the resistance level 104.00 and the resistance trendline of the Descending Triangle from February.
The breakout of this resistance zone continues the earlier sharp upward correction from the major long-term support level 102.00, which has been reversing the price from August.
CADJPY can be expected to rise to the next resistance level 106.00 (top of the previous minor correction 2 from March).
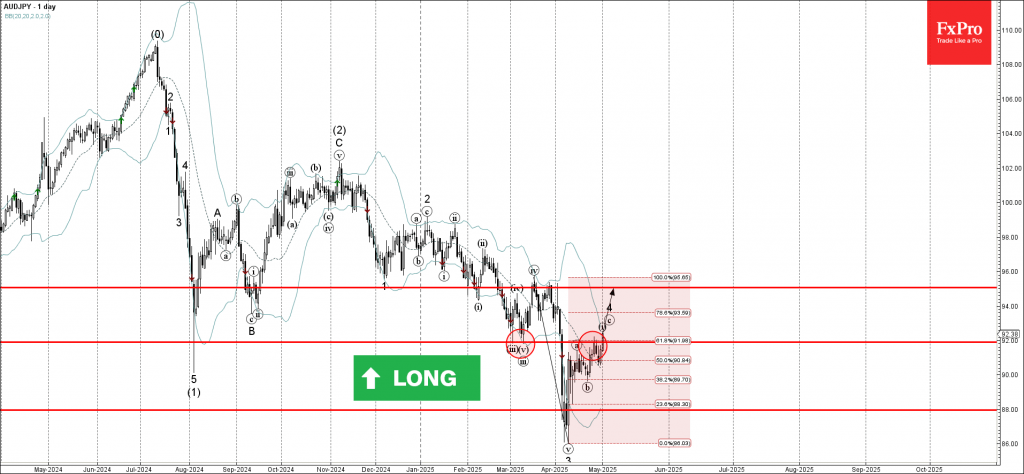
AUDJPY Wave Analysis
AUDJPY: ⬆️ Buy
- AUDJPY broke the resistance zone
- Likely to rise to resistance level 95.00
AUDJPY currency pair recently broke the resistance zone between the resistance level 92.00 (former strong support from the start of March and the resistance from the end of April) and the 61.8% Fibonacci correction of the downward impulse from the beginning of March.
The breakout of this resistance zone should strengthen the bullish pressure on AUDJPY.
AUDJPY currency pair can be expected to rise to the next resistance level 95.00, which is the target price for the completion of the active impulse wave c.
Gold Wave Analysis
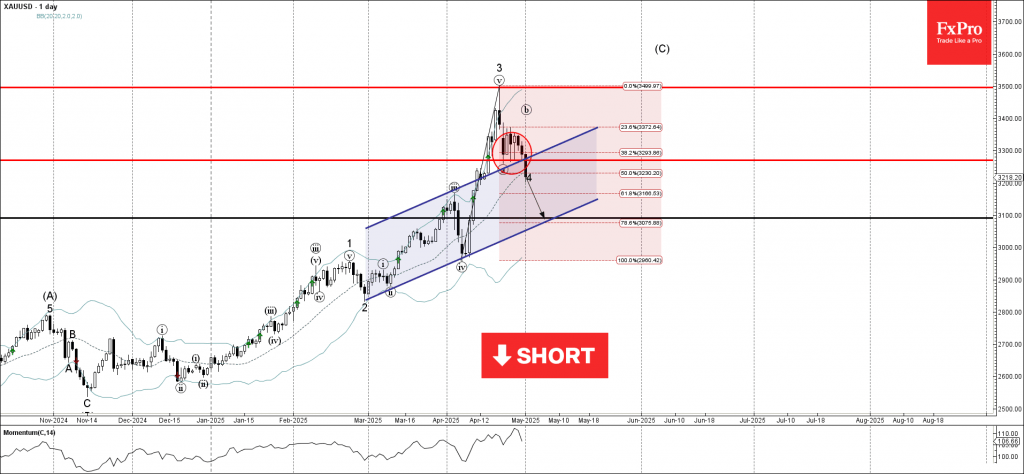
Gold: ⬇️ Sell
- Gold broke support zone
- Likely to fall to support level 3100.00
Gold recently broke the support zone between the support level 3270.00 (former low of wave a from the middle of April), upper trendline of the daily up channel from February and the 38.2% Fibonacci correction of the upward impulse from the beginning of April.
The breakout of this support zone should accelerate the active short-term ABC correction 4 from the middle of April.
Gold can be expected to fall to the next support level 3100.00, which is the target price for the completion of the active ABC correction 4.