

Sample Category Title
GBP/USD Weekly Outlook
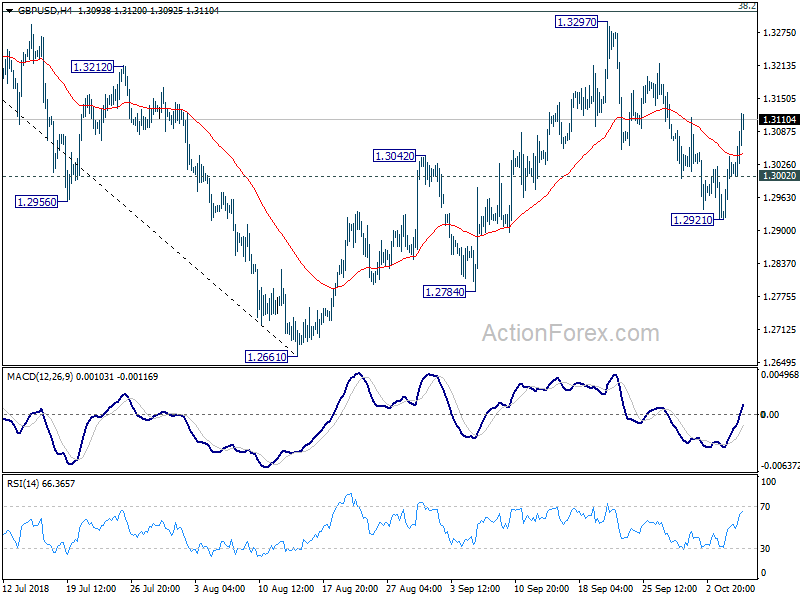
After dipping to 1.2921 last week, GBP/USD staged a strong rebound from there. Breach of 1.3115 resistance suggests that pull back from 1.3297 has completed. Initial bias is on the upside this week for retesting 1.3297. For now, we'd still expect strong resistance from 1.3316 key fibonacci level to limit upside to bring down trend resumption. On the downside, below 1.3002 minor support will turn bias back to the downside for 1.2921 first.
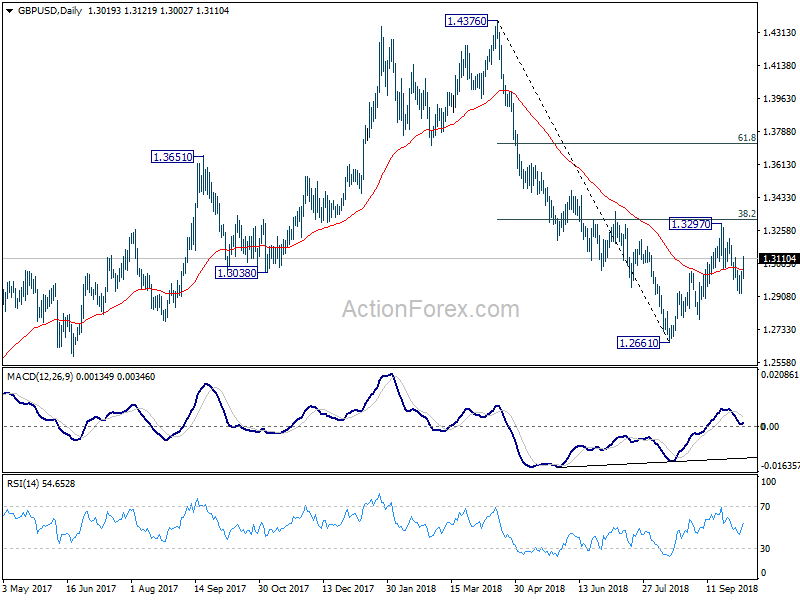
In the bigger picture, whole medium term rebound from 1.1946 (2016 low) should have completed at 1.4376 already, after rejection from 55 month EMA (now at 1.4062). The structure and momentum of the fall from 1.4376 argues that it's resuming long term down trend. And this will be the preferred case as long as 38.2% retracement of 1.4376 to 1.2661 at 1.3316 holds. However, firm break of 1.3316 would bring stronger rebound to 61.8% retracement at 1.3721. And, the eventual depth of the fall from 1.4376, and the chance of hitting 1.1946 low, will depend on the strength of the interim corrective rebound from 1.2661.
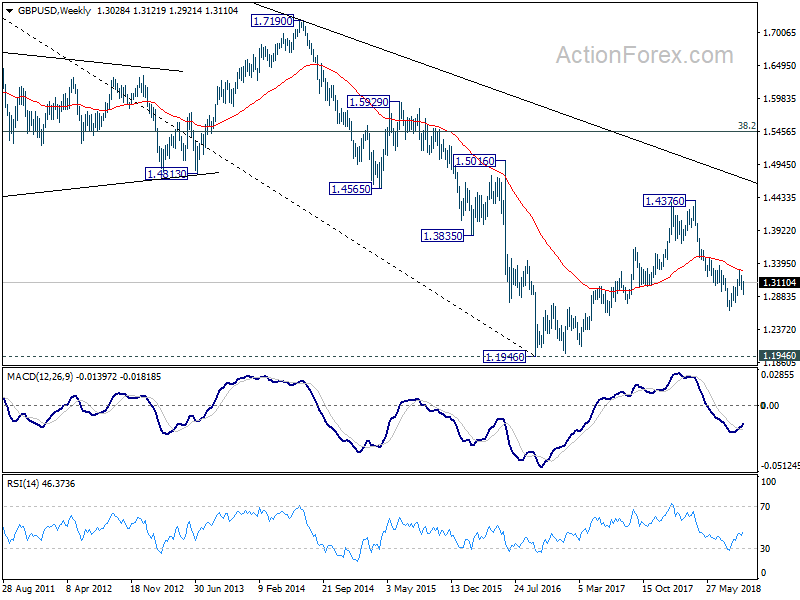
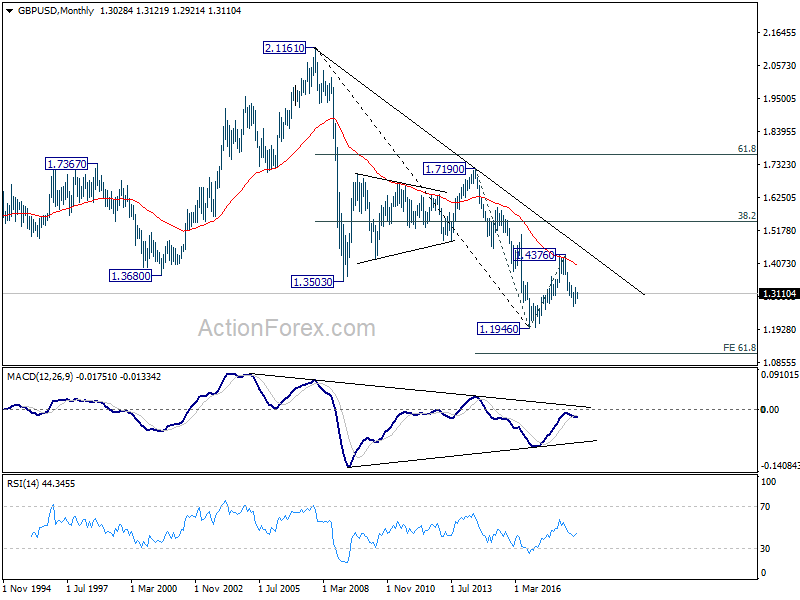
In the longer term picture, outlook in GBP/USD is held bearish. Rebound from 1.1946 was rejected solidly by falling 55 month EMA. The pair was limited well below 38.2% retracement of 2.1161 (2007 high) to 1.1946, as well as the decade long falling trend line. On break of 1.1946, next target will be 61.8% projection of 1.7190 to 1.1946 from 1.4376 at 1.1135.
USD/CHF Weekly Outlook
USD/CHF surged to as high as 0.9954 last week before forming a temporary top there and retreated .Initial bias is neutral this week for some consolidations. Downside should be contained by 38.2% retracement of 0.9541 to 0.9954 at 0.9796 to bring another rally. On the upside, break of 0.9954 will target 1.0067 resistance next.
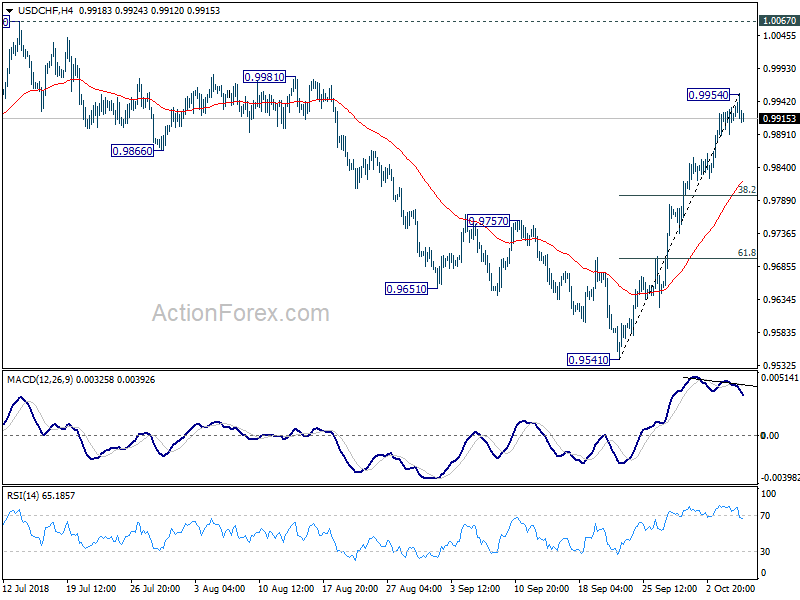
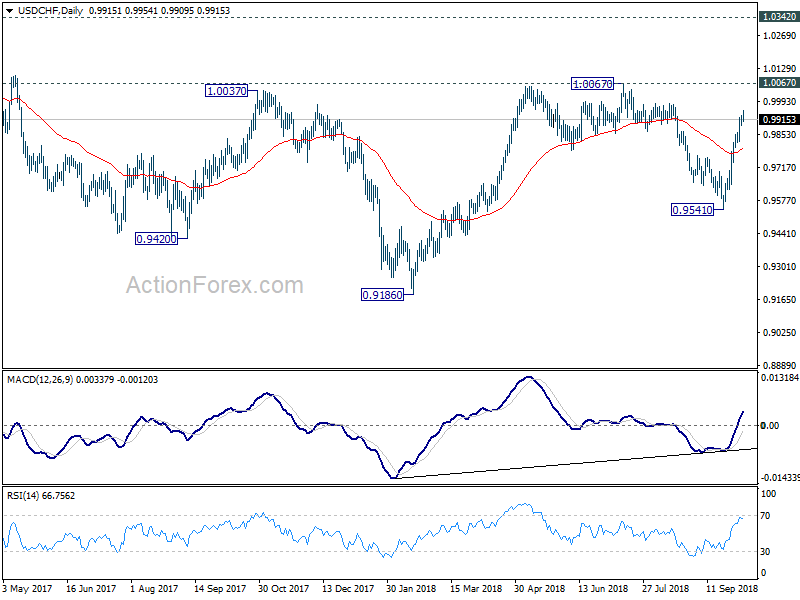
In the bigger picture, the pullback from 1.0067 has completed at 0.9541 already. And rise from 0.9186 is likely resuming. Firm break of 1.0067 will pave the way to retest 1.0342 key resistance. We'd be cautious on strong resistance from there to limit upside to bring another medium term fall to extend long term range trading.
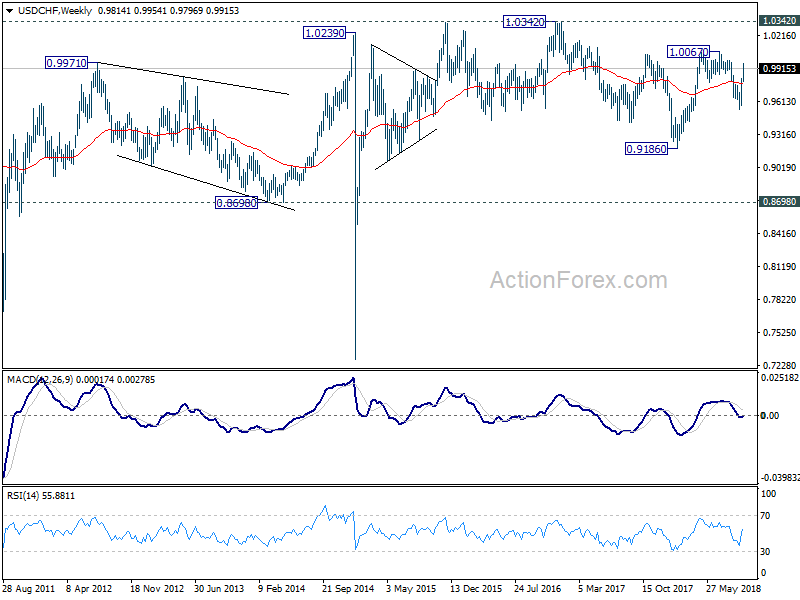
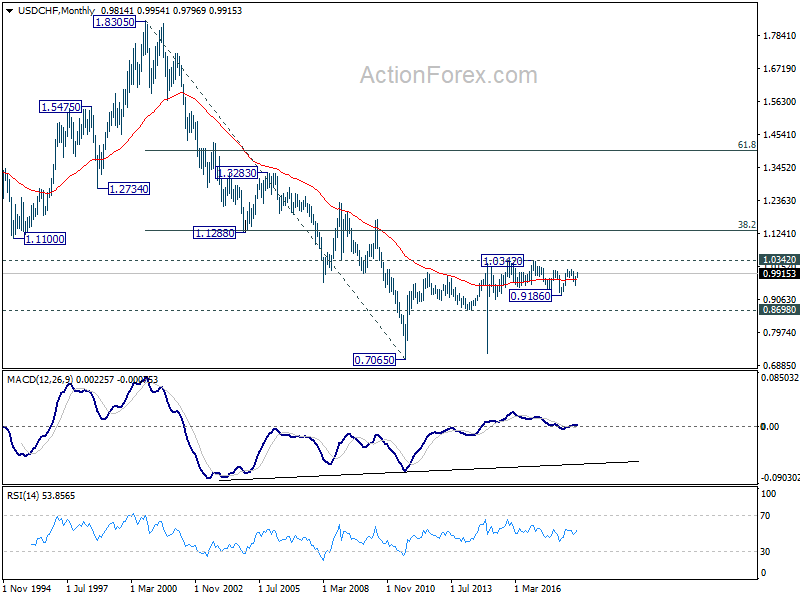
In the long term picture, price actions from 0.7065 (2011 low) are not clearly impulsive yet. Thus, we'll treat it as developing into a corrective pattern, at least, until a firm break of 1.0342 resistance.
AUD/USD Weekly Outlook
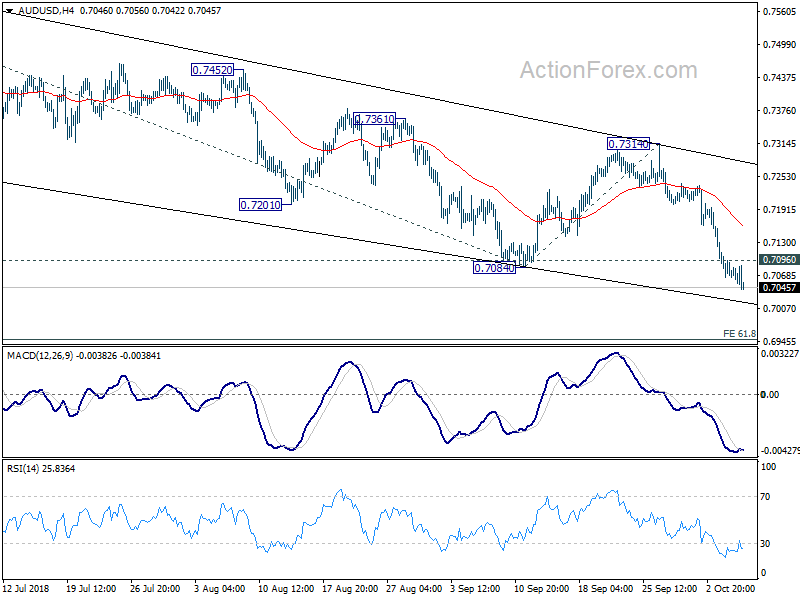
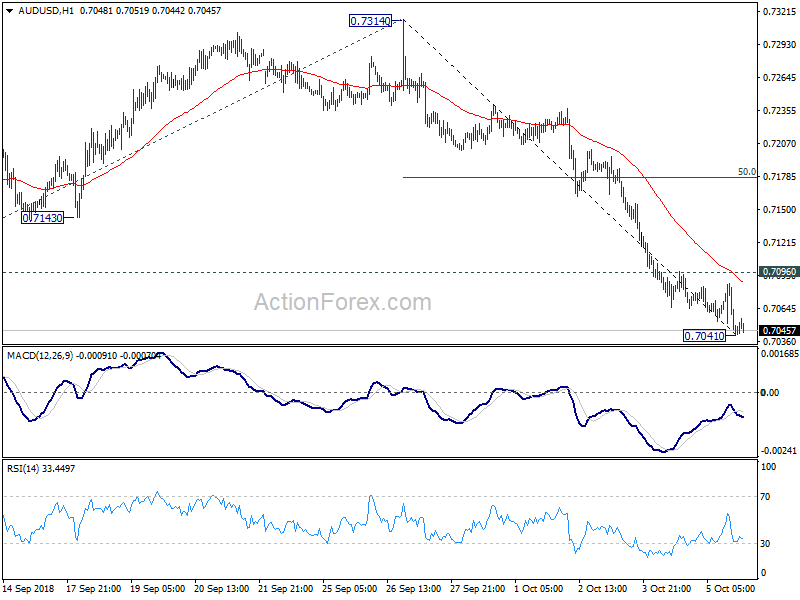
AUD/USD dropped to as low as 0.7041 last week as down trend from 0.8135 resumed. Initial bias stays on the downside this week for 61.8% projection of 0.7676 to 0.7084 from 0.7314 at 0.6948 next. On the upside, break of 0.7096 minor resistance will turn intraday bias neutral and bring consolidations first, before staging another fall.
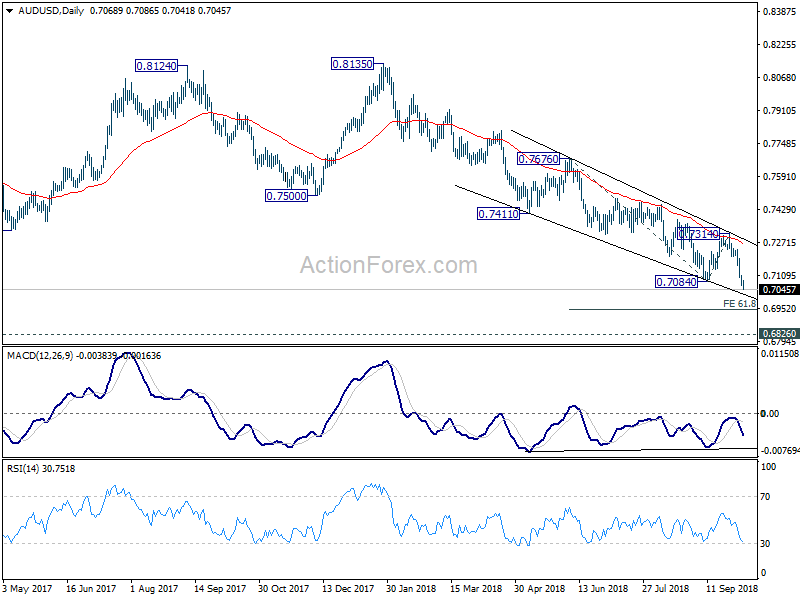
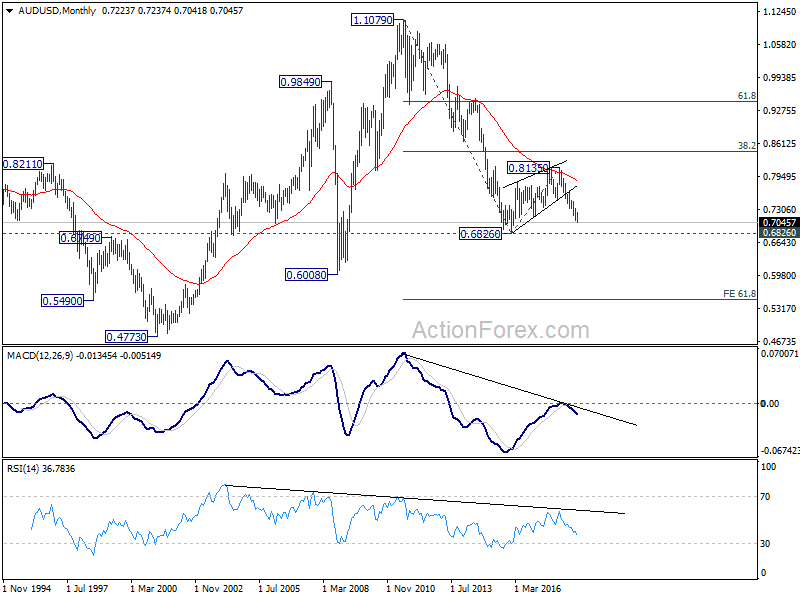
In the bigger picture, fall from 0.8135 is tentatively treated as resuming long term down trend from 1.1079 (2011 high). Decisive break of 0.6826 will target 0.6008 key support next (2008 low). However, break of 0.7500 support turned resistance will argue that the corrective pattern from 0.6826 is going to extend with another rising leg before completion.
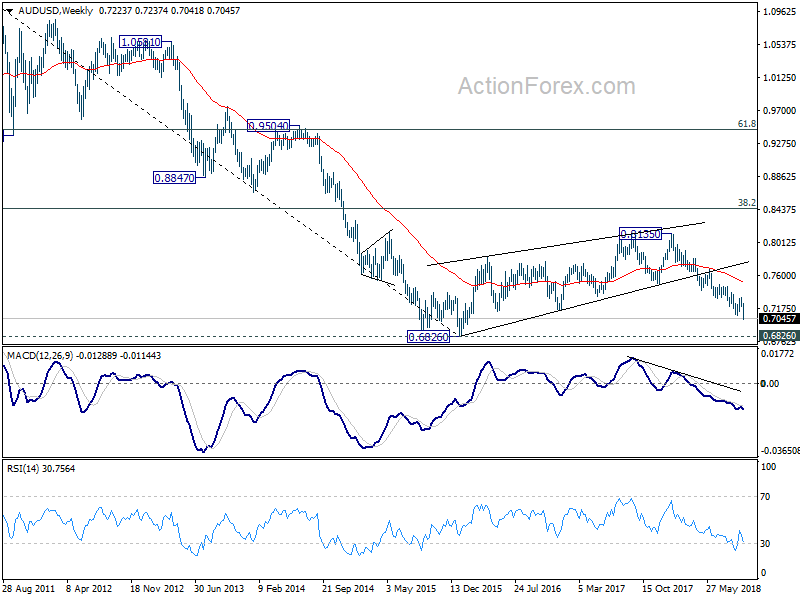
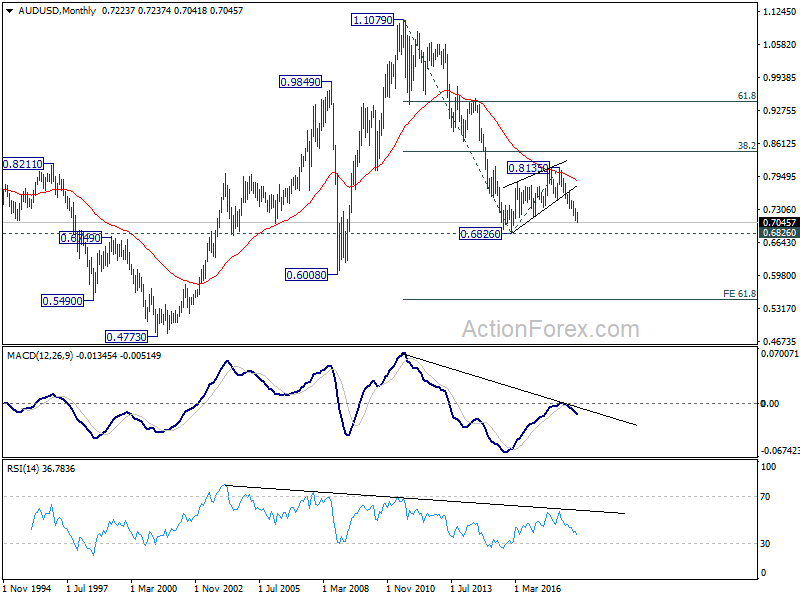
In the longer term picture, the corrective structure of rebound from 0.6826 (2016 low) to 0.8135, and the failure to break 38.2% retracement of 1.1079 (2011 high) to 0.6826 at 0.8451, carry bearish implications. AUD/USD was also rejected by 55 month EMA. Now, the down trend from 1.1079 is in favor to extend. On break of 0.6826, next target will be 61.8% projection of 1.1079 to 0.6826 from 0.8135 at 0.5507.
USD/CAD Weekly Outlook
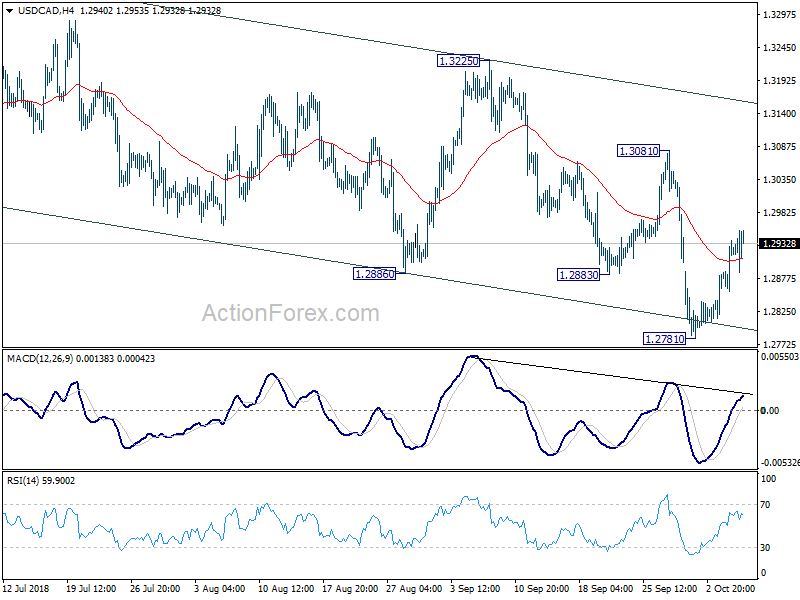
USD/CAD dived to as low as 1.2781 last week but recovered strongly since then. But upside is limited well below 1.3081 resistance so far. Thus, there is no clear sign of near term reversal yet. Initial bias stays neutral this week first. On the downside, break of 1.2781 will will extend whole decline from 1.3385 to next fibonacci level at 1.2567, which is close to 1.2526 support.
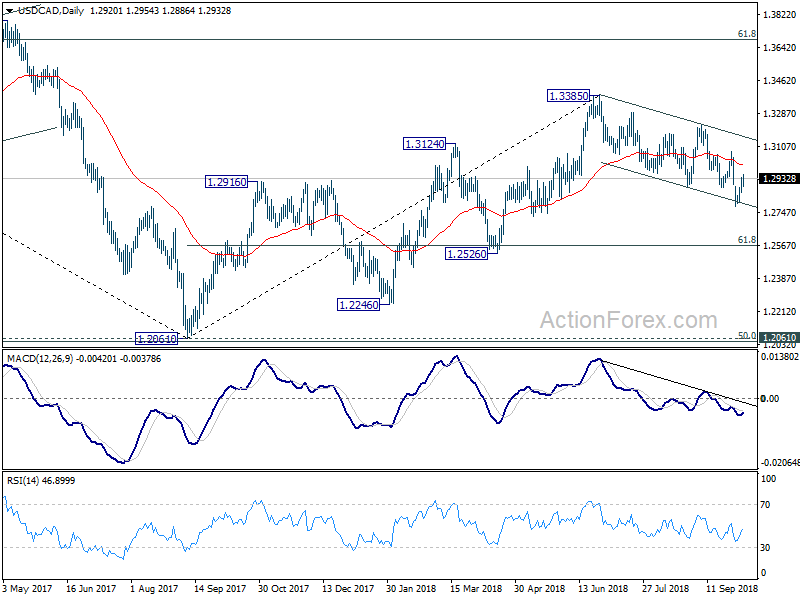
In the bigger picture, corrective rebound from 1.2061 could have completed at 1.3385 already. Deeper fall is mildly in favor to 61.8% retracement of 1.2061 to 1.3385 at 1.2567, which is close to 1.2526 support. For now, we're not seeing fall from 1.3385 as resuming larger down trend from 1.4689 (2015 high) yet. Thus, we'll look for bottoming signal again below 1.2567 . On the upside, though, break of 1.3081 resistance will argue that the pull back from 1.3385 is completed and rise from 1.2061 is resuming for another high above 1.3385.
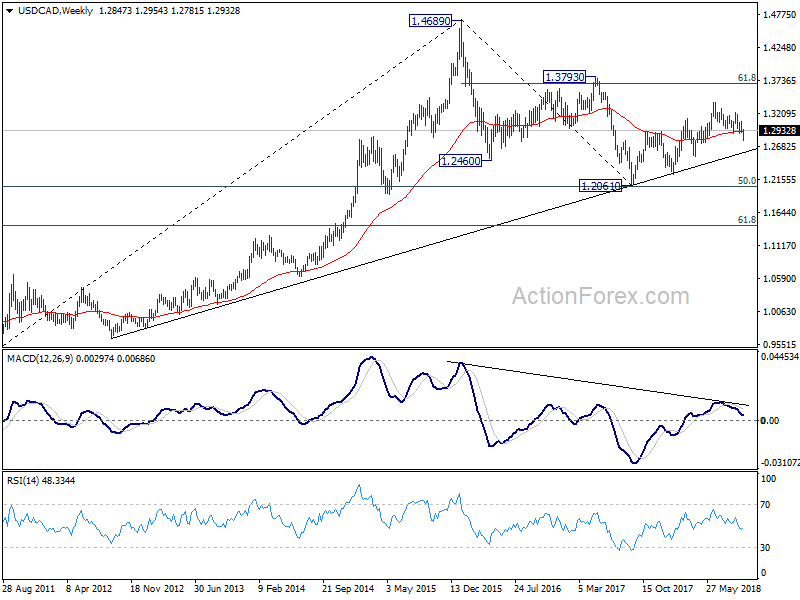
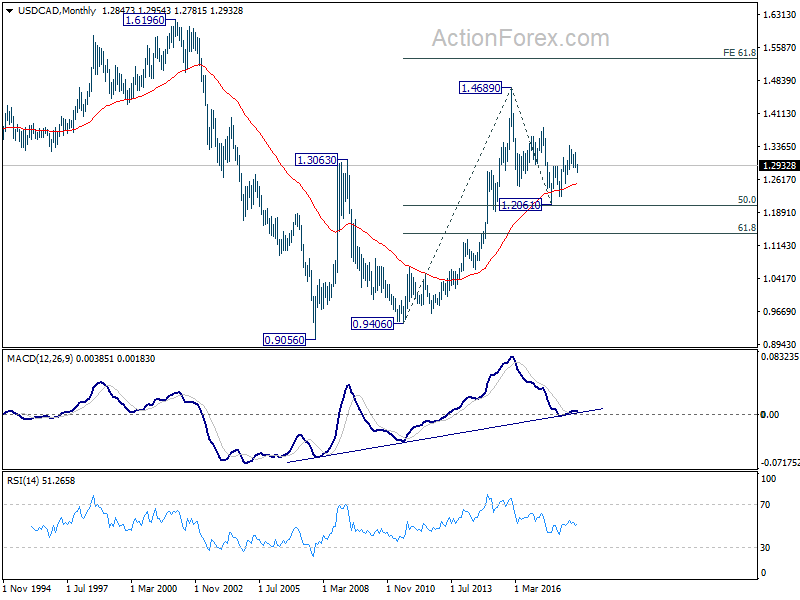
In the longer term picture, corrective fall from 1.4689 (2015 high) should have completed with three waves down to 1.2061, just ahead of 50% retracement of 0.9406 (2011 low) to 1.4689 (2015 high) at 1.2048. The development keeps long term up trend from 0.9406 and that from 0.9056 (2007 low) intact. For now, there is prospect of extending the long term up trend to 61.8% projection of 0.9406 to 1.4689 from 1.2061 at 1.5326 in medium to long term.
GBP/JPY Weekly Outlook
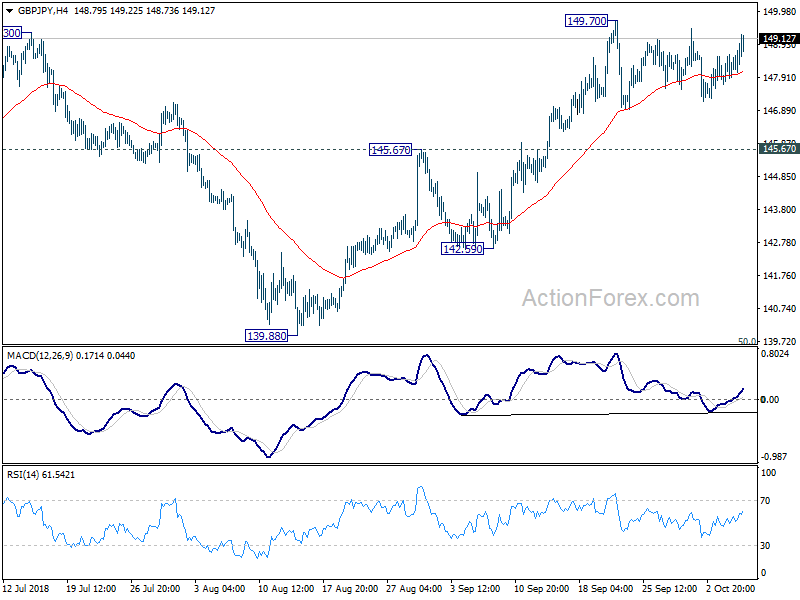
GBP/JPY stayed in consolidation from 149.70 last week and outlook is unchanged. Initial bias remains neutral this week first. With 145.67 support intact, outlook stays bullish and further rally is expected. On the upside, above 149.70 will target 153.84/156.69 resistance zone next. However, break of 145.67 will suggest that the rebound from 139.88 has completed and turn near term outlook bearish again.
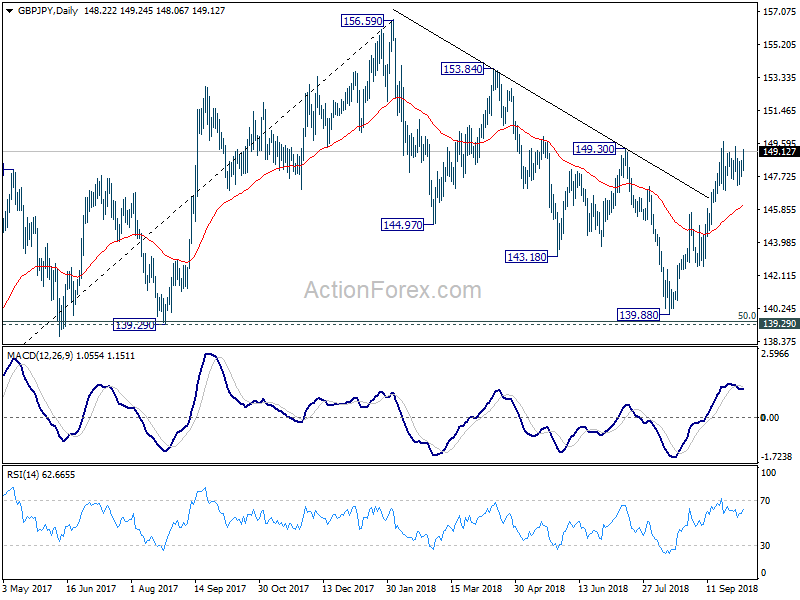
In the bigger picture, current development suggests that GBP/JPY has successfully defended 139.29 cluster support (50% retracement of 122.36 to 156.59 at 139.47). And, the rally from 122.36 (2016 low) is still intact. Such medium to long term rise would extend through 156.96 high. This will now be the preferred case as long as 145.67 near term support holds. However, break of 145.67 will turn focus back to 139.29/47 key support zone.
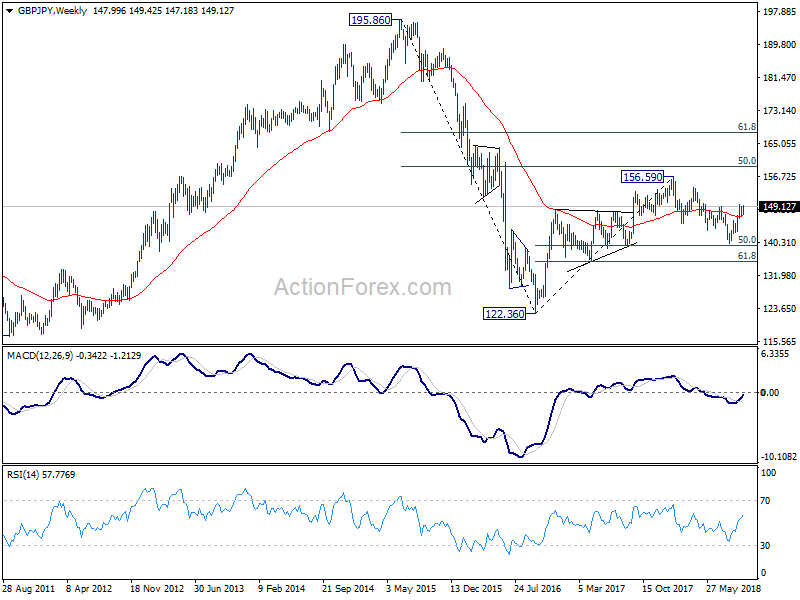
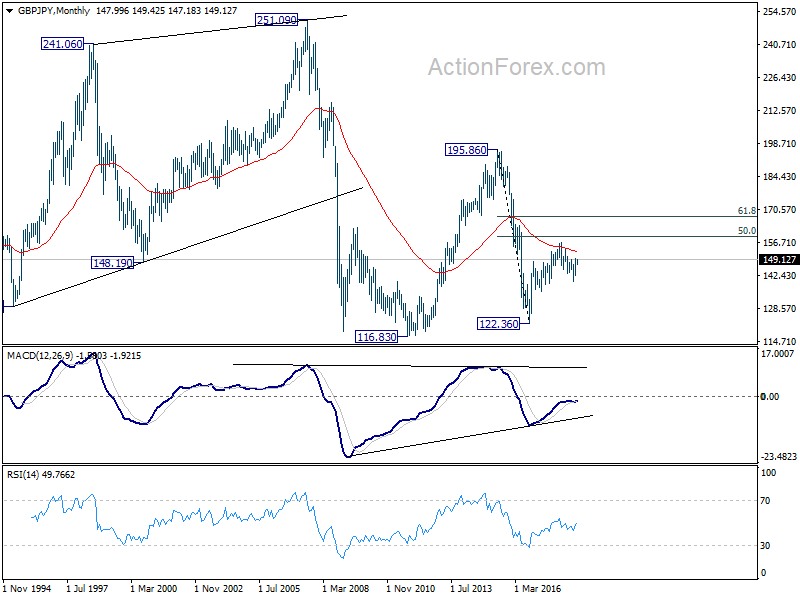
In the longer term picture, the failure to sustain above 55 month EMA (now at 152.97) mixed the outlook. Nonetheless, as long as 139.29 holds, rise from 122.36 is in favor to extend to 50% retracement of 195.86 (2015 high) to 122.36 (2016 low) at 159.11, and possibly further to 61.8% retracement at 167.78 before completion. However, firm break of 139.29 will turn focus back to 116.83/122.36 support zone instead.
EUR/JPY Weekly Outlook
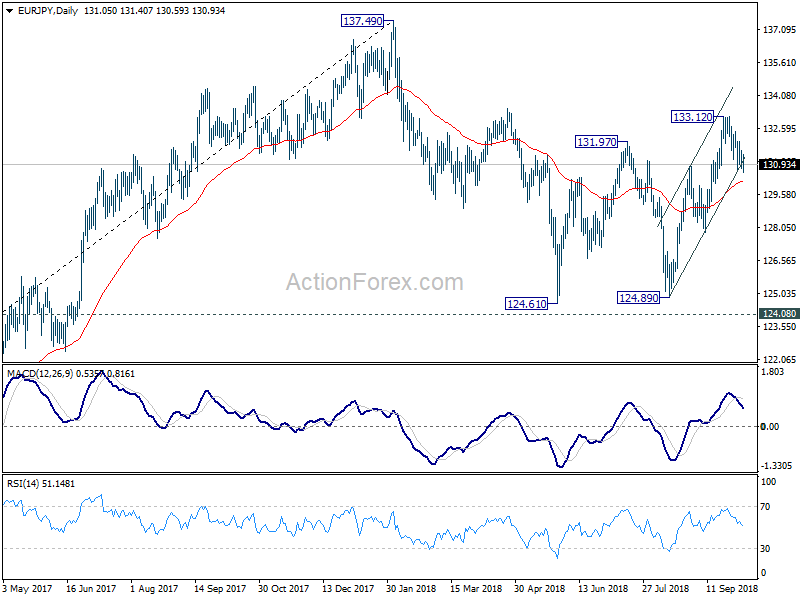
EUR/JPY gyrated lower last week and the breach of 130.86 resistance turned support argues that rise from 124.89 might be over. Initial bias is mildly on the downside this week for 55 day EMA (now at 130.17). Break will bring deeper fall to 127.85 support and below. On the upside, break of 131.95 minor resistance will turn bias back to the upside for 133.12 resistance instead.
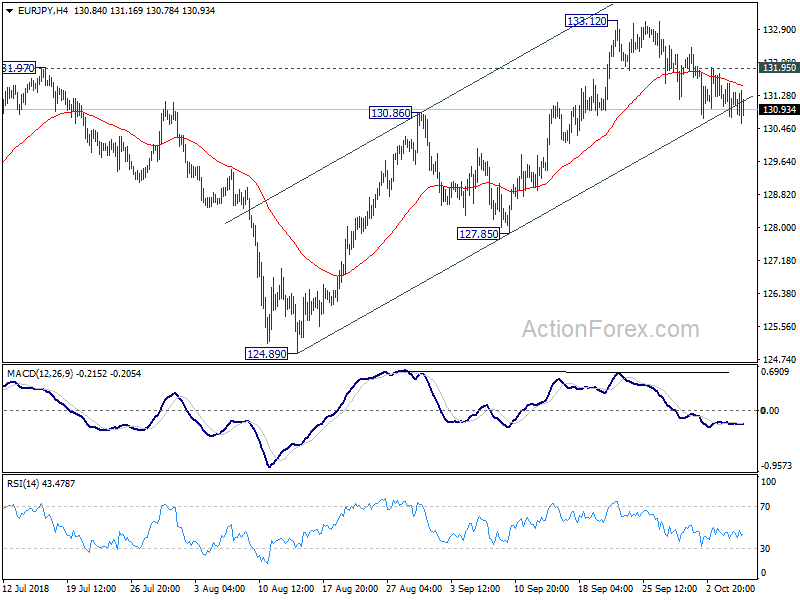
In the bigger picture, current development suggests that EUR/JPY could have defended key support level of 124.08 key resistance turned support. And, the larger up trend from 109.03 (2016 low) is still in progress. Firm break of 137.49 structural resistance will target 141.04/149.76 resistance zone next. This will now be the preferred case as long as 127.85 near term support holds.
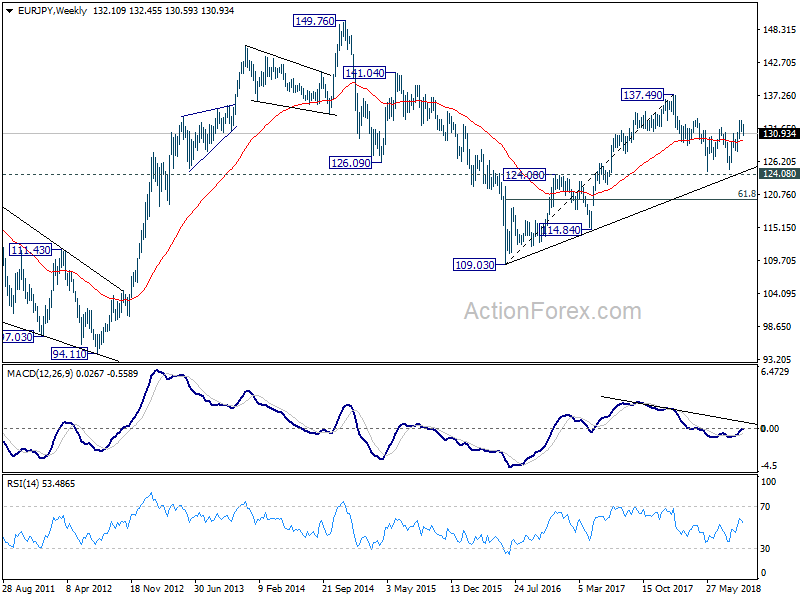
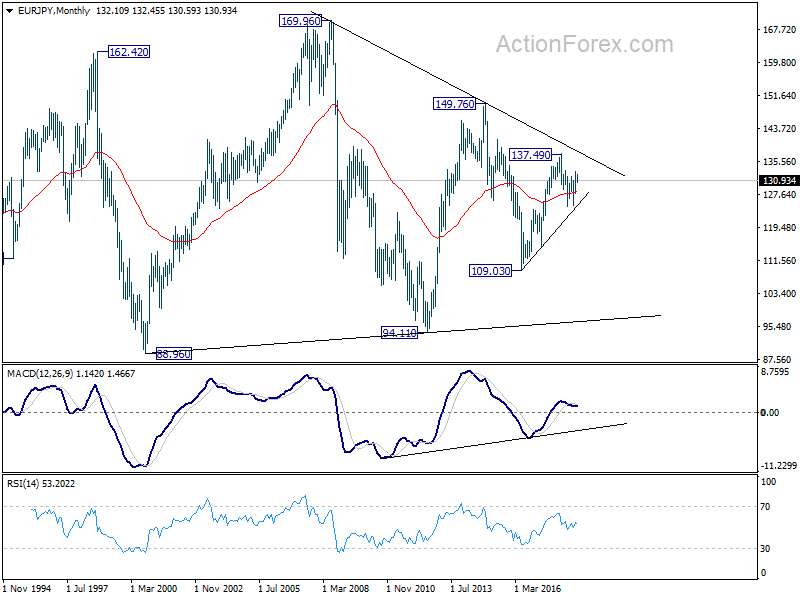
In the long term picture, at this point, EUR/JPY is staying in long term sideway pattern, established since 2000. Rise from 109.03 is seen as a leg inside the pattern. As long as 124.08 support holds, further rally is in favor in medium to long term through 149.76 high. However, break of 124.08 could extend the fall through 109.03 low instead.
EUR/GBP Weekly Outlook
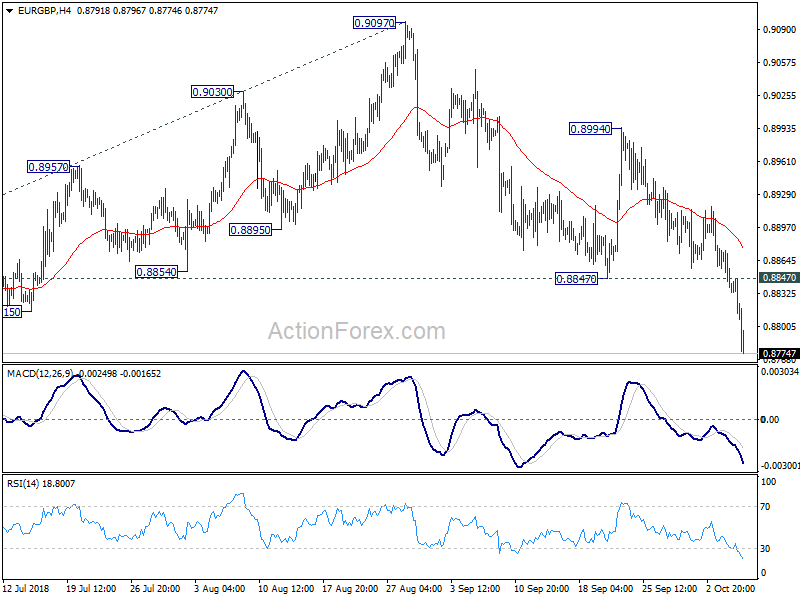
EUR/GBP dropped sharply to as low as 0.8774 last week as fall from 0.9097 resumed. Initial bias stays on the downside this week for 0.8620 low next. Decisive break there will resume whole down trend from 0.9304. In that case, next target will be 100% projection of 0.9305 to 0.8620 from 0.9097 at 0.8412. On the upside, break of 0.8847 support turned resistance is needed to be the first sign of short term bottoming. Otherwise, outlook will remain bearish in case of recovery.
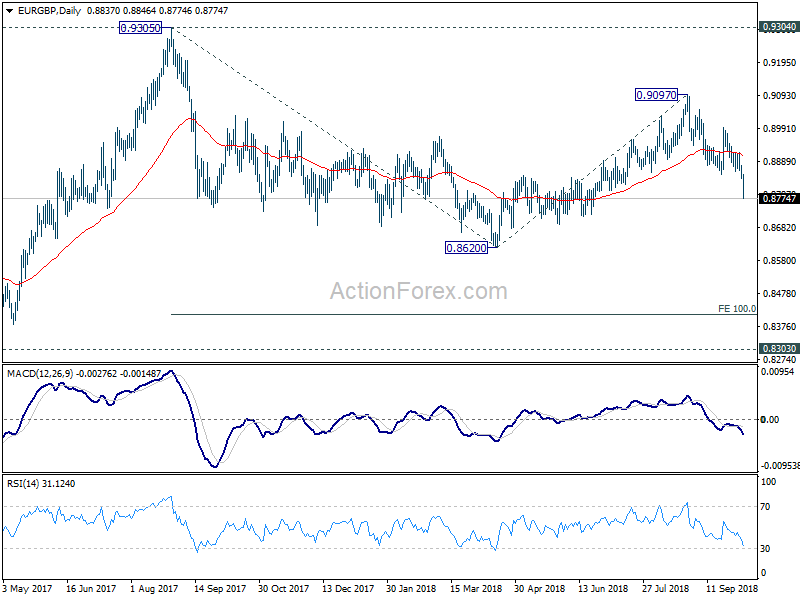
In the bigger picture, EUR/GBP is seen as staying in long term range pattern started at 0.9304 (2016 high). Current development suggests that fall from 0.9303, as a down leg in the pattern, is still in progress. But in case of deeper fall, downside should be contained by 0.8116 cluster support, 50% retracement of 0.6935 (2015 low) to 0.9304 at 0.8120, to bring rebound.
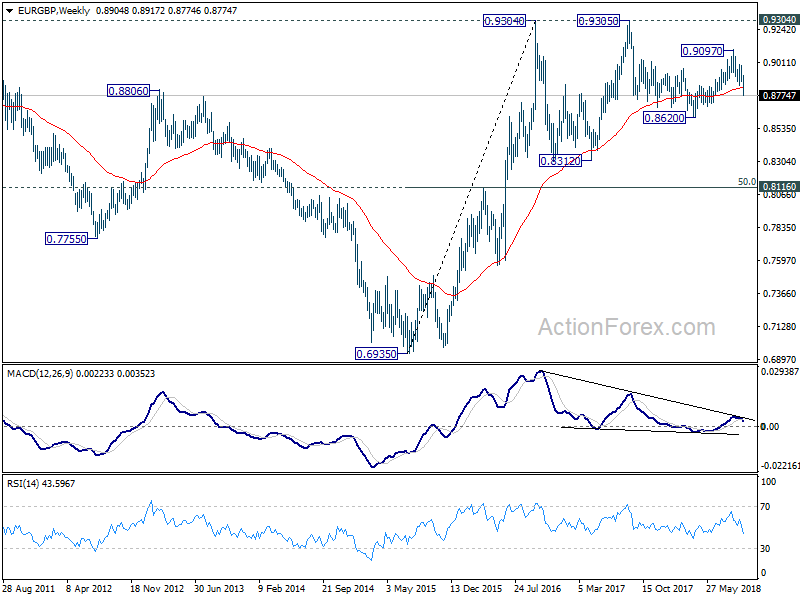
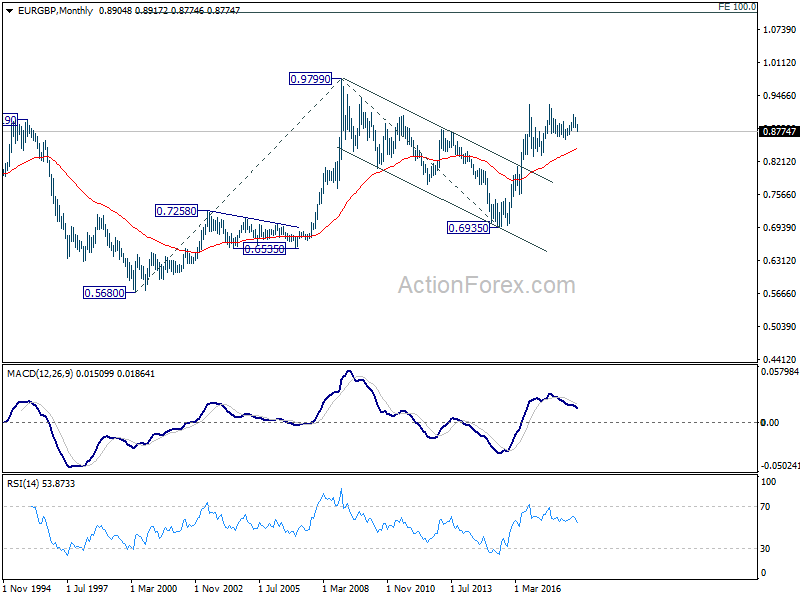
In the long term picture, we're holding on to the view that rise from 0.6935 (2015 low) is resuming the up trend from 0.5680 (2000 low). Hence, after the consolidation from 0.9304 completes, we'd expect another medium term up trend through 0.9799 to 100% projection of 0.5680 to 0.9799 from 0.6935 at 1.1054.
EUR/AUD Weekly Outlook
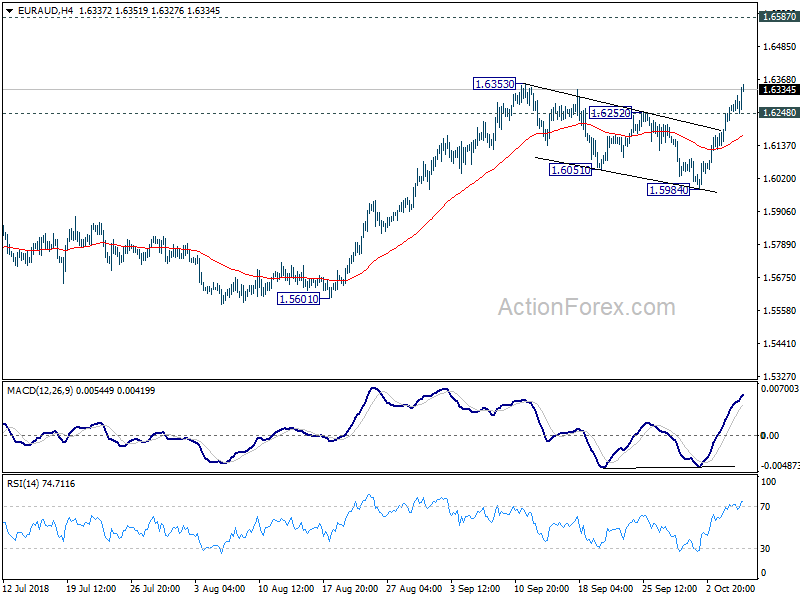
EUR/AUD surged to as high as 1.6351 last week. The development indicates that pull back from 1.6353 has completed with three waves down to 1.5984 already. And the larger up trend is ready to resume. Initial bias stays on the upside this week. Decisive break of 1.6353 will confirm this bullish case and target 1.6857 key resistance next. On the downside, below 1.6248 minor support will turn intraday bias neutral and bring retreat. But downside should be contained well above 1.5984 support to bring another rally.
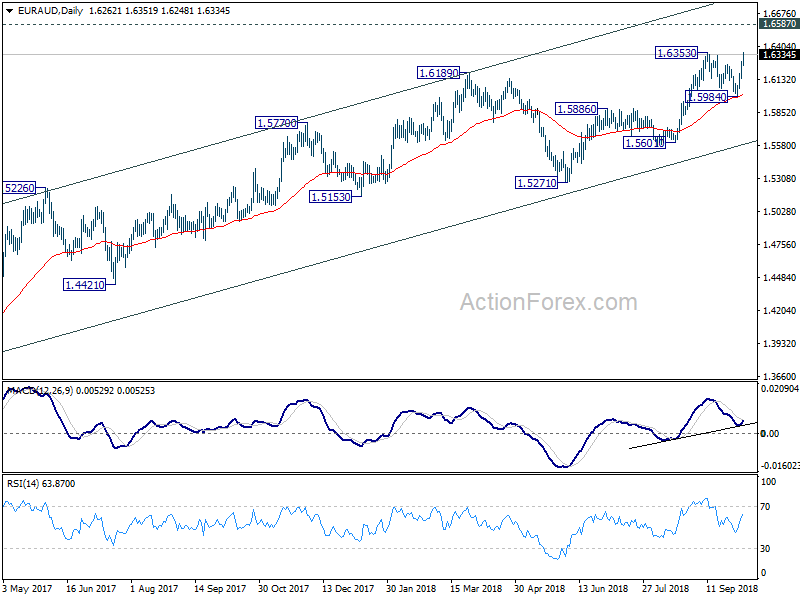
In the bigger picture, up trend from 1.3624 (2017 low) is still in progress. Further rise should be seen to retest 1.6587 (2015 high). Decisive break there will resume the long term rally and target 1.7488 fibonacci level. On the downside, break of 1.5984 support is need to be the first sign of medium term reversal. Otherwise, outlook will remain bullish in case of deep pull back.
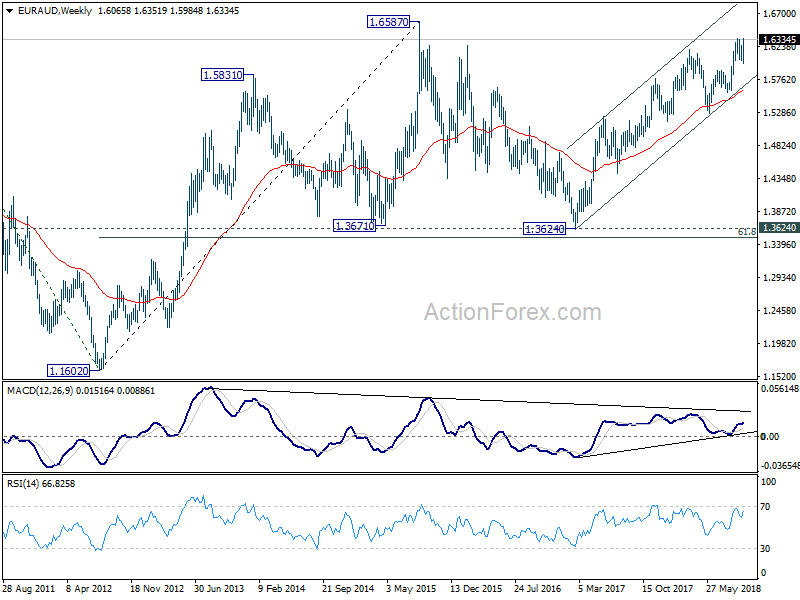
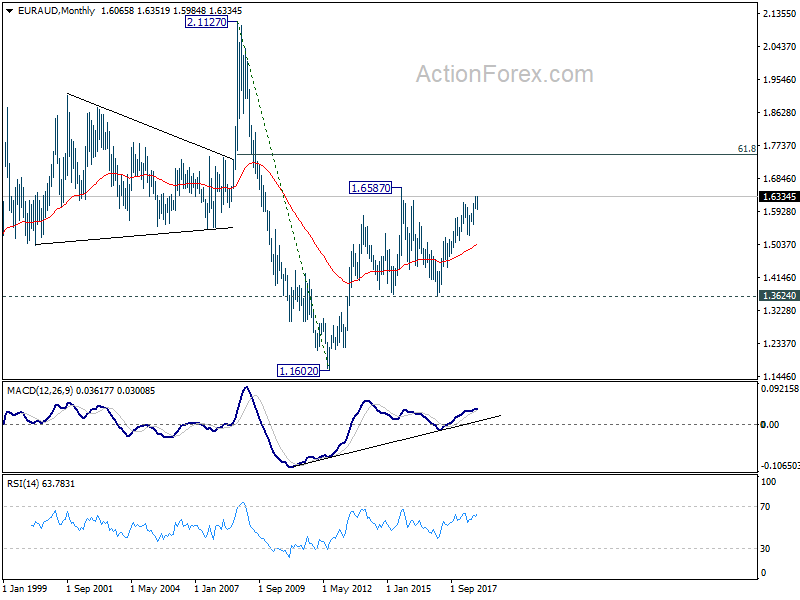
In the longer term picture, the rise from 1.1602 long term bottom (2012 low) isn't over yet. We'll keep monitoring the development but there is prospect of extending the rise to 61.8% retracement of 2.1127 to 1.1602 at 1.7488 and above. However, sustained trading below 1.3624 key support should indicate long term reversal and target 1.1602 long term bottom again.
EUR/CHF Weekly Outlook
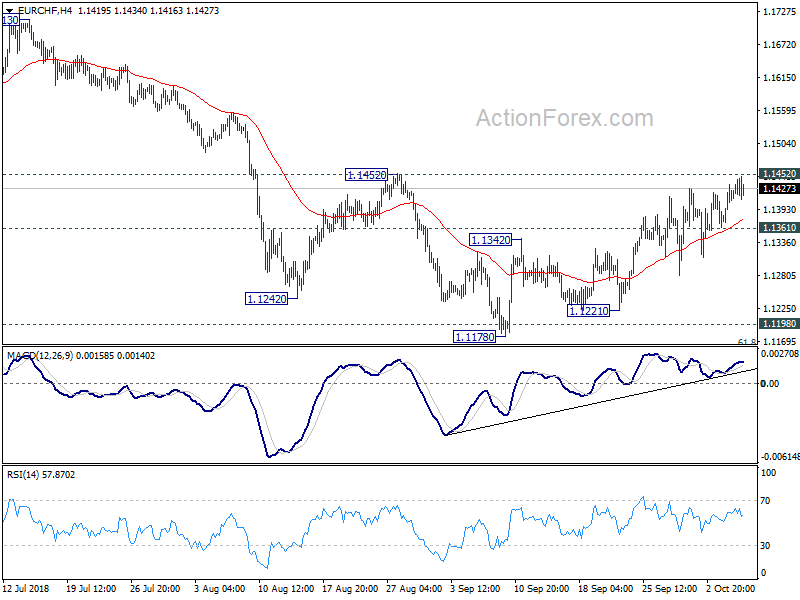
EUR/CHF gyrated higher last week but cannot take out 1.1452 resistance yet. Initial bias remains neutral this week first. ON the upside, decisive break of 1.1452 resistance should confirm bullish reversal, after drawing strong support from 1.1154/98 zone. In that case, outlook will be turned bullish for 1.1713 resistance next. On the downside, however, break of 1.1361 minor support will suggest rejection by 1.1452. And intraday bias will be turned back to the downsides for retesting 1.1154/98.
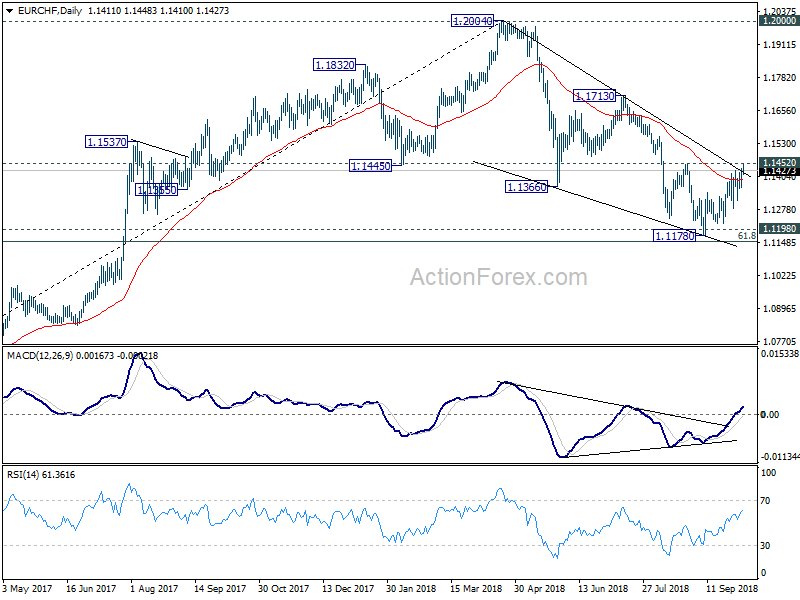
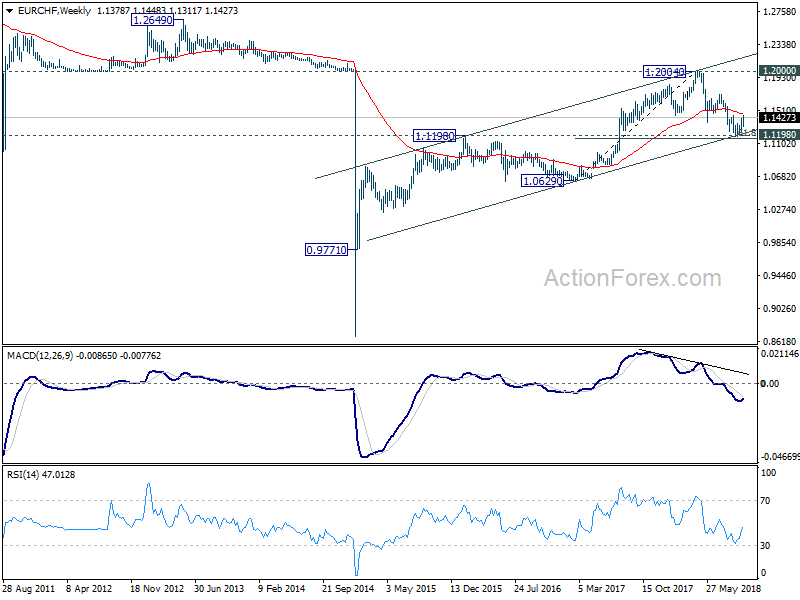
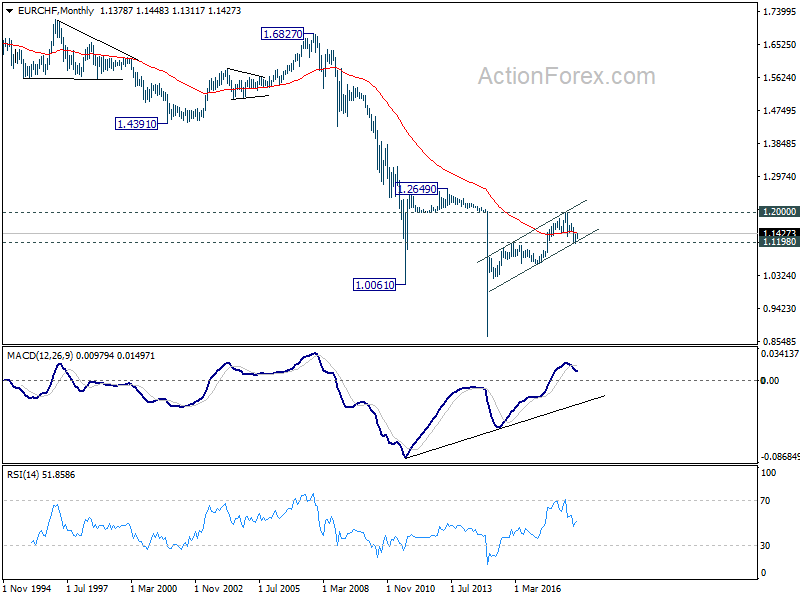
In the bigger picture, price actions from 1.2004 medium term top is seen as a correction only. Downside should be contained by support zone of 1.1198 (2016 high) and 61.8% retracement of 1.0629 to 1.2004 at 1.1154 to complete it and bring rebound. This cluster level is in proximity to long term channel support (now at 1.1234) too. A break of 1.2 key resistance is still expected in the medium term long term. However, sustained break of the mentioned support zone will mark reversal of the long term trend. In that case, 1.0629 key support will be back into focus.
Dollar Surged on Treasury Yields and Bets on Fed Hikes, Except Versus Sterling
It's another week's that's full of headlines. Sterling ended as the strongest one on revised hope of a Brexit deal with the EU despite all the rhetorics. UK Prime Minister Theresa May also survived the Conservative Party conference without dance but no disaster. Dollar followed as the second strongest as boosted by strong economy data as well as strong rally in treasury yields. Friday's mixed non-farm payroll could be a disappointment but the overall economic outlook is greater than good.
Yen is the third strongest one as partly supported by surging JGB yields. Also, rising global yields triggered risk aversions to towards the end of the week and helped lift the Yen. Canadian Dollar is the fourth. After initial boost by the trilateral trade deal with the US and Mexico, the USMCA, there was no follow through buying in the Loonie despite strong job data and oil price.
Euro somehow avoided broad based selloff after Italy revised its budget targets to more "acceptable" ones. But's unsure how that is assessed by the EU eventually. And there are risks of downgrade ahead on Italy before the month end. Australian Dollar and New Zealand Dollar are the weakest ones. They're firstly pressured by monetary policy divergence, secondly by risk aversion, in particular in Asia.
Looking ahead, the economic calendar is relatively light this week. A major focus is on how US treasury yields are going to extend the uptrend after taking out key resistance level last week. Also, US inflation data could have a hand on the momentum of yields. In turn, strength in yields might continue to pressure global equities, which even US indices tumbled towards the end of last week. And of course, China is back from holiday and could immediate face a disastrous open in its stock markets. And, it's uncertain how far Brexit optimism could take Sterling to.
Markets increasing bets on Fed's rate hikes next year
Markets have increased their bets on Fed's rate hike next year after a week of hawkish Fed rhetorics, surging treasury yields and solid economic data. Fed Chair Jerome Powell described that there's a "remarkably positive outlook" in the economy. Various forecasts predicted such favorable conditions to continue. And Powell said these forecasts are "not too good to be true". That's actually not much of a surprise based on recent comments from Powell.
The surprise was indeed the hawkish turn of Atlanta Fed President Raphael Bostic, which has been persistently cautioning flattening yield curve. He pledged before that "I will not vote for anything that will knowingly invert the curve". But on Friday, he said that "Current conditions suggest, to me, that we ought to get to a policy stance where our foot is neither on the gas pedal - what we call an accommodative policy - nor on the brakes - what we call a restrictive policy". That is, he is now pushing to hike till neutral. Furthermore, he also said he may have underestimated aggregate demand. And, "If that's the case, the potential for overheating would require a higher path for rates than what I had been thinking,"
For Fed, a December hike to 2.25-2.50% is already like a done deal, so we'd look beyond that. For March 2019, fed fund futures are pricing in 57% of another hike to 2.50-2.75% or more. That compares to 46% a week ago, and 35% a month ago.
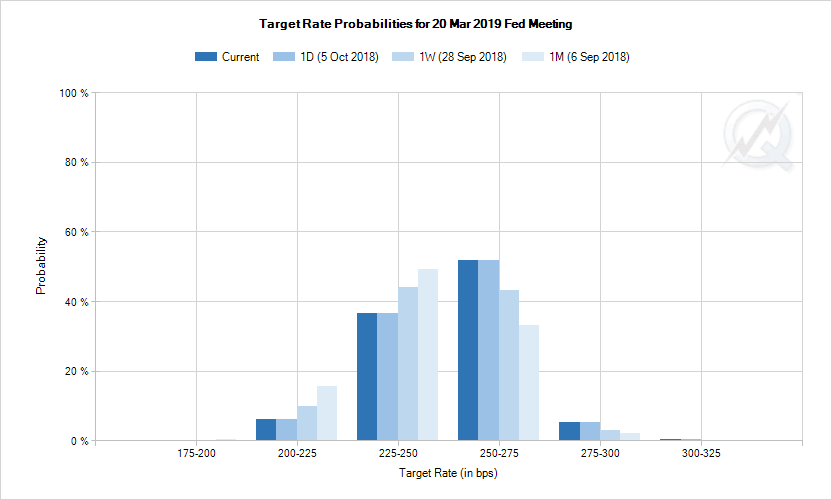
For June 2019, fed fund futures are pricing in over 41% chance of another hike to 2.75-3.00%. That's admittedly still below 50%. But there was a notable increase from 29% a week ago and more than double of 16% a month ago.
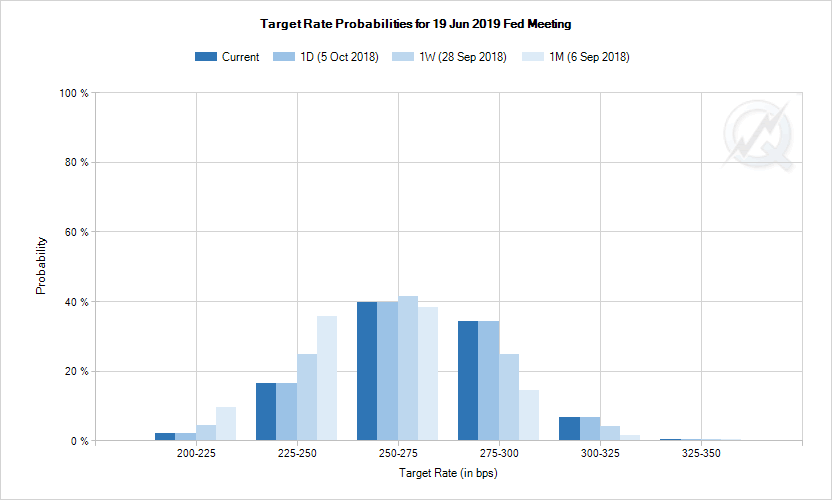
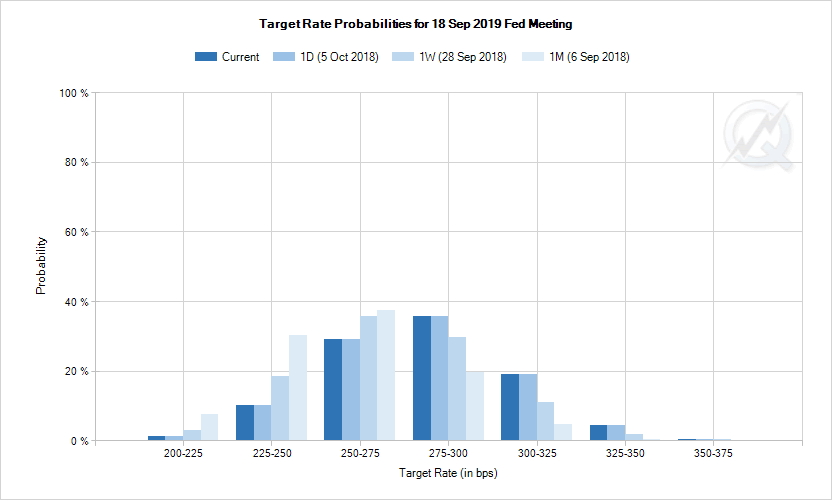
For September 2019, fed fund futures are pricing in 23% chance of one more hike to 3.00-3.25%. That compares to 13% a week ago, and just 5% a month ago. So overall, the markets are now more convinced that Fed is on it's path for another three hikes next year.
US treasury yields strong at the long end, broke key resistance levels
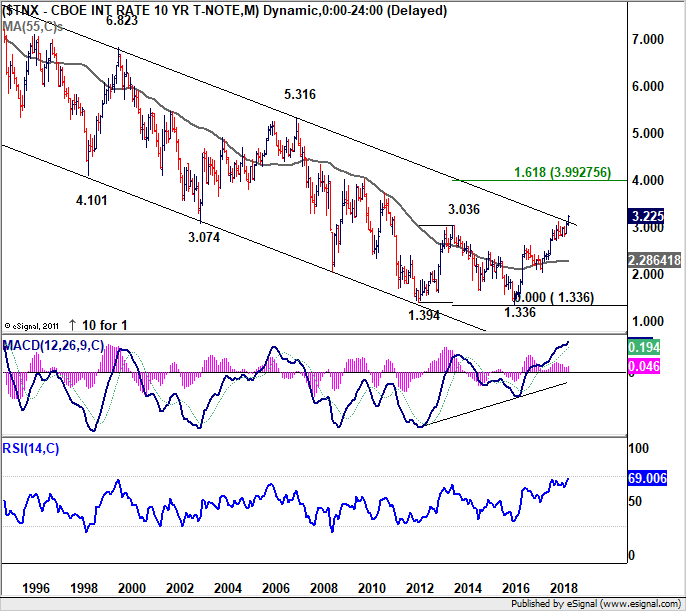
Surging US treasury yields, which took global yields higher too, was a factor that boosted Fed's change of continuing with rate hikes. In particular, more strength is seen in the long end. 5-year yield closed up 0.123 at 3.071. 10-year yield rose 0.169 to 3.225. 30-year gained 0.198 to 3.395. Such development should be welcomed by Fed officials who are concerned with flattening yield curves.
From a technical perspective, TNX's (10-year yield) next target will be 61.8% projection of 2.034 to 3.115 from 2.808 at 3.476, after taking out 3.115 key resistance.
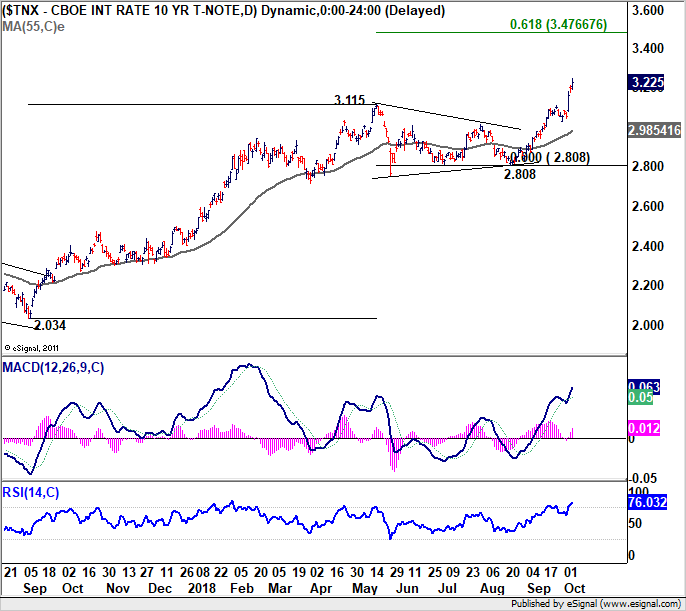
We've pointed out numerous times that TNX has now broken multi-decade channel resistance, which is era defining. It remains to be seen if TNX could really start a new multi-decade up trend. But the signs are promising so far, with a double bottom formation completed (1.394, 1.336). The real test for the medium term will be 161.8% projection of 1.394 to 3.306 from 1.336 at 3.992, which is close to 4.000 psychological level.
 DOW closed the week down after hitting record high
DOW jumped to record high at 26951.81 last week but retreated sharply to close the week lower at 26447.05. Breach of 26349.34 support suggests short term topping. But there is not indication of trend reversal yet. Outlook will stay bullish as long as 55 day EMA (now at 25945.25) holds. The record run is expected to resume sooner or later.
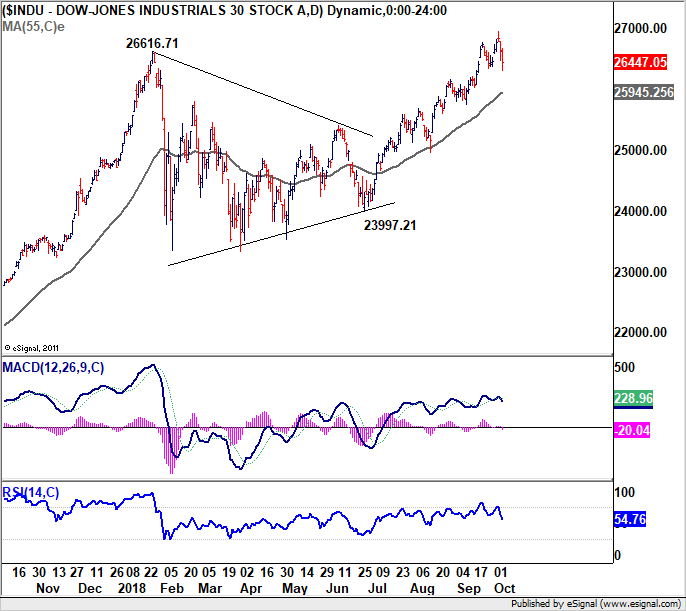
However, it's believed that the steep pull back in DOW was caused by the sharp rally in yields. If that the case, the road ahead for US stocks will be bumpy, given that we expect yields to continue their rally. From a technical perspective, we're like to point out one interpretation.
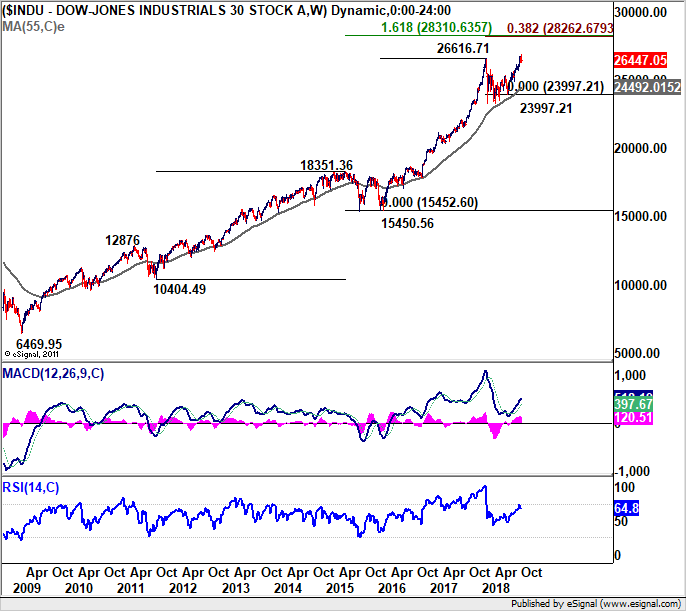
That is, current rise from 23997.21 is the fifth wave of the up trend from 15450.56 (2016 low). And the rise from 15450.56 is the fifth wave of the whole up trend from 6469.96 (2009 low, the bottom of the last financial crisis).
There is a cluster projection level to watch, 138.2% projection of 15450.56 to 25515.71 from 23997.21 at 28262.67, and 161.8% projection of 10404.49 to 18351.36 from 15450.56 at 28310.63.
That is, 28262/28310 is possibly a significant resistance level for DOW to breakthrough. We'll see how it goes.
Dollar index might retest 96.98, but no clear sign of breakout yet
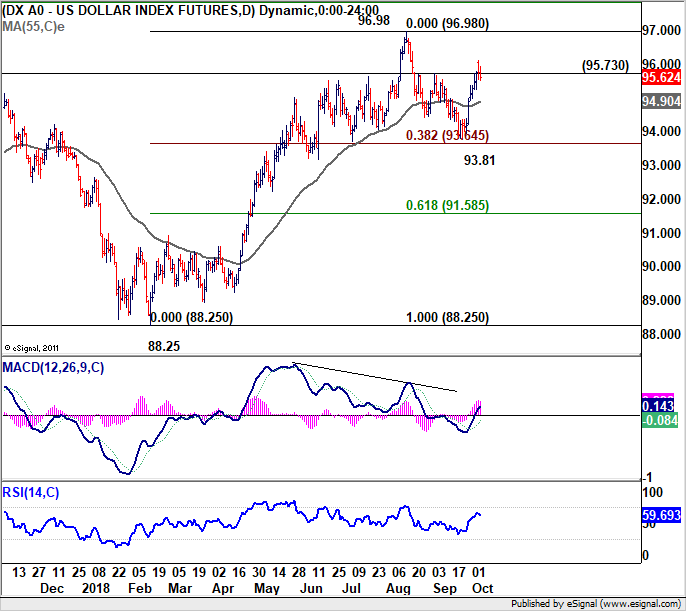
Now, back to the Dollar index, the break of 95.73 resistance is in line with our expectations. Further rise is expected in near term. But there is not enough evidence to suggests up trend resumption yet. Hence, we'd be cautious on topping below 96.98 high. That is equivalent to 1.1300 bottom in EUR/USD. Nonetheless, the range should be set even if Dollar index is going to extend the correction from 96.98 with another fall. That is, downside should be contained by 38.2% retracement of 88.25 to 96.98 at 93.64.
Position trading
** Quick update at 0900GMT Oct 7, Sunday. China announces to lower RRR for some banks by 1% to release CNY 750B of funds (more details here). The move could trigger a rebound in Asian stocks on Monday, as well as AUD/USD. For now, it's hard to predict how strong the market reaction is. So, we'll CANCEL the AUD/USD short strategy, and wait-and-see first.
Our GBP/USD short (sold at 1.3150) was closed at 1.3079 with 71 pips profits as updated here. To recap, we made a big mistake in the view on EUR/GBP. The decline from 0.9097 was believed to have completed at 0.8847. The pull back from 0.8894 was corrective looking all the way, until downside acceleration after breaking 0.8847, which invalidated our view. Therefore, the anticipated rally in EUR/GBP which should drag down GBP/USD further didn't happen.
Looking ahead, firstly, we'd expect global treasury yields rally to continue, as led by US. Thus, there is risk of deeper short term pull back in US equities. That should be a factor weighing down Asian markets. Additionally, let's not forget that the Hong Kong stocks reacted negatively after the announcement of the USMCA trade deal. That's something seen as rather negative for China, which was on holiday. Adding to that, rhetorics and news against China's improper practices heated up last week, highlighted by US Vice President Mike Pence's speech. Chinese stocks should come back from holiday sharply lower. And, focus will be back on key support at 2638 for Shanghai SSE. A break there could trigger some contagion effect to other parts of Asia.
AUD/USD's break of 0.7084 support confirmed medium term down trend resumption last week. And based on the above anticipated developments, there would only be more downside for Aussie. Indeed, from a pure technical point of view, medium term fall from 0.8135 might even be resuming the long term down trend from 1.1079 (2011 high).
We'll sell AUD/USD at 0.7100, slightly above 0.7096 minor resistance. Stop will be placed at 0.7185, slightly above 50% retracement of 0.7314 to 0.7041 at 0.7178. 0.6826 is the first target, which gives risk/reward at 1/3.22. We'll monitor both AUD/USD and EUR/AUD, as both 0.6826 and 1.6587 are key levels, to decide if we'll get out earlier, or hold through the target.
EUR/GBP Weekly Outlook
EUR/GBP dropped sharply to as low as 0.8774 last week as fall from 0.9097 resumed. Initial bias stays on the downside this week for 0.8620 low next. Decisive break there will resume whole down trend from 0.9304. In that case, next target will be 100% projection of 0.9305 to 0.8620 from 0.9097 at 0.8412. On the upside, break of 0.8847 support turned resistance is needed to be the first sign of short term bottoming. Otherwise, outlook will remain bearish in case of recovery.
In the bigger picture, EUR/GBP is seen as staying in long term range pattern started at 0.9304 (2016 high). Current development suggests that fall from 0.9303, as a down leg in the pattern, is still in progress. But in case of deeper fall, downside should be contained by 0.8116 cluster support, 50% retracement of 0.6935 (2015 low) to 0.9304 at 0.8120, to bring rebound.
In the long term picture, we're holding on to the view that rise from 0.6935 (2015 low) is resuming the up trend from 0.5680 (2000 low). Hence, after the consolidation from 0.9304 completes, we'd expect another medium term up trend through 0.9799 to 100% projection of 0.5680 to 0.9799 from 0.6935 at 1.1054.