

Sample Category Title
Dollar Surged on Treasury Yields and Bets on Fed Hikes, Except Versus Sterling
It's another week's that's full of headlines. Sterling ended as the strongest one on revised hope of a Brexit deal with the EU despite all the rhetorics. UK Prime Minister Theresa May also survived the Conservative Party conference without dance but no disaster. Dollar followed as the second strongest as boosted by strong economy data as well as strong rally in treasury yields. Friday's mixed non-farm payroll could be a disappointment but the overall economic outlook is greater than good.
Yen is the third strongest one as partly supported by surging JGB yields. Also, rising global yields triggered risk aversions to towards the end of the week and helped lift the Yen. Canadian Dollar is the fourth. After initial boost by the trilateral trade deal with the US and Mexico, the USMCA, there was no follow through buying in the Loonie despite strong job data and oil price.
Euro somehow avoided broad based selloff after Italy revised its budget targets to more "acceptable" ones. But's unsure how that is assessed by the EU eventually. And there are risks of downgrade ahead on Italy before the month end. Australian Dollar and New Zealand Dollar are the weakest ones. They're firstly pressured by monetary policy divergence, secondly by risk aversion, in particular in Asia.
Looking ahead, the economic calendar is relatively light this week. A major focus is on how US treasury yields are going to extend the uptrend after taking out key resistance level last week. Also, US inflation data could have a hand on the momentum of yields. In turn, strength in yields might continue to pressure global equities, which even US indices tumbled towards the end of last week. And of course, China is back from holiday and could immediate face a disastrous open in its stock markets. And, it's uncertain how far Brexit optimism could take Sterling to.
Markets increasing bets on Fed's rate hikes next year
Markets have increased their bets on Fed's rate hike next year after a week of hawkish Fed rhetorics, surging treasury yields and solid economic data. Fed Chair Jerome Powell described that there's a "remarkably positive outlook" in the economy. Various forecasts predicted such favorable conditions to continue. And Powell said these forecasts are "not too good to be true". That's actually not much of a surprise based on recent comments from Powell.
The surprise was indeed the hawkish turn of Atlanta Fed President Raphael Bostic, which has been persistently cautioning flattening yield curve. He pledged before that "I will not vote for anything that will knowingly invert the curve". But on Friday, he said that "Current conditions suggest, to me, that we ought to get to a policy stance where our foot is neither on the gas pedal - what we call an accommodative policy - nor on the brakes - what we call a restrictive policy". That is, he is now pushing to hike till neutral. Furthermore, he also said he may have underestimated aggregate demand. And, "If that's the case, the potential for overheating would require a higher path for rates than what I had been thinking,"
For Fed, a December hike to 2.25-2.50% is already like a done deal, so we'd look beyond that. For March 2019, fed fund futures are pricing in 57% of another hike to 2.50-2.75% or more. That compares to 46% a week ago, and 35% a month ago.
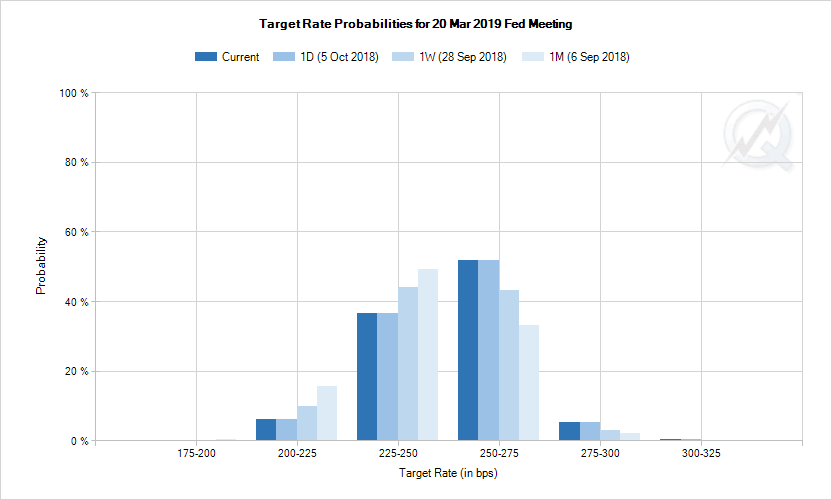
For June 2019, fed fund futures are pricing in over 41% chance of another hike to 2.75-3.00%. That's admittedly still below 50%. But there was a notable increase from 29% a week ago and more than double of 16% a month ago.
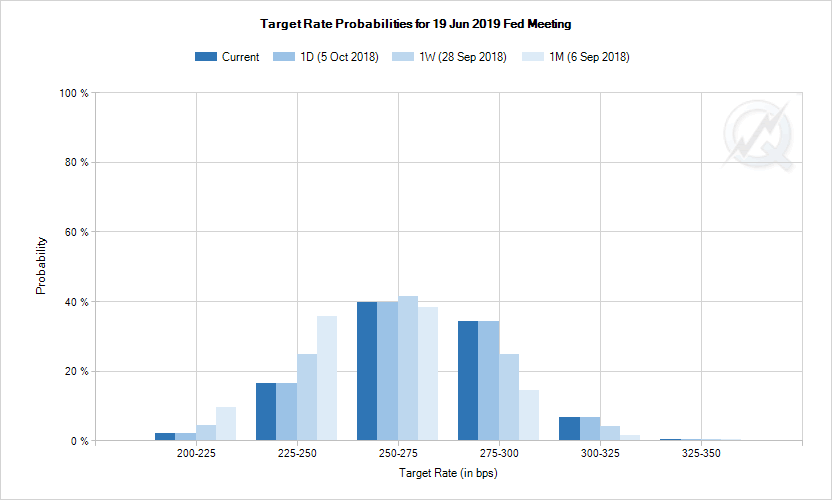
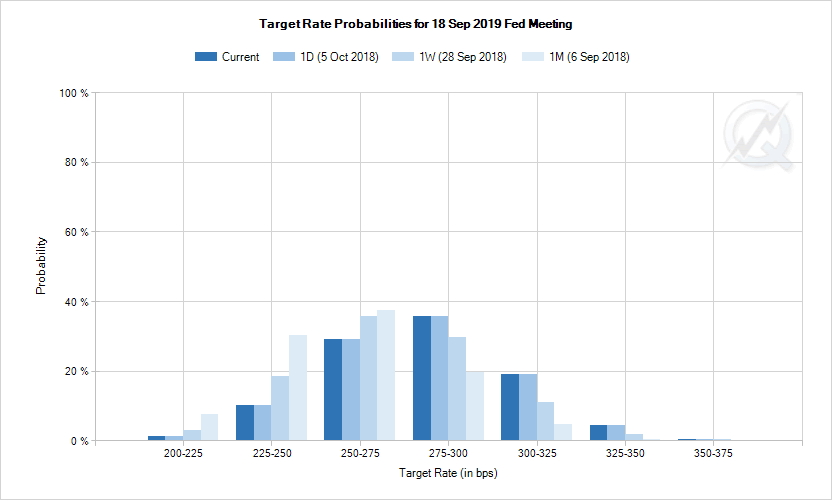
For September 2019, fed fund futures are pricing in 23% chance of one more hike to 3.00-3.25%. That compares to 13% a week ago, and just 5% a month ago. So overall, the markets are now more convinced that Fed is on it's path for another three hikes next year.
US treasury yields strong at the long end, broke key resistance levels
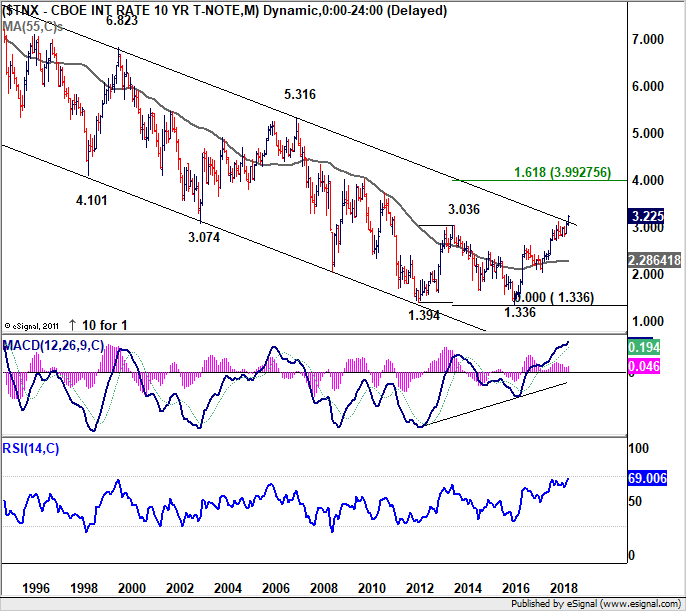
Surging US treasury yields, which took global yields higher too, was a factor that boosted Fed's change of continuing with rate hikes. In particular, more strength is seen in the long end. 5-year yield closed up 0.123 at 3.071. 10-year yield rose 0.169 to 3.225. 30-year gained 0.198 to 3.395. Such development should be welcomed by Fed officials who are concerned with flattening yield curves.
From a technical perspective, TNX's (10-year yield) next target will be 61.8% projection of 2.034 to 3.115 from 2.808 at 3.476, after taking out 3.115 key resistance.
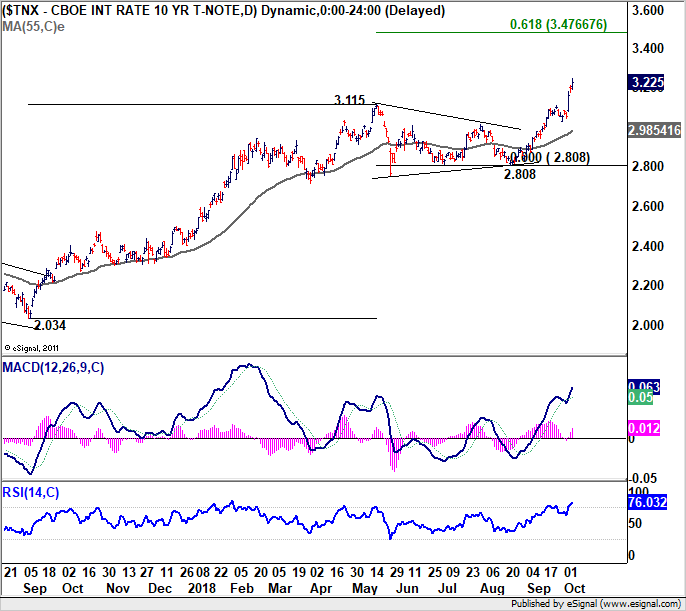
We've pointed out numerous times that TNX has now broken multi-decade channel resistance, which is era defining. It remains to be seen if TNX could really start a new multi-decade up trend. But the signs are promising so far, with a double bottom formation completed (1.394, 1.336). The real test for the medium term will be 161.8% projection of 1.394 to 3.306 from 1.336 at 3.992, which is close to 4.000 psychological level.
 DOW closed the week down after hitting record high
DOW jumped to record high at 26951.81 last week but retreated sharply to close the week lower at 26447.05. Breach of 26349.34 support suggests short term topping. But there is not indication of trend reversal yet. Outlook will stay bullish as long as 55 day EMA (now at 25945.25) holds. The record run is expected to resume sooner or later.
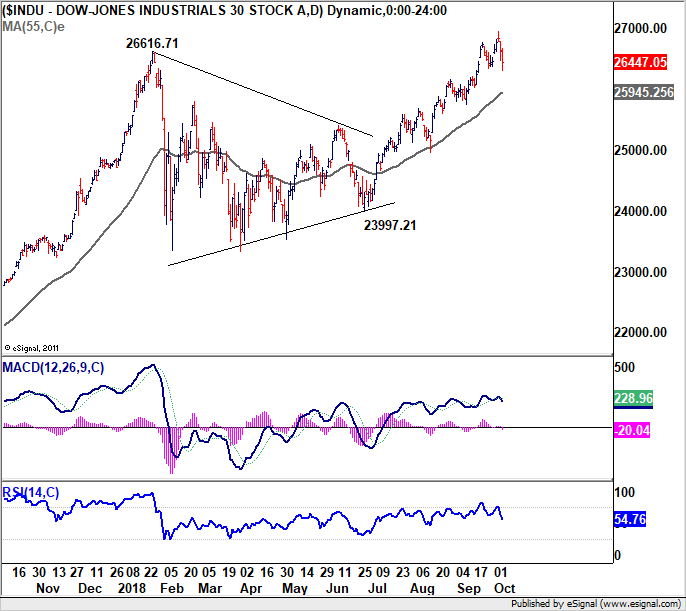
However, it's believed that the steep pull back in DOW was caused by the sharp rally in yields. If that the case, the road ahead for US stocks will be bumpy, given that we expect yields to continue their rally. From a technical perspective, we're like to point out one interpretation.
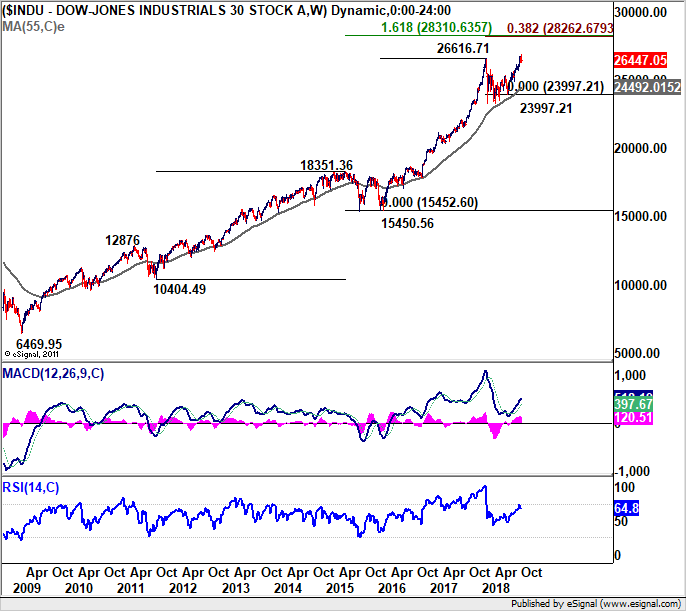
That is, current rise from 23997.21 is the fifth wave of the up trend from 15450.56 (2016 low). And the rise from 15450.56 is the fifth wave of the whole up trend from 6469.96 (2009 low, the bottom of the last financial crisis).
There is a cluster projection level to watch, 138.2% projection of 15450.56 to 25515.71 from 23997.21 at 28262.67, and 161.8% projection of 10404.49 to 18351.36 from 15450.56 at 28310.63.
That is, 28262/28310 is possibly a significant resistance level for DOW to breakthrough. We'll see how it goes.
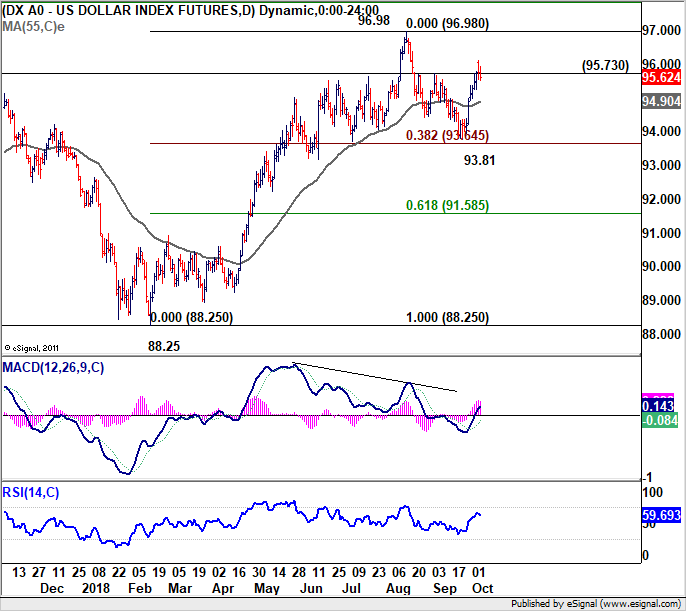
Dollar index might retest 96.98, but no clear sign of breakout yet
Now, back to the Dollar index, the break of 95.73 resistance is in line with our expectations. Further rise is expected in near term. But there is not enough evidence to suggests up trend resumption yet. Hence, we'd be cautious on topping below 96.98 high. That is equivalent to 1.1300 bottom in EUR/USD. Nonetheless, the range should be set even if Dollar index is going to extend the correction from 96.98 with another fall. That is, downside should be contained by 38.2% retracement of 88.25 to 96.98 at 93.64.
Position trading
** Quick update at 0900GMT Oct 7, Sunday. China announces to lower RRR for some banks by 1% to release CNY 750B of funds (more details here). The move could trigger a rebound in Asian stocks on Monday, as well as AUD/USD. For now, it's hard to predict how strong the market reaction is. So, we'll CANCEL the AUD/USD short strategy, and wait-and-see first.
Our GBP/USD short (sold at 1.3150) was closed at 1.3079 with 71 pips profits as updated here. To recap, we made a big mistake in the view on EUR/GBP. The decline from 0.9097 was believed to have completed at 0.8847. The pull back from 0.8894 was corrective looking all the way, until downside acceleration after breaking 0.8847, which invalidated our view. Therefore, the anticipated rally in EUR/GBP which should drag down GBP/USD further didn't happen.
Looking ahead, firstly, we'd expect global treasury yields rally to continue, as led by US. Thus, there is risk of deeper short term pull back in US equities. That should be a factor weighing down Asian markets. Additionally, let's not forget that the Hong Kong stocks reacted negatively after the announcement of the USMCA trade deal. That's something seen as rather negative for China, which was on holiday. Adding to that, rhetorics and news against China's improper practices heated up last week, highlighted by US Vice President Mike Pence's speech. Chinese stocks should come back from holiday sharply lower. And, focus will be back on key support at 2638 for Shanghai SSE. A break there could trigger some contagion effect to other parts of Asia.
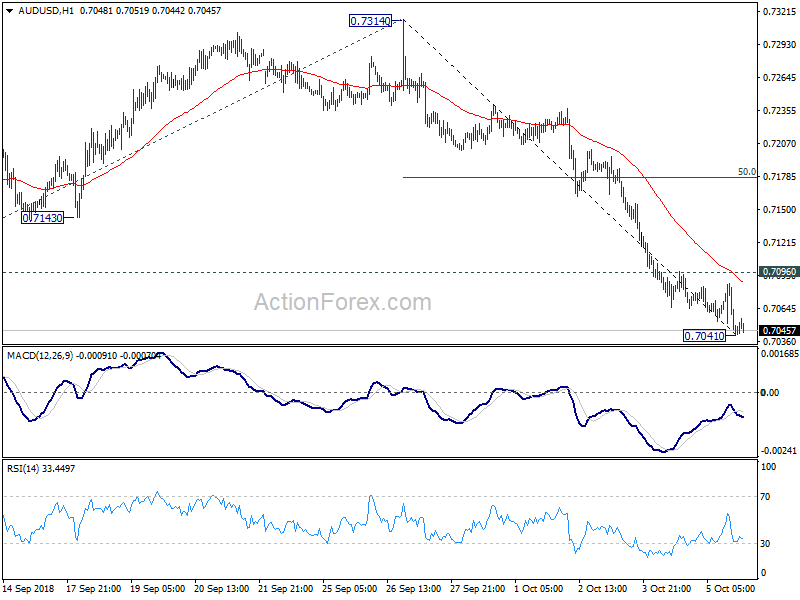
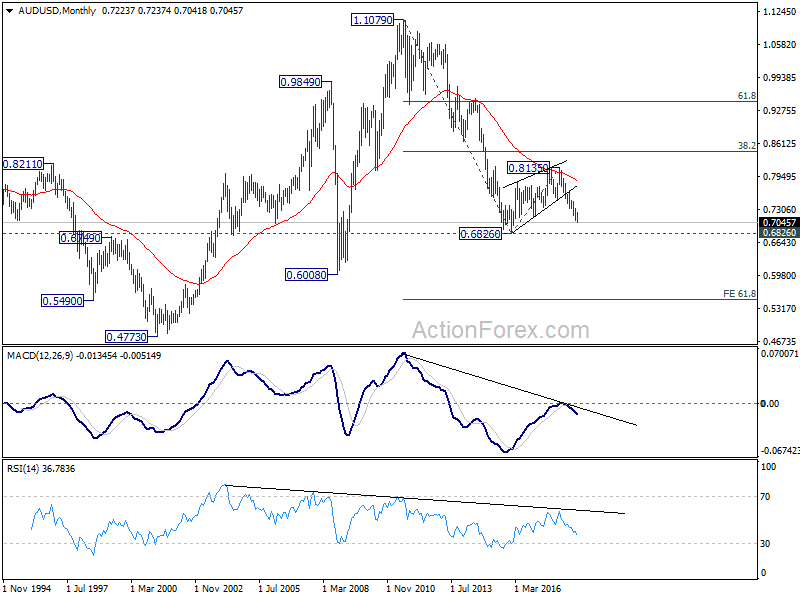
AUD/USD's break of 0.7084 support confirmed medium term down trend resumption last week. And based on the above anticipated developments, there would only be more downside for Aussie. Indeed, from a pure technical point of view, medium term fall from 0.8135 might even be resuming the long term down trend from 1.1079 (2011 high).
We'll sell AUD/USD at 0.7100, slightly above 0.7096 minor resistance. Stop will be placed at 0.7185, slightly above 50% retracement of 0.7314 to 0.7041 at 0.7178. 0.6826 is the first target, which gives risk/reward at 1/3.22. We'll monitor both AUD/USD and EUR/AUD, as both 0.6826 and 1.6587 are key levels, to decide if we'll get out earlier, or hold through the target.
EUR/GBP Weekly Outlook
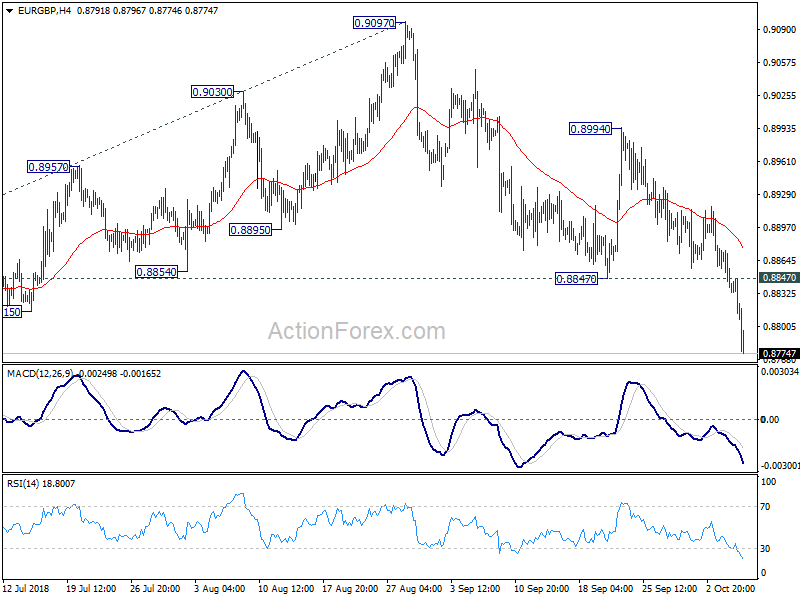
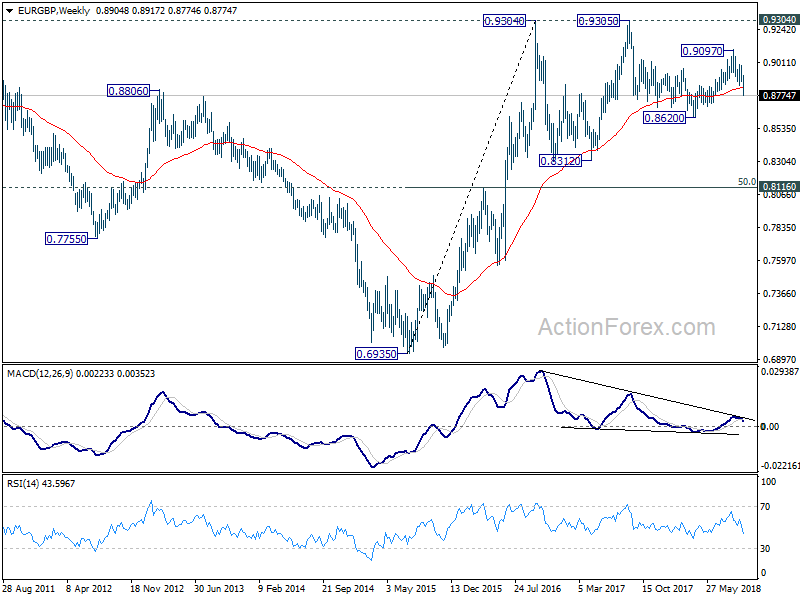
EUR/GBP dropped sharply to as low as 0.8774 last week as fall from 0.9097 resumed. Initial bias stays on the downside this week for 0.8620 low next. Decisive break there will resume whole down trend from 0.9304. In that case, next target will be 100% projection of 0.9305 to 0.8620 from 0.9097 at 0.8412. On the upside, break of 0.8847 support turned resistance is needed to be the first sign of short term bottoming. Otherwise, outlook will remain bearish in case of recovery.
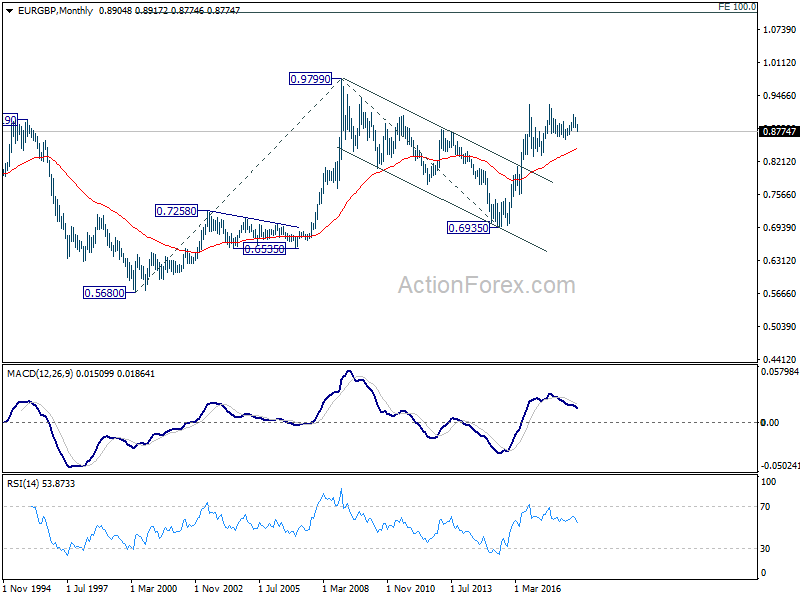
In the bigger picture, EUR/GBP is seen as staying in long term range pattern started at 0.9304 (2016 high). Current development suggests that fall from 0.9303, as a down leg in the pattern, is still in progress. But in case of deeper fall, downside should be contained by 0.8116 cluster support, 50% retracement of 0.6935 (2015 low) to 0.9304 at 0.8120, to bring rebound.
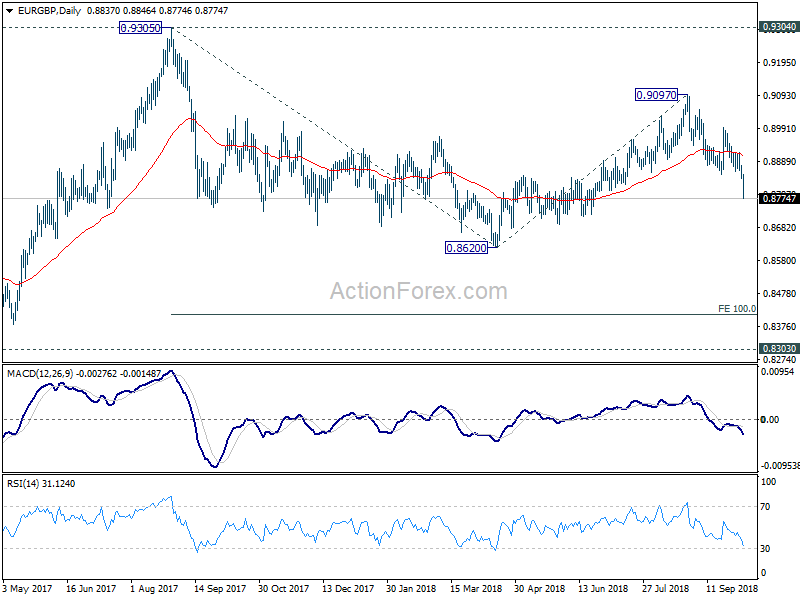
In the long term picture, we're holding on to the view that rise from 0.6935 (2015 low) is resuming the up trend from 0.5680 (2000 low). Hence, after the consolidation from 0.9304 completes, we'd expect another medium term up trend through 0.9799 to 100% projection of 0.5680 to 0.9799 from 0.6935 at 1.1054.
Summary 10/8 – 10/12
Monday, Oct 8, 2018
[php_everywhere instance="1"]
Tuesday, Oct 9, 2018
[php_everywhere instance="2"]
Wednesday, Oct 10 2018
[php_everywhere instance="3"]
Thursday, Oct 11, 2018
[php_everywhere instance="4"]
Friday, Oct 12, 2018
[php_everywhere instance="5"]
Weekly Economic and Financial Commentary: Not Good, They’re Great!!!
Weekly Economic and Financial Commentary
U.S. Review
Hurricane Distortions Hold Back September Job Growth
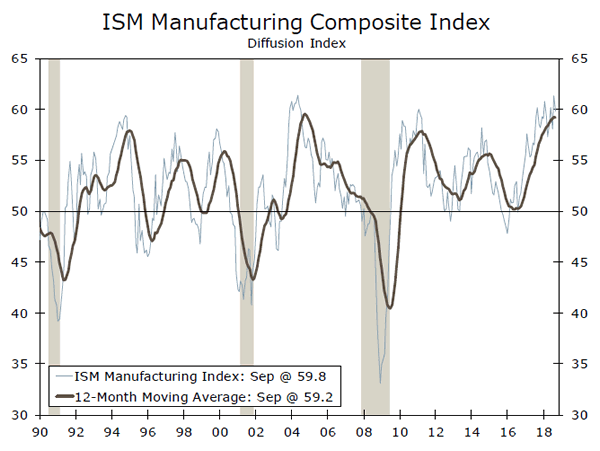
- The September ISM Manufacturing Index came in slightly below expectations, at 59.8, but remains above its average for the past year.
- Motor vehicle sales substantially topped expectations in September, climbing to a 17.4-million unit pace.
- Factory orders climbed at the fastest pace in August in nearly a year, suggesting business fixed investment rose solidly in Q3.
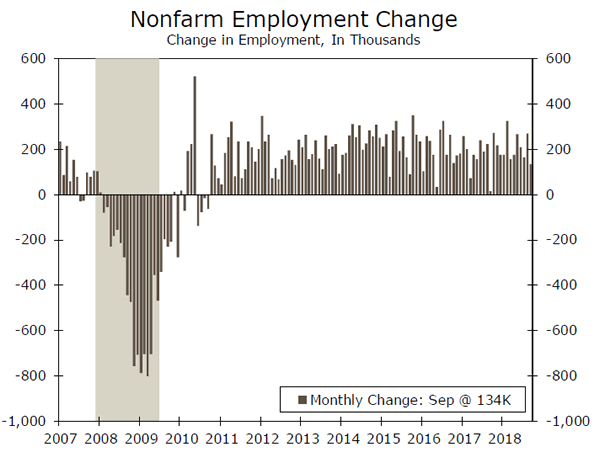
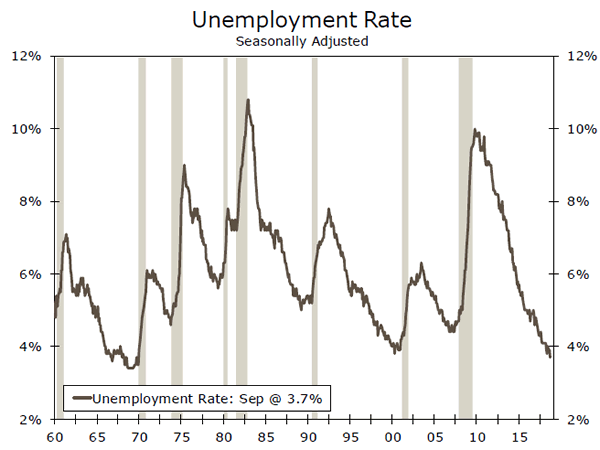
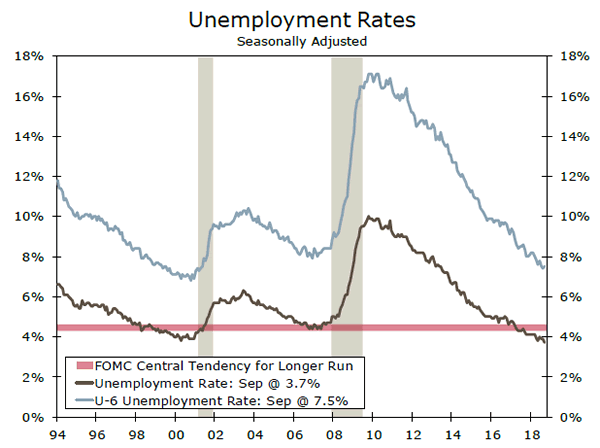
- Employers added 134,000 jobs in September and the unemployment rate fell 0.2 percentage points to 3.7%. Wages remain on an upward trajectory, rising 2.8% year-over-year.
Not Good, They're Great!!!
Fed Chairman Jerome Powell has used a variety of superlatives to express his pleasure with the current state of the U.S. economy. Powell believes the economy is in a good place, with exceptionally low unemployment and inflation close to target. With inflation expectations in check, the Fed continues to believe it can gradually nudge interest rates higher. A growing chorus of Fed officials is also beginning to question what full employment actually is, suggesting policy will likely remain on its current track even if the unemployment rate falls below the Fed's expectations.
With one big exception, the majority of this week's economic reports came in on the strong side. The ISM manufacturing survey fell 1.5 points to 59.8 in September but has been hanging around the 60 level in recent months and remains slightly above average for the year. Any reading above 50 means that more manufacturers see business conditions improving than see them worsening. At the current level, the ISM index would be consistent with GDP growth in the 5% range—well above our forecast for Q3—and strong industrial production growth. While the ISM headline index remains near its recent high, many of the more leading components moderated this past month, suggesting manufacturing may moderate in coming months. The new orders index fell 3.3 points to 61.8, which is slightly below its average for the past six months. Order backlogs and supplier deliveries also dropped during the month, while the employment index rose.
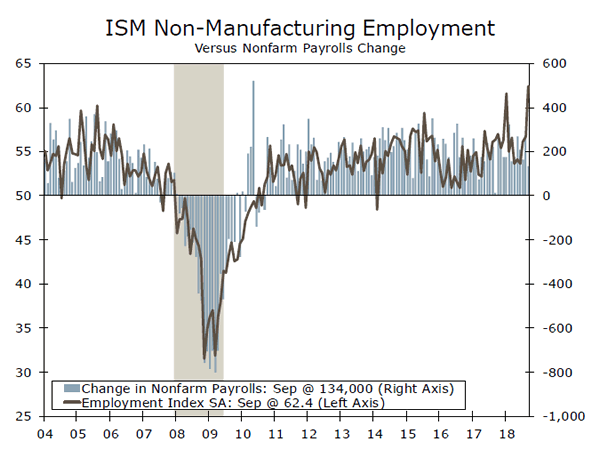
The ISM non-manufacturing index climbed 3.1 points to 61.6 in September. Business activity rose 4.5 points to 65.2 and the closely watched employment index jumped 5.7 points to 62.4. The surge in the employment series raised expectations for the September jobs report, particularly since it was accompanied by more good news from the ADP employment survey, which reported a gain of 230,000 jobs in September, and weekly unemployment claims, which fell back to the lowest levels since the late 1960s.
While the stage was set for another big gain in nonfarm employment, the actual numbers for September came in short of expectations, with payrolls adding just 134,000 jobs. Employment growth for the prior two months was revised higher by 87,000 jobs, which brought the three-month average up to 190,000 jobs. The shortfall in nonfarm jobs appears to be partly due to estimates of how Hurricane Florence impacted employment. Employment at restaurants tumbled by 18,200 jobs, and 20,000 jobs were lost in retailing. We saw similar but larger impacts last year, with Hurricanes Harvey, Irma and Maria. After revisions, the employment losses from those storms do not look quite as severe as they did initially, which may be why the market largely looked past this morning's surprisingly small job gain.
The unemployment rate is less impacted by hurricane distortions. The latest drop to 3.7% results from a large 420,000-person rise in household employment and a more modest 150,000-person rise in the civilian labor force. September's drop in the unemployment rate matches up well with weekly first-time unemployment claims, which are also at the lowest level since the late 1960s.
U.S. Outlook
PPI • Wednesday
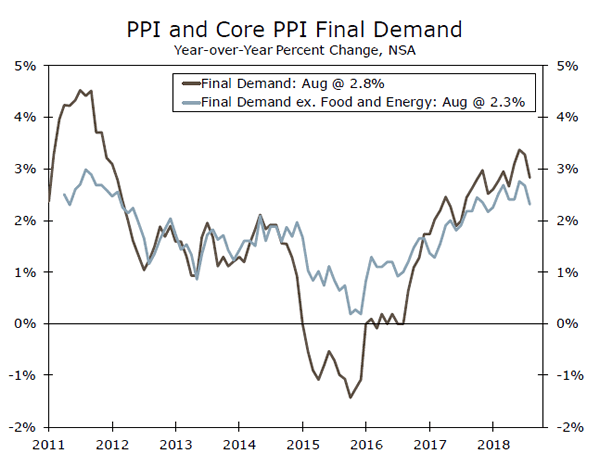
Producer prices fell 0.1% in August, but the underlying details revealed that the below consensus print was not as benign as the headline index indicated. Core price inflation, which excludes food, energy and trade services, came in a bit softer than expected, but still edged up 0.1% during the month. The miss stemmed mostly from a 0.9% drop in the volatile trade-services sector. Over 80% of the drop in prices occurred as a result of declining margins for machinery and equipment wholesaling, suggesting producers may be having a difficult time passing on rising input costs related to recent tariffs. The index for final demand goods was unchanged.
While the topline reading for producer prices came in softer than expected, the "core-core" measure is up 2.9% over the past 12 months and has maintained an upward trend. We expect prices to continue to gradually climb and exert further pressure on margins.
Previous: -0.1% Wells Fargo: 0.2% Consensus: 0.2% (Month-over-Month)
CPI • Thursday
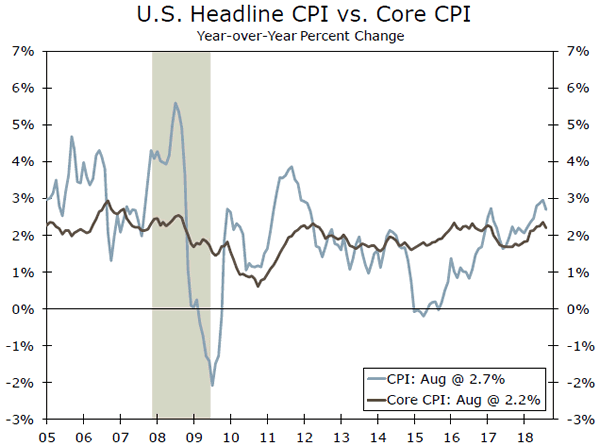
Consumer prices rose 0.2% in August, coming in slightly below market expectations. Over the past 12 months, inflation has now moderated to 2.7% alongside easing energy prices. Core inflation increased a modest 0.1%, but followed a strong reading in July. Core goods prices fell for the first time in three months, as apparel prices fell 1.6%, reflecting renewed downward pressure on core goods prices owed to recent dollar appreciation. Core services inflation softened during the month to 0.2%. Physician services and hospital prices edged down. However, costs for housing and transportation continued to rise.
We maintain our view that inflation should continue to steadily trend upward. The current inflation environment remains in-line with Fed expectations as core inflation has gradually moved up to the FOMC's target. However, there is little indication that inflation will accelerate and force the Fed to raise rates sharply.
Previous: 0.2% Wells Fargo: 0.2% Consensus: 0.2% (Month-over-Month)
Import Prices • Friday
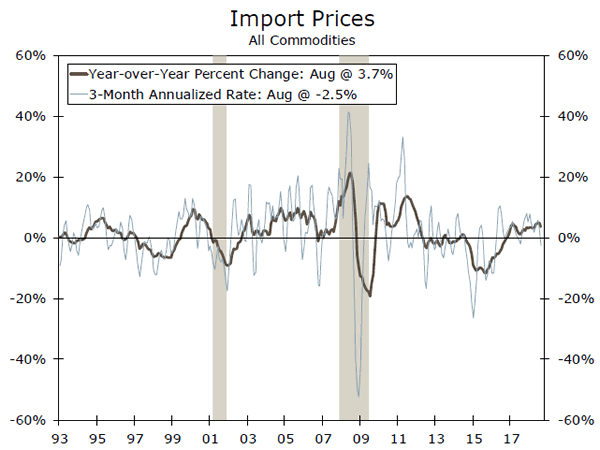
Import prices dropped 0.6% in August, following a 0.1% fall in July. Lower fuel prices and a strengthening dollar this year are likely behind the recent weakness in prices. The monthly decline was the steepest since January 2016 and largely occurred as a result of a 3.9% drop in import fuel prices. Nonfuel prices edged 0.1% lower, driven by lower industrial supplies and materials and capital goods prices. Export prices also registered a 0.1% drop.
While trade disputes with China continue to escalate, tariffs are not included in import prices, as they are applied after. The effect of import prices on consumer prices is also somewhat limited by the fact that most imports are goods and the bulk of consumer spending is services oriented. Softer import prices will likely have negligible effects on overall inflation, which continues to trend higher. We anticipate import prices will rebound modestly from their current slump.
Previous: -0.6% Wells Fargo: 0.3% Consensus: 0.2% (Month-over-Month)
Global Review
Policy in Focus for Financial Markets
- In what was a steady week for international data, policy developments garnered the most attention from market participants. In particular, Canada reached a deal on a trade agreement with the U.S. and Mexico, an agreement we believe improves Canada's prospects and strengthens the growth outlook for the Canadian economy.
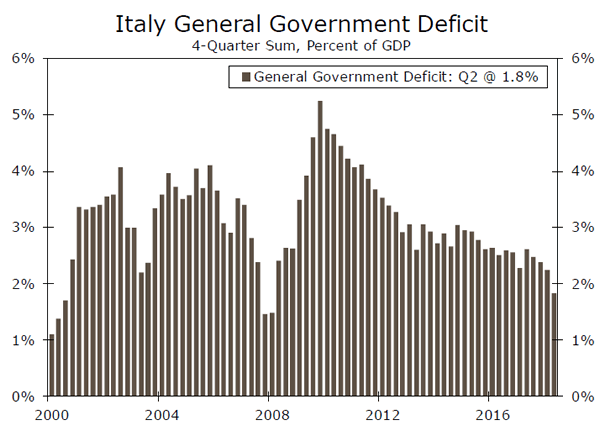
- In Europe, the week began with a standoff between Italy and its European partners over Italy's budget deficit. By week's end, a compromise seemed to have been reached, with Italy proposing a deficit of 2.4% of GDP for 2019, narrowing to 1.8% of GDP by 2021.
Trade Cloud Lifts for the Canadian Economy
The most significant event this week occurred last weekend, as Canada reached a deal with the U.S. (and Mexico) on a trilateral trade agreement, called the U.S.-Mexico-Canada Agreement, or USMCA. For Canada, among some of the key elements of that agreement were specifics related to the auto sector, the retention of some important dispute resolution mechanisms and an extended lifespan for this new agreement. By lifting investment uncertainty and maintaining access to key export markets, the agreement in our view strengthens the outlook for the Canadian economy through 2019 and 2020.
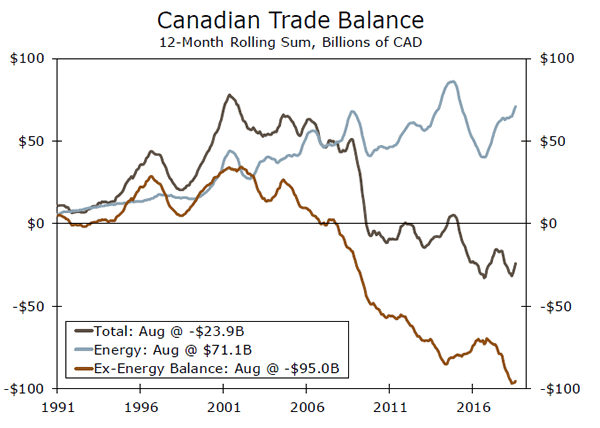
This week's Canadian data were mixed. The August trade balance improved to a C$0.53 billion surplus, though on a broader basis we note Canada has a large energy trade surplus, and a large deficit on non-energy products, highlighting the importance of this week's trade agreement. September employment rose by 63,300 but hourly earnings growth for permanent employees slowed to 2.2% year-over-year, while the September Ivey PMI fell to 50.4.
Europe: Some Policy Progress, Mixed Economic Data
The most significant European development this week was some easing in the stand-off between Italy and its European partners over Italy's budget deficit. Italy had initially proposed a deficit of 2.4% of GDP for 2019 through 2021, but subsequently agreed to a compromise which sees the deficit at 2.4% in 2019, and narrowing to 1.8% by 2021. Of course, the challenge of formulating a detailed budget and actually meeting those budget targets still remains.
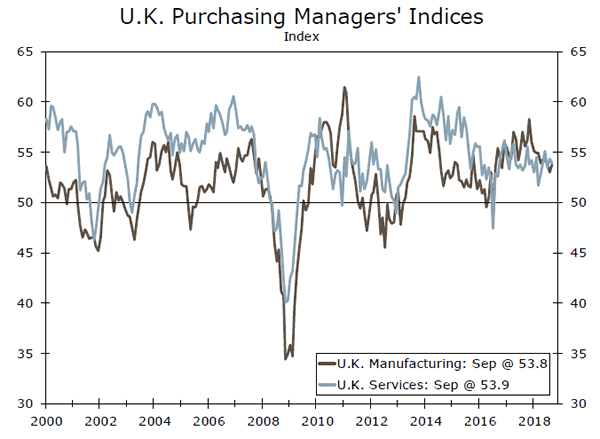
On the data front, Eurozone August retail sales disappointed, with an unexpected 0.2% month-over-month decline, while July sales were also revised lower. In the U.K., the September services PMI fell to 53.9, although the manufacturing PMI was a bit more encouraging, rising to 53.8. For the time being, however, Eurozone and U.K. data remain consistent with subdued economic growth, with little evidence so far of any significant upswing.
Central Banks: Little Talk and Less Action
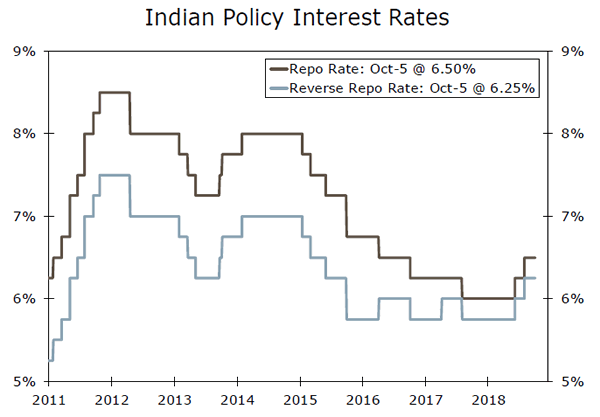
It was only a moderately busy week for central banks, with monetary policy announcements spurring only limited excitement. The Reserve Bank of India unexpectedly held its repo rate at 6.50% and held its reverse repo rate at 6.25%, with a recent slowing in CPI inflation outweighing solid economic growth (Q2 GDP growth firmed to 8.2% year-over-year, the fastest pace since early 2016). Still, the central bank described its policy stance as one of "calibrated tightening", suggesting further rate hikes remain likely in the coming months.
The other central banks were also inactive in this week's announcements. The Reserve Bank of Australia kept its Cash Rate at 1.50% as expected, and gave no indication in its accompanying statement that it is likely to adjust interest rates any time soon. Poland's central bank kept its policy interest rate at 1.50% and said that rates would stay unchanged until the end of 2019 and possibly into 2020. Finally, Mexico's central bank kept its overnight rate at 7.75%, where it has been since June this year.
Global Outlook
Mexico CPI • Tuesday
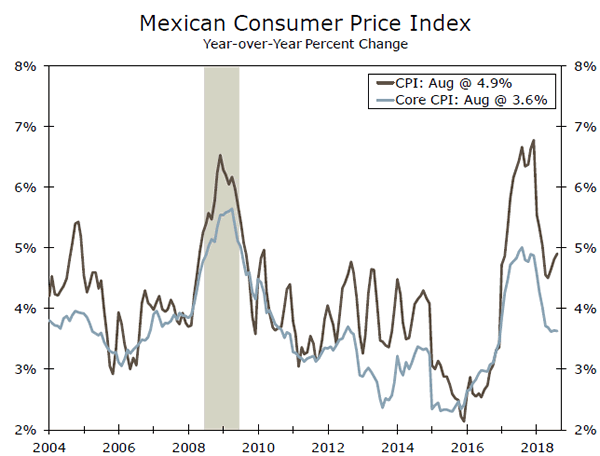
Mexico's September consumer price index is released next week, and may reveal some easing in inflation pressures. Inflation surged in 2017 as the currency slumped and the economy maintained reasonable momentum (or at least did not fall into recession). Inflation has slowed through most of 2018, however, as the Mexican peso has stabilized. The headline CPI rose 4.9% year-over-year in August, and for September inflation is expected to be little changed at 5.0%. For now, inflation is too high and the currency is too volatile for Mexico's central bank to consider easing, and the central bank kept its policy rate at 7.75% this week.
August industrial production growth is also due, and is forecast to firm to 1.3% year-over-year. The industrial sector could potentially firm further in coming months after the recently announced trade agreement with the U.S. and Canada, which should help lift investment uncertainty and maintain access to key export markets.
Previous: 4.9% Consensus: 5.0% (Year-over-Year)
U.K. GDP • Wednesday
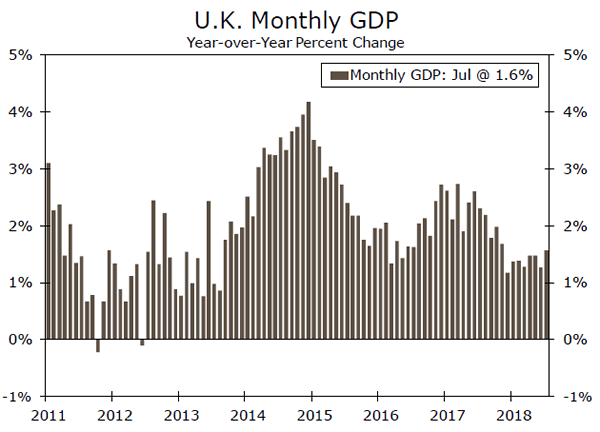
Earlier this year, the U.K. statistical office began publishing monthly GDP estimates, a more timely complement to its comprehensive quarterly GDP data. In recent months U.K. GDP has been relatively solid, rising 0.3% month-over-month in July, led mainly by the 0.3% rise in the services sector. Construction activity rose 0.5% month-over-month, while industrial production rose by a lesser 0.1%. After a few months of relatively solid gains, a smaller increase in August would not be a surprise, and the consensus looks for a gain of 0.2% month-over-month.
In addition to August GDP, industrial and manufacturing figures are also due next week. Overall, activity in the industrial sector has been somewhat subdued. August industrial production is expected to rise 0.1% month-over-month and manufacturing production should also rise 0.1%. Finally, the August trade balance is released, with a deficit of £10.90 billion expected for the month.
Previous: 0.3% Consensus: 0.1% (Month-over-Month)
Eurozone Industrial Production • Friday
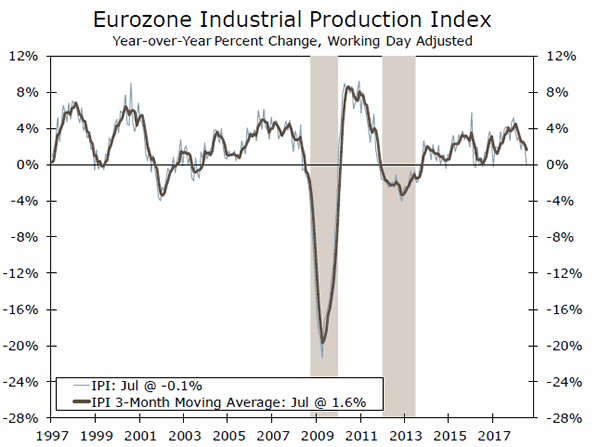
It is a busy week on the industrial front in Europe next week, with several reports on industrial activity for August due for release. Manufacturing has been something of a soft spot for the Eurozone, with survey data subdued and July industrial production falling 0.8% month-over-month. Within the details, production of consumer goods dropped noticeably along with production of intermediate goods. There were, however, monthly increases in the production of capital goods (0.8%) and energy (0.7%).
For August, the consensus expects some recovery of the July decline, with industrial production seen rising by 0.3% monthover- month. On a geographical basis that gain is expected to be relative broad-based, with German production seen rising 0.3%, French production rising 0.4% and Italian production rising 0.8%. With manufacturing soft and services activity steady rather than strong, Eurozone GDP growth likely remained modest in Q3.
Previous: -0.8% Consensus: 0.3% (Month-over-Month)
Point of View
Interest Rate Watch
Too Good To Be True?
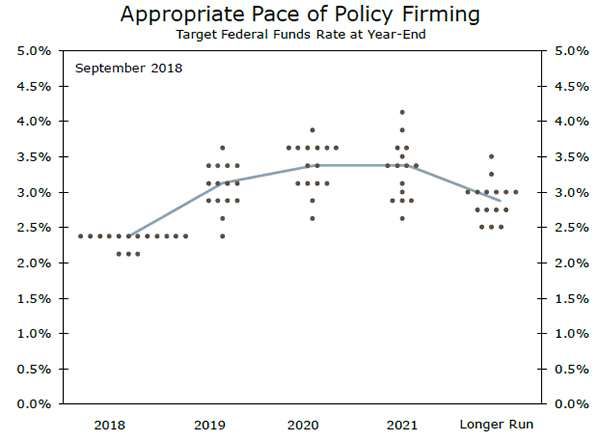
The economic projections released by the FOMC last week showed that the committee expects unemployment to fall to a 50-year low of 3.5% by the end of 2019, while core inflation stabilizes only a touch above target at 2.1%. Tight labor markets and low inflation have been exceptionally rare in the United States during the post-WWII era, which has evoked skepticism about whether the Fed can achieve such a Goldilocks scenario.
In a speech this week, Chairman Powell discussed that such an extraordinary outcome may be achieved in the current environment thanks to the weakening relationship between labor market slack and inflation. In his view, the flattening of the Phillips Curve has come about in no small part to better monetary policy. Specifically, the anchoring of inflation expectations since the "Great Inflation" of the 1970s has better insulated inflation from variations in labor market tightness.
Inflation expectations, especially those for the near-term, have drifted up over the past year. Long-term expectations, however, remain noticeably below the rates reached prior to the 2014-2016 commodity rout.
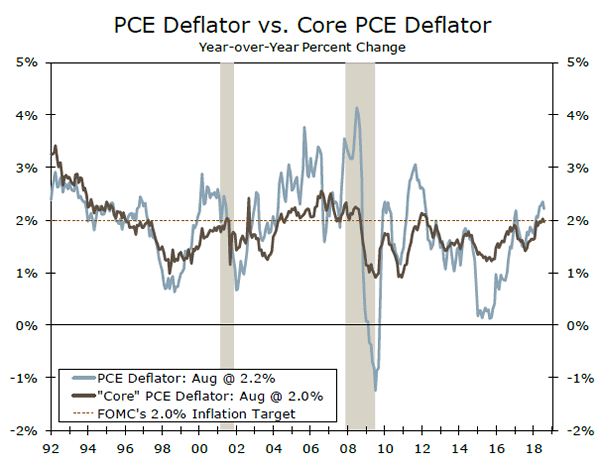
While inflation expectations may be giving the FOMC the green light to continue tightening at a historically slow pace, price pressures are nonetheless building. We expect core PCE to rise faster than the FOMC. Tariffs have piled up to a point where they are now likely to impact inflation, even in a services-dominated economy like the United States. Moreover, they may be the push companies need to raise prices in light of strained capacity. The share of businesses raising prices is near the highest levels since 2008.
Given that inflation has fallen short of the Fed's target for most of the expansion, an overshoot moderately above the Fed's current 2.1% estimate is unlikely to persuade the Fed to ratchet up the pace of tightening unless long-term inflation expectations become unglued. However, it could lead the FOMC to ultimately raise rates more than what it has currently outlined, which is already above what markets expect for 2019 and 2020.
Credit Market Insights
Homeownership and the Recovery
Aggregate household wealth in the United States surpassed its pre-recession peak in 2012 and has continued to rise as the economic expansion closes in on the longest on record. However, the fact that around 80% of that wealth is held by the top decile of households merits a closer look at the distribution of wealth accumulation during the recovery. The more granular data of the Fed's Survey of Consumer Finances reveal that real wealth has yet to surpass 2007 levels for the bottom 90% of households.
One major driver of the disparate wealth trajectories is the growing skewness of stock ownership toward upper income households. Moreover, the bottom 90% has seen a marked decrease in the homeownership rate and has thus missed out on the recovery of home values to record levels. We have repeatedly discussed the ongoing challenges in the housing market, including inability to afford a down payment and worsening credit availability. Indeed, the conventional 30-year mortgage rate rose to 4.71% this week, a seven-year high. As the sustainability of the expansion comes under closer inspection, it is worth reflecting on the linkages between wealth and consumer spending, the largest component of the economy. Future trends in homeownership and the broader distribution of wealth accumulation could very well have implications for the future trajectory and ultimate end date of this expansion—one that has been called a "wealthless recovery" and led Chair Powell to consider whether our current situation is "too good to be true".
Topic of the Week
Tariffs' Lessons So Far: Proceed with Caution
As international trade tensions were beginning to escalate in April, we wrote a report considering how costly a full-blown trade war would be. At the time, the United States had announced plans to impose tariffs on $50 billion worth of Chinese imports and China had retaliated in kind. We noted in that report that the business environment would be more challenging for some American industries, but a full-blown trade war "would not necessarily bring the U.S. economy to its knees, due to the relatively small amount (in terms of overall value added) that the United States exports to China." Indeed, China has more to lose.
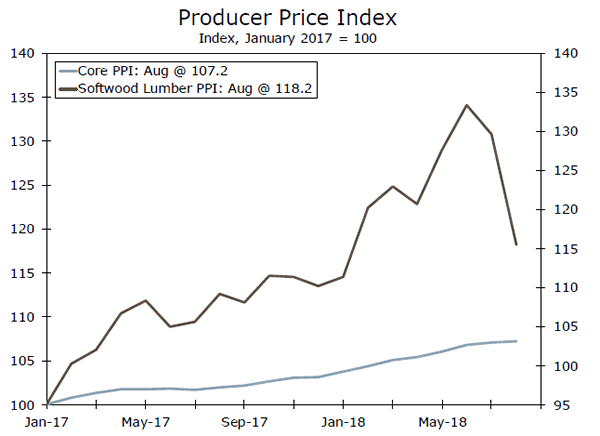
Nearly six months on, we believe that it is time to re-examine our analysis in light of recent developments. Namely, on September 24, the United States imposed tariffs on another $200 billion worth of Chinese imports, and China retaliated by targeting an additional $60 billion worth of American exports. In the first of a two-part series, we analyze the effects that American tariffs on softwood lumber, washing machines and steel have had on prices, output and employment in those industries. Are there any lessons for the industries that will be affected by the most recent tariffs from the import taxes that have already been enacted?
Tariffs have raised prices in the affected industries. However, outside of that intuitive point, the conclusions are not perfectly clear cut as we find modestly negative effects on output and employment in some, but not all, of the industries we analyze. Admittedly, it may be too soon for the effects of the levies to be fully reflected in industry output and employment, and we acknowledge that those factors could be affected by factors other than tariffs.
When we wrote our initial report six months ago, we concluded that the "first order" effects of a trade war would not be large enough to push the U.S. economy into recession. We stand by that conclusion. However, it also seems that the first order effects on the industries that received tariff protection are modestly negative, at least so far. In a follow-up report, we will turn our attention to the "second order" effects of American tariffs and the effect of Chinese levies on U.S. exports. Stay tuned.
The Weekly Bottom Line: Its A Relief to have the US-M-C-A!
U.S. Highlights
- The big story of the week is the trade deal struck just in the nick of time between U.S. and Canada. The new USMCA deal will see Canada joining the agreement previously worked out between the U.S. and its southern neighbor and calms some fears, particularly among auto manufactures in the region.
- Overall manufacturing activity, though still hot, dialed back the temperature a bit in September. The services sector however, continued to increase the heat, coming in at an all-time high with price pressures edging up.
- The 134K gain in U.S. employment was less than expected, but the unemployment rate is at a near 50 year low, pushing bond yields up after its release.
Canadian Highlights
- It was a big week for Canadian newsmakers. After signing onto a new trade deal, Prime Minister Trudeau was in Vancouver announcing a $40 billion investment from LNG Canada in Kitimat British Columbia.
- Canadian economic data was mixed. The labour market added 63k jobs, but full-time employment fell and so did aggregate hours. Wage growth also decelerated.
- The rout in global bond markets extended to Canada, with yields rising across the curve. The Canadian 10-year yield hit its highest level in over four years.
U.S. - New NAFTA Cools Trade Tensions
The week started off with the good news that the U.S., Mexico and Canada had reached a last-minute deal for a successor to the tri-country NAFTA pact. The U.S.-Mexico-Canada Agreement (USMCA) marks a new era for trade among the three countries. It also means the U.S. will no longer be fighting a trade war on multiple fronts. The trade brawl is now primarily between the U.S. and China, with no clear end in sight.
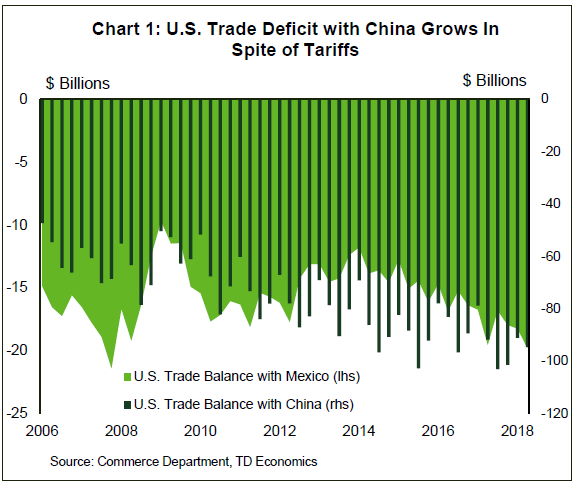
The White House is determined to rewrite trade flows, and has not been shy in using tariffs to this end. While their deficit with Canada has been declining, their deficit with Mexico is nearing historic highs, and that with China has worsened despite tariff measures (Chart 1). It remains to be seen if the latest tranche of tariffs imposed on China are up to the task of "correcting" this perceived imbalance and how it will impact growth (see paper).
There are still vital steps ahead for USMCA implementation, but the agreement in principle allows auto manufacturers in all three countries to breathe a sigh of relief. The deal, however, may raise U.S. vehicle prices in the future given new provisions on wages for auto workers.
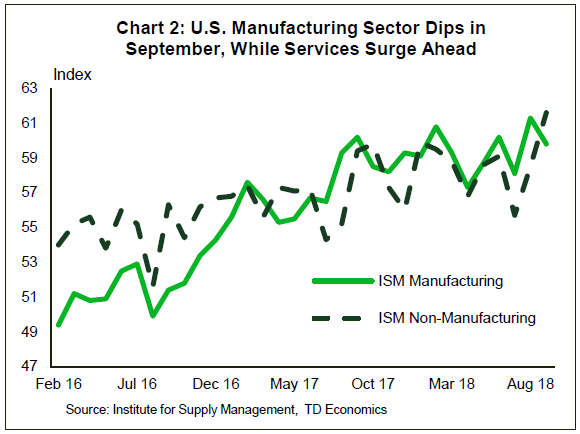
For the manufacturing sector as a whole, activity dipped slightly in September, but remained at healthy levels. In particular, the decline in new orders backlogs and supplier delivery times suggests that output at manufacturing firms is catching up with demand - a development which should keep the lid on latent price pressures. Even better was the ISM non-manufacturing index which reached an all-time high in September with all sub-indices and sectors either growing or remaining constant m/m (Chart 2). Unlike their manufacturing counterpart though, service firms appear to have a harder time meeting demand, resulting in prices edging up. Overall, both sectors indicate that the U.S. economy is still at the top of its game, even while capacity constraints and rising tariffs pose a challenge.
Various Fed speakers did the rounds this week, talking up the current strength of the US economy. On Tuesday, Fed Chair Powell hailed a "remarkably positive outlook" for the economy. He characterized the combination of steady, low inflation, and very low unemployment as ''extraordinary times'' and noted that the U.S. is on the verge of a "historically rare" era.
The jobs report was the icing on the cake. While the addition to nonfarm payrolls came in lower than expected (134k vs. 188k), employment levels remain elevated. With employers struggling to find people to fill positions, and the impact of hurricanes, the slowdown in hiring isn't all that surprising. The unemployment rate, however, continues to impress, falling to a near half-century low of 3.7%. In response, 10-yr Treasury yields breeched 7-yr highs (above 3.2%) – cementing increases posted earlier in the week on similarly strong ADP employment data. All in all, the U.S. economy remains a force to be reckoned with and poised for above 3% growth in Q3.
Canada - Its A Relief to have the US-M-C-A!
What a week. In under seven days we have had an updated NAFTA (the newly minted USMCA), a major investment announcement in LNG in British Columbia, an update on the Canadian labour market, and just top it off, a rout in the bond market.
The new USMCA is a big deal (literally, at hundreds of pages). For Canada, the agreement brings a sigh of relief, reducing a major source of uncertainty and maintaining access to the North American market that is the source of nearly three quarters of Canadian exports. To get there Canada had to make some concessions, agreeing to allow American dairy producers to access 3.6% of the Canadian market and accepting longer patent protection on prescription drugs. The de-minimis threshold – how much Canadian consumers can purchase from the U.S. without paying duty –was also raised to $150 (from $20). Good news, at least, for cross border and online shoppers.
Canada also accepted quotas on auto exports, but at levels well above current production and which only apply to vehicles that do not meet the minimum North American content rules. This implies basically the status quo for the Canadian auto sector. Just as important as the trade deal itself was the side agreement that guaranteed the U.S. would not impose tariffs on Canadian autos under national security provisions (section 232).
Relative to maintaining the original agreement, the trade deal is unlikely to do very much to raise Canadian growth prospects. However, without a deal, Canada's economy would grow noticeably slower. The Bank of Canada estimated that absent a deal, the Canadian economy would have been about 0.5% smaller by the end of 2020.
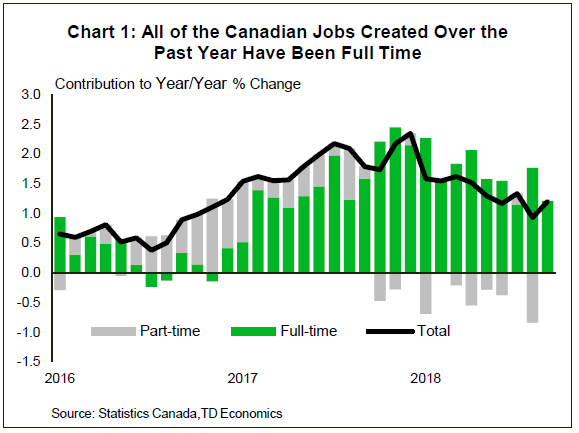
With a deal removing this source of downside risk, the Bank of Canada can focus on the economic data. On the surface it was a pretty good week. The Canadian economy generated an estimated 63k jobs in September and the Canadian trade balance moved into surplus territory. Unfortunately, the details of both reports were less sanguine. All of the jobs created (+80k) were part-time, while full-time jobs pulled back 17k. Wage growth of permanent workers decelerated to 2.2% in the month. On the trade side, the move to surplus reflected a pullback in both imports (-2.5%) and exports (-1.1%). All told, the economic data were mixed, providing little signal in either direction.
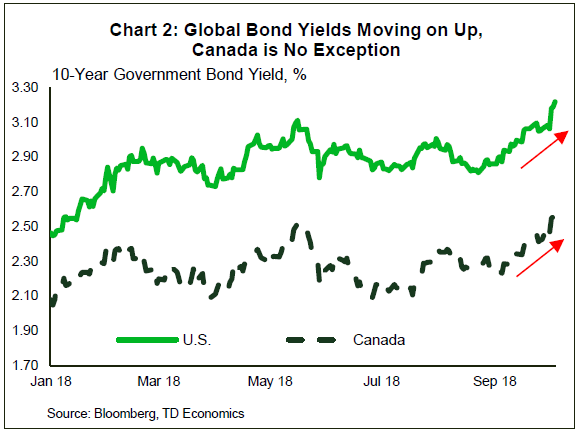
Equally important to the Bank of Canada may be the recent move in the bond markets. Post-USMCA optimism has led investors to expect stronger growth and more rate hikes, leading to a broad-based sell off in global bond markets. In Canada, the sell off this week was concentrated more at the long-end of the curve, with the 10-year yield up over 15 basis points to sit just below 2.6% (as of writing). Despite an alleviation of trade risks, domestic risks – namely high household debt levels – may still pose a limiting factor on the pace of future Bank of Canada hikes.
U.S.: Upcoming Key Economic Releases
U.S. Consumer Price Index - September
Release Date: October 11, 2018
Previous: 0.2% m/m; core 0.1% m/m
TD Forecast: 0.2% m/m; core 0.2% m/m
Consensus: 0.2% m/m; core 0.2% m/m
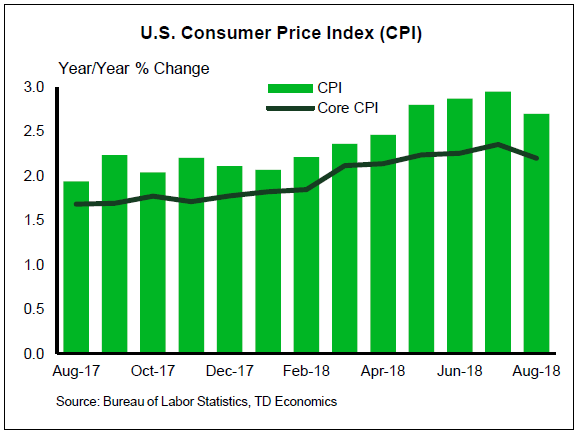
We expect CPI to slip to 2.4% on a moderation in gasoline prices, partially offset by a pickup in core CPI. We expect the latter to post a 0.2% m/m rise (2.3% y/y) on a rebound in apparel and medical services, both of which drove the downside in August. Together with a strong read for shelter, these components should limit any downside this month. Food prices also have scope for a pickup after months of weakness.
Canada: Upcoming Key Economic Releases
Canadian Housing Starts - September
Release Date: October 9, 2018
Previous: 201k
TD Forecast: 225k
Consensus: N/A
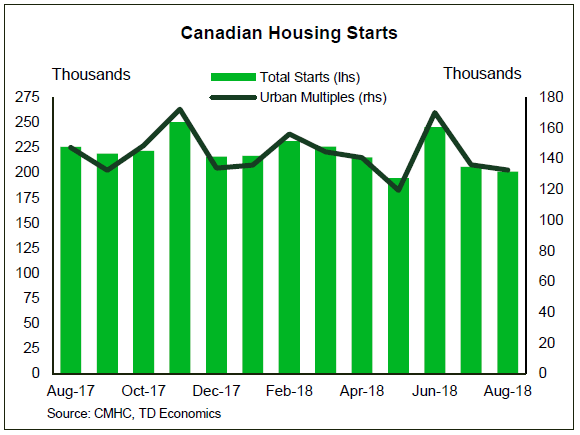
Housing starts are forecast to recover to a 225k pace in September on a rebound in multi-unit starts, although we see scope for another slowdown in single family construction. Single family starts are sitting just 0.15k (annualized) above post-crisis lows but permit issuance continues to trend lower amid an affordability crunch in major population centers. This has helped support demand for condominiums, which developers have tried to meet with a flood of new supply since 2017. Permit issuance for multi-unit projects saw a sharp decline in June but has started to come back since, which supports a stronger pace of starts for September.
Week Ahead – Dollar Slows Down After US Jobs Miss
The US dollar was mixed Friday. The greenback advanced against the commodity currencies (CAD, AUD AND NZD) edging higher against the CHF, but was lower agains the JPY and the EUR. The GBP deserves a special mention as positive Brexit rumours pushed it 0.61 percent higher against the USD. The American currency lost momentum as the U.S. non farm payrolls (NFP) headline jobs number disappointed with a 130,000 added positions, instead of the forecasted 188,000.
The USD was boosted by solid fundamentals that keep pricing in a fourth rate hike in 2018. The Columbus Day holiday in the United States will shorten the trading week. US inflation data points will be the highlights with US PPI on Wednesday October 10, and US CPI on Thursday October 11.
- UK GDP to slowdown at 0.1 percent
- US PPI forecasted to bounce back to 0.2%
- US inflation steady at 0.2 percent
Dollar to Look for Inflationary Clues
The EUR/USD is flat on Friday ahead of the long weekend in the United States. The single currency is trading at 1.1514 awaiting a long weekend and a short trading week. The US currency was supported by Fed member speeches that continue to support a fourth rate hike in 2018.
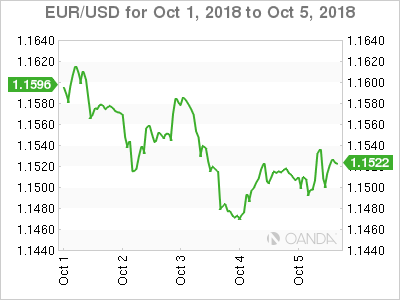
The Fed raised rates on September 26 by a quarter of a percentage point and barring a sharp decline in economic indicators will do so again in December. The path for the US dollar for the end of the year will be unobstructed, but as 2018 begins to wrap up the strong dollar narrative is raising doubts.
In Europe Italian budget concerns once again rose despite the government conceding to lower budget deficits in 2020 and 2021. The budget concessions also came with lower growth forecasts that pressured the stock market and sent Italian yields higher. The EU is unlikely to accept the budget without further changes, but the political climate could further complicate things.
The EU could be fighting in two fronts. Brexit negotiations are ongoing, and despite some positive signs, are nowhere near an agreement. Opening another front by shooting down the Italian budget could be a replay of the Greek drama in 2010 but at a much larger scale.
Loonie Falls Despite US Jobs Report Miss
The Canadian dollar fell against the US dollar on Friday despite a rebound in Canadian employment numbers and a miss in their American counterparts.
The loonie did advance against the greenback when the NFP report and the Canadian employment numbers were announced but as traders looked ahead to the long weekend they reduced their short US dollar exposures.
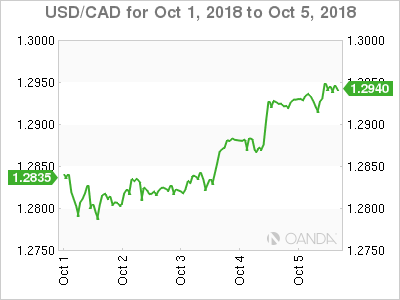
Canada added 63,300 positions in September driven by part time employment. The gain offset last month's losses of 54,100 jobs that were also part time positions. The Bank of Canada (BoC) will have another solid datapoint to validate its upcoming monetary policy meeting that is being priced in at 85 percent probability of a rate hike.
The Canadian dollar is on track to end 0.29 percent lower versus the US dollar. Despite the headline jobs miss on the NFP report, the revisions and more importantly the inflation components still support a Fed rate hike in December. The CME's FedWatch tool shows a 81.7 percent probability, down slightly from 83.3 percent yesterday.
Gold Higher on Dollar Stumble
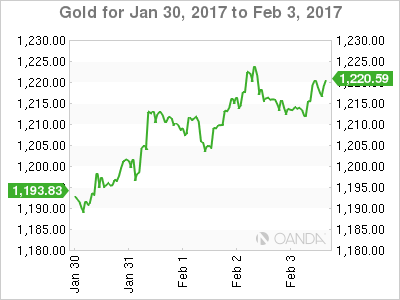
Gold rose on Friday taking advantage of a miss on the monthly U.S. non farm payrolls (NFP) report. The US economy added 130,000 jobs with market forecasts near 200,000 positions added in September.
The yellow metal rose as the market digested the jobs report miss and put the US dollar under pressure.
Gold will hold on to weekly gains but as a long weekend approaches due to the Columbus Day holiday investors will trim their dollar short exposure limiting the upside for commodities.
The weakest US jobs report this year took a toll on the US dollar. The headline miss was only part of the story, wages grew as much as expected and while the lower numbers this month do not raise questions on a December rate lift by the Fed it does affect the intensity of the market focus on next week's inflation indicators.
Oil Higher until OPEC-Russia Confirm Production Increase
West Texas Intermediate is rising 0.55 percent on Friday, with Brent making a smaller upwards move at 0.05 percent. Question marks about how and when will energy producers increase production to cover the supply fallout from the official start of US sanctions against Iran.
The sanctions start on November 4, but already Iranian exports have fallen given how the US communicated that it would not tolerate any cooperation.
The Trump administration has called out the OPEC for not doing enough to keep crude prices low, but ironically it's the sanctions imposed by the administration that have put oil prices higher.
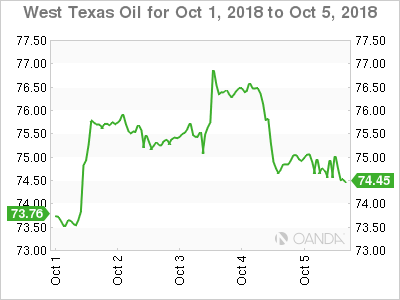
On a weekly basis WTI and Brent have advanced ore than 2 percent as US Secretary Rick Perry has taken off the table the option to use the emergency oil reserves to bring prices down.
Reports circulated that Russia and Saudi Arabia are ready to increase oil production, but if they have agreed they said nothing after the OPEC met with major producers on September 23 in Algiers.
Oil prices will continue to fluctuate upwards until there are confirmations that energy producers are ready to offset the lost supply from Iran.
The weekly crude inventories report will be published on Thursday at 11:00 am EDT due to the Columbus Day holiday in the states.
Market events to watch this week:
Wednesday, October 10
- 4:30am GBP GDP m/m
- 8:30am USD PPI m/m
Thursday, October 11
- 7:30am EUR ECB Monetary Policy Meeting Accounts
- 8:30am USD CPI m/m
- 11:00am USD Crude Oil Inventories
Friday, October 12
- 10:00am USD Prelim UoM Consumer Sentiment
*All times EDT
More Yielding to Yields Next Week?
What a barn burner of a week!! Fixed income took centre stage, but the lingering odour from risk aversion and choppy intraday moves will continue to challenge traders at every twist and turn.
With US yields remaining at multi-year highs and breakneck price action triggering a massive uptick in volatility, now what possibly could go wrong!!
Let’s look at some dynamics in play next week, as traders will be tasked to decide if these moves can be sustained.
Asian Markets
China returns from Golden Week, and it will be exciting to see how they review this week’s market evolutions and dynamics on Monday. Baring in mind that short sellers were reloading on the HSI as bears have returned en masse to target Hong Kong’s equities after being bushwhacked in a painful short squeeze last month. Traders are sensitive to relatively minor adjustments in the short-term economic data — last weeks drop was in part due to the weaker China PMI release, negative impact of Typhoon Mongkut, while a pale came over Fridays markets as China headline overload which spooked investors as ” Spy -Chip” and US electoral process tampering was all over the headlines
It’s important to keep a broad view in mind while cementing overall opinions. The US administration is loaded with policy hawks and if there is concrete evidence China is meddling in the US midterms through a campaign of disinformation, spies, tariffs or bullying measures. It will trigger a swift and uncompromising reprisal and would sound the alarm bells across global markets.
As well, things are hotting up in the South China Sea on the cusp of my annual 6-day deep sea fishing trip 15 hours of the coast of Sarawak !!, yes in the very same South China Sea where the US Navy is contemplating a show of strength to warn China against playing bully in the region.
But besides elevated risk around US-China political tensions, look out for Chinese data (trade balance, Caixin PMIs) and Singapore’s rate decision.
North American Markets
North America will have to wait until Tuesday to find out China’s reaction, with the Columbus Day holiday in the US, Canadian Thanksgiving and a Japanese holiday all falling on Monday. There’s plenty of Fedspeak to keep the headline reels rocking But after hearing from Powell last week, who made the FOMC ‘s intentions clear and in no uncertain manner, The speeches won’t have a huge impact. But in the absence of a heavy slate of tier one economic data, there is nothing to keep the US market tethered to fundamentals if headline overload kicks in. The dollar does tend to waffle in the absence of US data so that the focus will fall on external divers like Italy and China.
European Markets
.
EU economic data prints would take a back seat to the ongoing Italian political opera. While in the UK Brexit will continue to top the market charts as progress is expected ahead of EU October summit later in the month. While there’s probably a decent Sterling view lost in this nose, frankly I think traders are entirely fed up riding the Brexit rollercoaster
Equity Markets
. The heightened US-China tension around Spy -Chip should weigh on tech stocks, but the equities/fixed income rotation dynamic could accelerate next week if US yields remain firm or could accelerate if the US yields somehow manage to punch higher.
Oil markets
Besides the outsized focus on Iran sanction. This week’s large US inventory build has threatened to derail the Oil rally and weighted down WTI. So next week data will be in the discussion, and despite the fact, the industry is entering fall refinery maintenance season. Inventory builds are common as refineries aren’t taking in as much crude. None the less a froth disappeared quickly so oil bulls will be looking for a catalyst early in the week especially with Brent closing just above the psychological $84 level.
Gold Markets.
With US stock markets falling hedgers are gingerly stepping back into the markets. But in the absence of an equity markets freefall, there’s not enough interest to push prices significantly higher. Next week look for the DXY-USD correlation to guide the markets.
After flip-flopping its way through September, the greenback is starting to reassert itself supported by a significant fair wind from the US rates markets with 10-Year UST holding north of 3.15 %. It is difficult to envision gold tracking any which way but down.
Currencies in focus
Japanese Yen
BoJ has not intervened in the ten years yet but the central bank kept the size of buying in super-long JGBs unchanged from the previous operation, offering to buy JPY180bn in 10-25y maturities and JPY50bn in 25-40y notes.
USDJPY trades around the 113.75 level and the price of JGB futures has not changed much after the announcement. But it does seem like the BoJ is signalling a widening of the YCC 10 years mechanism. This move if indeed true should take some wind out of USDJPY sails
The Australian Dollar
With China celebrating Golden week the AUDUSD was trading as a G10 go to proxy of ASEAN EM weakness this week. And with a little reprieve on the US rates front, it was a tough week for the Aussie. China returns to action next week an how US/China tensions will be a considerable focus early next week. With the Aussie getting battered and bruised from every angle, it’s not difficult to envision the Aussie testing the key AUDUSD 70 after closing precariously perched above the potentially pivotal .7050 level. But even if the USD gets parked in neutral or weakness a touch next week, traders will continue to express a bearish Aussie view, but likely through the Euro in such a case.
The Canadian Dollar
Ratification of the new trade deal poses the most significant tail risk to the Canadian dollar. The probability of getting the revised trade deal through remains anyone’s guess, and with US administration expending all their political energy towards the Nov 6 midterm elections, this deal will be drawn out even further which could skew towards CAD weakness, especially with the BOC next rate hike fully baked in
EM Asia
Malaysian Ringgit
The external environment isn’t at all amicable for EM Asia currency US rates, tepid growth outside of the US markets, and the escalation of US-China tensions it’s near impossible to hold even the slightest of bullish conviction. Demand for MYR has been tepid at best but yesterday warning shot across the bow from the world bank has dented sentiment even more after they r downgraded Malaysia growth forecast. With the upcoming budget in focus, it puts a lot of pressure on the Malaysia government to deliver a fiscally prudent measure. While terms of trade do remain favourably due to oil prices, waning growth could be a real negative for the MYR as it could trigger a dovish response from the BNM.
The Indian Rupee
The RBI disappointed the market by keeping rates unchanged. This lack of urgency was a big dovish surprise, as only 9 out of 49 analysts surveyed by Bloomberg had called for no change. The vote was not even close too – the MPC voted 5-1 to keep rates unchanged with one dissent.
No matter which view you take on this all things lead to 75 USDINR.
1) The RBI realised there were between a rock and a hard place due to domestic credit concern
2) The RBI recognised the futility of putting interest rates higher is effectively doing little more than putting a bandage on a broken leg in the face of surging oil prices
3) The RBI is not concerned about INR weakness
It’s not too much of a stretch to conclude that the RBI has just opened the door to more currency pain.
NFP Thoughts
There was a high level of concern that the markets got ahead of themselves with US bond yields ripping higher coupled with an insatiable demand for USD triggered by astronomical US data, mainly this week’s ISM made for a very compelling storyline.
But going into the data, nothing else really mattered other than wages.
Overall, this data print is far from a pivotal moment, for markets – An in-line AHE isn’t much of a letdown, and despite the NFP headline going into the tanks, it’s hardly a signal that the US economy is also. But with USD positions oversubscribed there was always going to be a bit of leakage on a headline miss.
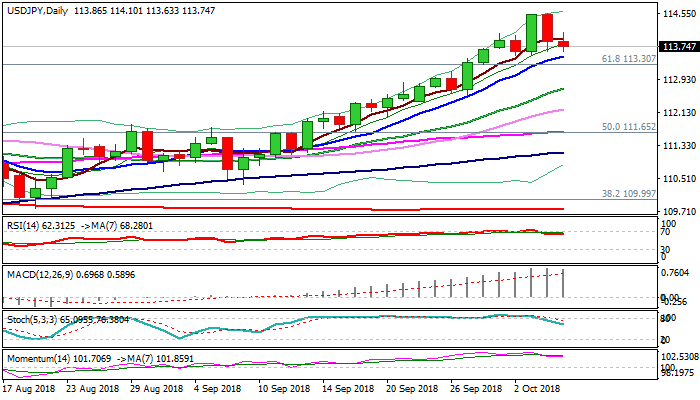
USDJPY Outlook: Bullish Outlook above 200WMA But Initial Signs of Pullback Require Caution
The dollar edged lower after US jobs data but dips were contained at 113.63 (Thursday's low) and just above initial support at 113.52 (rising 10SMA).
Despite headline payrolls missed forecast in Sep, overall picture is positive as upward revision of previous month's figure offset stronger negative impact, while earnings remain solid and unemployment fell to multi-decade low.
Broken weekly 200SMA is a key support (113.18) and weekly close above would generate fresh bullish signal.
However, risk of deeper pullback on break below 200WMA exists as weekly slow stochastic turning lower in overbought territory and the pair is likely to end week in Doji weekly candle with long upper shadow, which could be initial negative signal.
Watch pivots at 113.18 (200WMA) and 114.73 (06 Nov 2017 high) for stronger direction signals.
Res: 114.10; 114.54; 114.73; 115.00
Sup: 113.63; 113.52; 113.30; 113.18
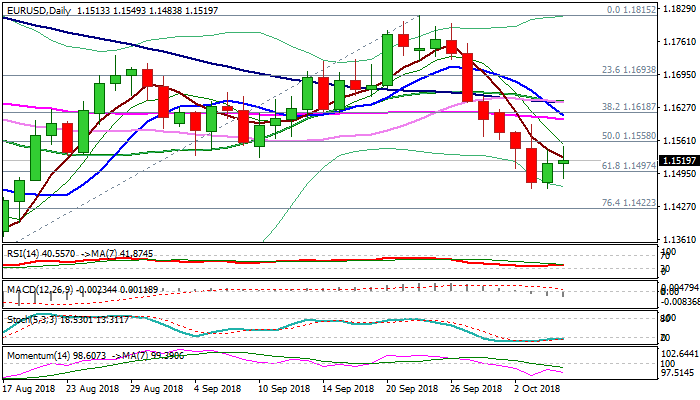
Weaker NFP Boosted Euro but Overall Bears Keep Upticks Limited
The Euro bounced after weaker than expected US NFP data but gains were so far capped by daily cloud which twists today (1.1545) and attracts.
Recovery might be short-lived as daily bears are firmly in play and US jobs data are overall positive, as earnings remain steady, unemployment fell to the lowest in 48 years while fall in non-farm payrolls could be described as seasonal and strongly affected by bad weather.
Strong bearish momentum on daily chart and MA’s in full bearish setup, with multiple bear-crosses formed, maintains negative outlook, however, extended consolidation cannot be ruled out as slow stochastic is emerging from oversold territory.
Bearish stance is confirmed by the second consecutive weekly close in red, with further negative signal expected on today’s close below the base of thick weekly cloud (1.1562).
On the other side, dollar’s bulls may take a breather on overbought conditions and inflate Euro for further recovery.
Scenario requires confirmation on break and close above thickening daily cloud, which would sideline immediate downside risk, but extended recovery upticks should face strong headwinds from converging 55/10SMA’s at 1.1600 zone.
Res: 1.1549; 1.1565; 1.1600; 1.1640
Sup: 1.1483; 1.1463; 1.1422; 1.1394.
Australia & New Zealand Weekly: Big Fall in AUD is Behind Us
Week beginning 8 October 2018
- Big fall in AUD is behind us.
- RBA: Financial Stability Review, Assistant Governor (Economic) Ellis speaks.
- Australia: Westpac-MI Consumer Sentiment, housing finance, NAB business survey.
- NZ: retail card spending, house sales and prices.
- China: new loans and financing, trade balance.
- Europe: Sentix investor confidence.
- US: CPI, Columbus day.
- Key economic & financial forecasts.
Information contained in this report current as at 5 October 2018.
Big Fall in AUD is Behind Us
Over the last month the AUD has held in a range between USD0.73 and USD 0.707. That followed a sharp fall in the AUD from USD0.745 to USD 0.71 over the previous month. Westpac is retaining its target for AUD to end 2018 around USD 0.72. Further weakness is expected for the AUD through the first half of 2019, bottoming out at USD 0.70 around the middle of 2019 before recovering somewhat to USD 0.72 by end 2019.
A year ago when the AUD was trading around USD 0.80, Westpac forecast that the AUD would finish 2018 at USD 0.70. We are pleased that the market has moved broadly in line with our forecasts over that year. A key argument behind our negative view on the AUD hinged around a substantial shift in interest rate differentials between USD and AUD short term rates, a development that was not anticipated by the market.
At that time the market was priced for the RBA cash rate to be around 40 basis points above the federal funds rate by end 2018. Westpac had argued that the differential will be the reverse – that is, the federal funds rate would end 2018 around 40 basis points above the RBA cash rate. We figured that as markets began to price in our view of interest rate differentials, persistent downward pressures would emerge for the AUD.
Markets have actually moved further than we anticipated with both Westpac and market pricing pointing to a margin of 87 basis points by year's end. That largely reflects our underestimate of the pace of FOMC tightening, since, at the time, there was still considerable uncertainty around whether the Trump Tax Cut Plan and the Fiscal Plan would get Congress approval.
Looking further out, Westpac expects the margin between the RBA cash rate and the federal funds rate to widen to 137 basis points by June next year whereas market pricing is pointing to a margin of 120 basis points.
By December 2019, markets are anticipating a differential of 124 basis points whereas Westpac is expecting the differential of 137 basis points to hold as we anticipate that the FOMC will go on hold beyond June and the RBA will remain on hold in 2019.
It is important to distinguish between the market outlook for FOMC policy and bond rates. This current blow out in bond rates is reflecting a mix of an increased risk premium and longer term FOMC views rather than a more aggressive profile for the near term federal funds rate.
Therefore we are still expecting the RBA cash rate to undershoot the federal funds rate by more than markets are pricing but not significantly so.
Consequently, unlike a year ago, we are not anticipating a further major downdraft on the AUD as a result of markets' reassessing interest rate differentials.
Unlike interest rate differentials, there is no reliable way of assessing market expectations for the Index of prices of Australia's commodity exports. But we agree that Australia's Index of Export Commodities is also an important factor for the AUD.
In fact, if it was only interest rate differentials which were driving the AUD, that wider than expected differential would have been consistent with an even lower AUD than we had anticipated a year ago. The answer to our puzzle is that commodity prices have held up much better through 2018 than we had anticipated.
In our October 2017 Market Outlook, we forecast that our Australian export commodity price Index would fall by around 20% by end 2018. Developments to date now indicate that it will be broadly stable over this period. Of particular importance here has been the resilience of the bulk commodities (iron ore; coking coal; and thermal coal) as China's anti-pollution policies have favoured high quality Australian bulks over the lower quality local products.
This resilience of commodity prices, despite an anticipated slowdown in China, has explained the relative resilience of the AUD given the dramatic change in interest rate differentials. Looking forward we continue to expect the Commodity Price Index to soften through 2019 as the Chinese economy continues to slow. We are forecasting the Commodity Price Index to fall by around 10% through to mid-2019.
That outlook for the commodity price cycle – which has upside risks – coupled with our expectation of an interest rate differential – which is now largely priced into the market – explains our current forecast that AUD is likely to fall further, although the big falls are now behind us.
While interest rate differentials and commodity prices are key factors for the AUD, any turning point in sentiment towards the USD will also be significant. Through 2018 we have seen generally positive sentiment towards the USD. That is likely to extend through the first half of 2019 but will change when the market becomes convinced that the FOMC is on hold. Our current forecasts envisage the last FOMC rate hike in June next year with the market (and the FOMC itself) taking time to recognise that point. We would expect such a development through the final quarter of 2019 so see the low point in the AUD as June/ September 2019 at USD 0.70 with the AUD lifting to USD 0.72 by end 2019.
However, note how crucially important is our core view that the federal funds rate peaks in June 2019. That target level of 2.875% is below the median FOMC forecast of neutral which was recently updated. The committee sees a range for neutral between 2.5% and 3.5%. We currently favour an estimate nearer 2.5% than 3.5%. Key issues here are that labour productivity in the US remains anchored around 1%, holding potential growth (an important factor for determining neutral) around 1.75%. Fiscal policy will become a drag on US growth in the second half of 2019 as committed spending cuts are delivered; and financial conditions and trade policies tighten sufficiently to restrain US growth to below trend.
Nevertheless, the risks to this outlook are to the upside for the federal funds rate. An extension of the hikes into the second half of 2019 would significantly widen interest rate differentials and sustain confidence in the US dollar for a longer period.
In those circumstances we can envisage the AUD breaking our USD 0.70 forecast to the downside.
The week that was
The tone of data for Australia and the US took diverging paths this week, with the US unquestionably strong as Australia underwhelmed again. However, the biggest headline came not from the data itself, but rather the sharp jump in the US 10 year yield to a peak of 3.23% – a high back to May 2011. As a result, the spread to the Australian 10 year hit 50bps, a level we had not anticipated until June 2019.
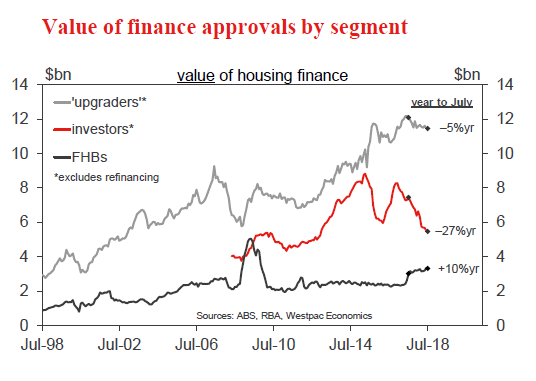
The best place to start is the RBA's October meeting, where the cash rate remained on hold for a 26th consecutive month. The tone of the statement carried no major changes, though importantly credit conditions were described by the RBA as "tighter than they have been for some time". Whereas the RBA remains focused on investors as the source of weakness, from the new lending data, it is evident that not only has investor momentum turned down sharply (down 27%yr excluding refinancing), but so has the owner-occupier pulse (down 5%yr excluding refinancing). This highlights a material shift in conditions for the housing sector, where national prices are now down 2.7% since their peak a year ago (6.1%yr in Sydney and 3.4%yr in Melbourne) according to data from CoreLogic. The combination of price declines, high household debt and persistent weakness in wage growth is why the RBA continues to see household consumption as a "continuing source of uncertainty" and Westpac believes that consumption growth will slow in 2019.
To us, another reason to be cautious over the outlook for growth is the downturn in dwelling investment that is forming. While investment in this sector has held up better than we anticipated, recent data prints point to the level of activity giving way. In August, dwelling approvals fell 9.4% to be down 13.6% on a year ago. Leading the decline, private unit approvals plunged by 17% in the month to be 24% lower over the year. As a result, activity in this sub-sector is now the weakest it has been since October 2016, and before that June 2014. We expect this downtrend to remain in place over the coming year, and result in dwelling construction falling through 2019 – a distinct contrast to the first half of 2018 when the sector added 0.3ppts to aggregate growth.
Switching to the US, there both the tone of data and central bank communication has been unequivocally positive – and robustly so. While the manufacturing ISM edged back from its 14-year high of August in September, the most-recent result was still at the top end of the historical range. The underlying detail of the September report also continued to show broadbased strength across domestic and external demand – the latter coming despite US dollar strength and a softening global economy. Released a few days later, the non-manufacturing ISM survey buoyed the market with yet more positive sentiment as it surged to a historic high – note this series dates back to 2008. This looks to have been the catalyst for the above jump in term interest rates.
With partial data like this coming on the back of persistent strength in the labour market, it is unsurprising that Chair Powell and other members of the FOMC remain so positive on the outlook. From recent communications, the Committee anticipates enduring strength, but not a building of inflation risks. Indeed, in numerous recent speeches since the September meeting, Chair Powell's focus has remained squarely on the opportunity that a gradual normalisation of policy provides rather than a need to get ahead of the curve for fear of inflation. The peak of this rate hike cycle will be determined by where neutral lays, and the degree of momentum the economy carries through 2019. We are cautious on both fronts and hence see an end of rate hikes at June 2019. However, we must also remain wary of the upside risks to rates that could spring from an extended period of above-trend growth and further employment gains (an inflation threat), or an uplift in productivity that boosts potential growth and hence the neutral rate.
This week's market action highlight that participants are beginning to not only fully price in our baseline view of three further fed fund rate hikes to June 2019 but also, at the margin, a chance these upside risks could develop. Our latest Market Outlook publication will be released later today, and covers all of the detail of this debate and the implications for financial markets.
Finally on Asia, the September PMIs for China reported a further deterioration in external orders consistent with softer global growth. However, domestic momentum was again shown to be robust, particularly in the services sector. As the tariff effect builds into 2019, Chinese authorities will look to provide an offset by supporting the domestic economy. This should see GDP growth sustained above 6.0% through 2019. Elsewhere in Asia, those most exposed to US/China tensions are under stress and face an uncertain outlook (Taiwan is the best example). Momentum in other countries in the region however remains around trend. For some in this group, there is tentative evidence that currency depreciation is aiding export volumes – India being the prime example. However, it is not all good news for these nations, with inflation also having been boosted by the lower currency, begetting a need for central banks to react by tightening policy.
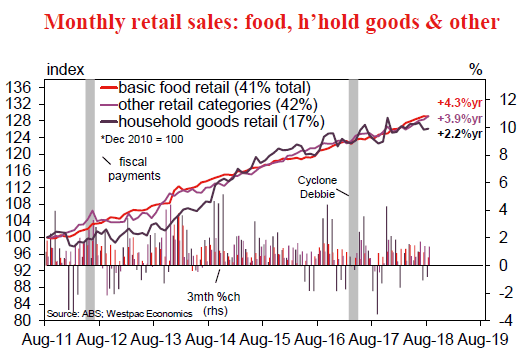
Chart of the week: Australian retail sales
Australian retail sales increased by 0.3% in August, just above Westpac and consensus expectations for a 0.2% gain.
The store type detail showed food flat in the month and as it accounts for 41% of total sales, it weighed on the headline monthly change. With food, it is typically unclear whether nominal changes are reflective of prices or volumes. The flat read in August follows four months of consistent 0.3% increases.
Other categories were more positive in August, department stores up 0.9%, clothing +0.8% and cafes and restaurants +0.7%. Household goods retailing remains subdued, up just 0.2% with electrical goods retailing down 0.5%. Of particular interest within household goods is any spill-overs from the declines in home prices. Absolute spending on household goods is flattening out while the other retail categories have continued at trend.
New Zealand: week ahead & data wrap
A winter of discontent?
Business confidence has fallen significantly over the past year. There's no doubt that at least some of this comes from firms registering their discontent with the new Government's policies. But there are also some genuine reasons for concern, as firms are finding their margins squeezed between rising costs and slowing consumer demand.
This week saw the release of the Quarterly Survey of Business Opinion (QSBO) for the September quarter. General sentiment fell to -28, its lowest level since 2009, matching the fall that we've seen in the monthly ANZ survey. The more informative ownactivity measure fell by a smaller degree, but was still at its lowest level since 2012. On its own, the survey suggests some downside risk to our forecast of a 0.7% rise in September quarter GDP.
Readers may be feeling some fatigue at the debate around whether business confidence surveys tell us anything useful. However, the QSBO warrants some attention for a number of reasons.
The first is that, over time, the QSBO has proven to be the more reliable early indicator of economic activity, compared to the monthly survey. Indeed, the message from the latest QSBO was a little more nuanced than what we've seen elsewhere: firms reported that the last three months were tougher, but the outlook for the next three months was little changed from the previous survey.
The QSBO's better track record as an indicator of GDP largely stems from the fact that, unlike the monthly survey, it hasn't shown a persistent downward bias under centre-left governments. However, that's not to say that it is entirely free from political influences.
The latest QSBO explored this aspect by asking businesses why they responded the way that they did. For those who see the economic outlook getting worse, government policy was by far the most common reason given. (For firms who are more optimistic, finding workers is their biggest concern.) Unfortunately, the survey didn't uncover which particular policies are worrying businesses, but employment law is likely to be high on the list.
There are some interesting parallels between today and the year 2000, during what was dubbed the 'winter of discontent'. Then, a recently elected Labour-led Government was also working to pass legislation (the Employment Relations Act) that would strengthen workers' rights to collective bargaining with employers. Business organisations lobbied vigorously against these changes, and surveys of business confidence (including the QSBO) fell suddenly and sharply in mid-2000. Notably, within a few months after the legislation was passed, business confidence rose back to its previous levels.
So is the recent plunge in business confidence just a message of protest? No, or at least not entirely. There is plenty of corroborating evidence that the economy's pace of growth has slowed since its peak in 2016 – though it's nowhere near the recessionary levels that the headline measures of business confidence would imply. Moreover, the details of the QSBO suggest that businesses are not merely unhappy with who's in power, but are genuinely feeling the pinch in some areas.
The first aspect is that over the last few quarters a growing number of firms have said that demand is the biggest constraint on their growth (as opposed to supply-side factors such as the availability of labour). Concerns about demand haven't risen dramatically, but this marks a break in the downward trend going back to 2010, as the economy recovered from the Global Financial Crisis.
There is certainly evidence that growth in consumer spending has slowed in the last year or so, in line with the slowdown in house price growth. We expect that the Government's Families Package, which came into effect from July, will help to lift spending growth in the near term. But since the package is largely aimed at lowincome households, the effects won't be felt evenly – for instance, sales of big-ticket items such as cars are unlikely to see a boost.
The second aspect is that a growing number of firms are reporting an increase in their costs. Some of the likely factors behind this are the increase in the minimum wage earlier this year, rising oil prices, and the fall in the exchange rate which has made imported goods and equipment more expensive.
There has also been a rise in the number of firms reporting an increase in their own prices, but not to the same extent as for their costs. In some ways this relates to the previous issue – demand isn't strong enough for firms to feel confident about passing on cost increases. As a result, more firms are seeing a squeeze on their profit margins, and they expect this squeeze to continue.
Unfortunately, those cost pressures appear to have further to run. As of this week, the New Zealand dollar has fallen to its lowest level since early 2016, with the US dollar in ascendency as its economy gathers speed and US interest rates rise. At the same time, world oil prices have surged above $80 a barrel, due to strong world demand and restricted supply from the OPEC countries. Together, these forces have pushed petrol pump prices up to record highs, and an increase in fuel taxes from this week (up 4c a litre including GST) will add to the pain.
One of the effects of higher petrol prices is that they eat into household budgets, leaving less room for spending in other areas. Next week's electronic card spending figures will shed some light on how consumers fared over September. Data from Paymark (the largest cards processor) shows a solid rise in total spending for the month, but it remains to be seen how much of this was devoted to fuel spending.
Another implication is that it's increasingly likely that inflation will push above the 2% midpoint of the Reserve Bank's target range, for at least a short period. A jump in inflation caused by fuel prices is the kind of thing that the Reserve Bank can look through, if there's reason to believe that it won't continue to rise at the same pace. Nevertheless, it's markedly different from the central case that the RBNZ laid out in its August Monetary Policy Statement, where inflation was expected to remain below 2% until early 2021. At the margin, rising inflation could make OCR cuts a harder sell.
Data Previews
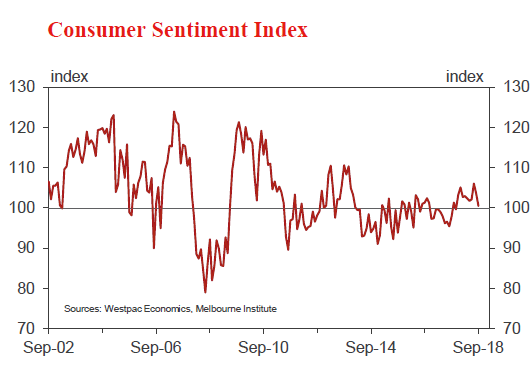
Aus Oct Westpac-MI Consumer Sentiment
Oct 10 Last: 100.5
The Westpac Melbourne Institute Index of Consumer Sentiment declined 3% to 100.5 in September, marking the weakest read since November last year. Confidence was clearly knocked by increases in mortgage interest rates; political instability and ongoing household budget pressures. That said, there appeared to be some support from the strong June quarter growth figures and an encouraging lift in consumers' labour market expectations. Sentiment overall is still in positive territory, albeit only just above the 100 level. A notable feature of the firmer sentiment reads in 2018 is the more even spread across states with a clear improvement in the previously weak mining states.
The October survey is in the field from October 1-6. The backdrop looks a little more settled this month, suggesting some of the impact from September's negatives may dissipate. That said, global trade tensions, slipping house prices and sluggish income growth will remain negatives for sentiment.
Aus Aug housing finance (no.)
Oct 12, Last: 0.4%, WBC f/c: –1.5%
Mkt f/c: -1.0%, Range: -3.0% to 0.5%
While the headline number of owner occupier loans edged up 0.4% in July, this was entirely due to a 3% surge in refi activity with the number of 'new' loans down 0.8%mth to be 9.6% lower over the last year. The value of investor loans also declined 1.3% to be 15.7% lower over the year (an estimated –27%yr ex refi). The soft tone in the detail is consistent with the continued slowing in market conditions evident in auction markets and prices.
The August update is likely to be a weak one. Housing markets continued to correct in the month, albeit with auction clearance rates showing some signs of finding a base. Overall we expect owner occupier finance approvals to be down 1.5%. The value of investor loans will again be of interest, as will the average value of owner occupier loans given the tightening in lending standards that looks to be behind the latest softening in conditions and prices.
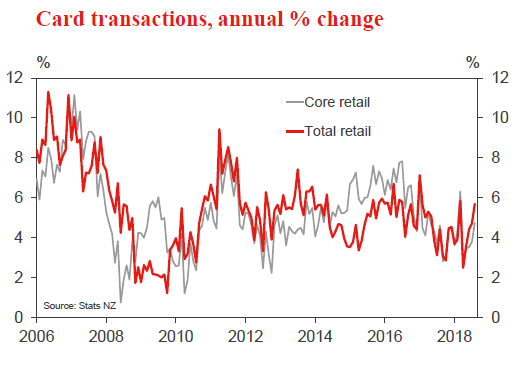
NZ Sep retail card spending
Oct 10, Last: +1.0%, Westpac f/c: +0.7%
Retail spending rose by 1% in August. While spending levels were boosted by an increase in fuel prices, there was growth across all major categories. Spending has been supported by the Government's Families Package, which came into effect on 1 July and has boosted the incomes of many households.
We expect a 0.7% increase in retail spending in September. However, with fuel prices pushing upwards, core spending growth is expected to be more modest at around 0.5%. Increases in disposable incomes are adding to spending in some areas like consumables. But at the same time, the continuing slowdown in the housing market is dampening spending on items like household furnishings.
NZ Sep house sales and prices
Oct 10 (tbc), Sales last: +0.7%, Prices last: +4.1%yr
The housing market has cooled over the past year. Nationwide house sales have slowed, prices in Auckland have drifted lower, and there has been continued softness in Canterbury. However, price growth remains firm in most regions outside of Auckland and Canterbury.
We expect nationwide average house prices to remain fairly subdued over the remainder of the year, with Auckland and Canterbury underperforming the rest of the country. Fixed mortgage rates have fallen recently following a dovish tilt from the RBNZ, and this is likely to provide some boost to house prices. However, there is still a sense of nervousness related to changes in Government policy. Such concerns are particularly acute in Auckland, where there is a greater prevalence of investors and affordability remains highly stretched. At the same time, Canterbury's housing market is continuing its gradual post-earthquake adjustment.
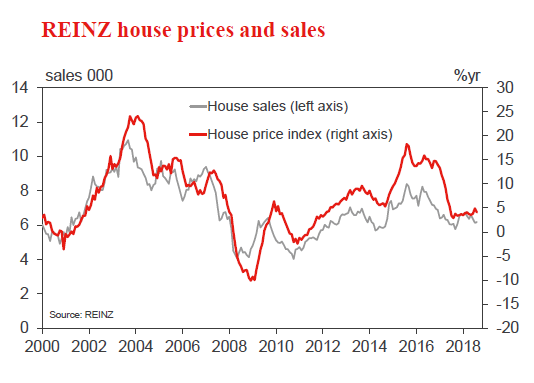
US Sep CPI
Oct 11, last 0.2%, WBC 0.2%
The US headline CPI rose 0.2% in August. The core measure was softer at just 0.1%. Both outcomes were below expectations, as declines in health care and clothing dampened inflation pressures from gasoline and rents. • While the annual headline rate is materially above the FOMC's 2.0%yr inflation target (2.7%yr), on a six and three month basis, the pulse is broadly in line – respectively 1.8% and 2.1% annualised. Core inflation is also consistent with target, at 1.9% on a six-month annualised basis and 2.2%yr for the year.
As per their recent communications, the FOMC see little risk of an acceleration in underlying inflation away from target. Energy prices will however continue to create sporadic volatility, given recent movements in the price of oil.
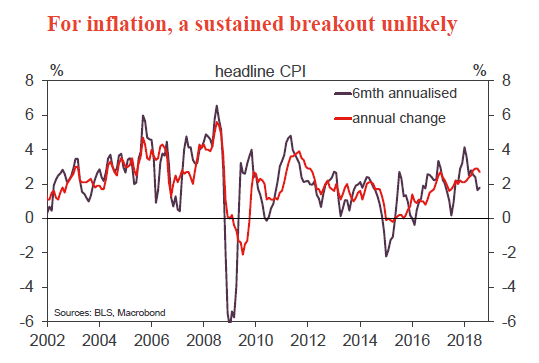
Week Ahead – US Inflation and Chinese Trade Figures to Highlight Quiet Week
US inflation indicators and Chinese trade numbers will be the big data releases during the next seven days, with the economic calendar otherwise looking relatively light. August industrial output figures will be the focus in Europe, while the minutes of the European Central Bank’s September policy meeting should also attract some attention.
Chinese export growth to maintain momentum in September
As the United States continues to pile pressure on Chinese authorities to give US companies more access to the local market, there’s been little evidence so far that the enacted tariffs by the two sides are hurting Chinese exporters. Annual growth in exports stood at 9.8% in August and is forecast to have slowed slightly to 9.1% in September. The data, due on Friday, is also expected to show imports rising by 15.0% in September, pointing to healthy domestic demand.
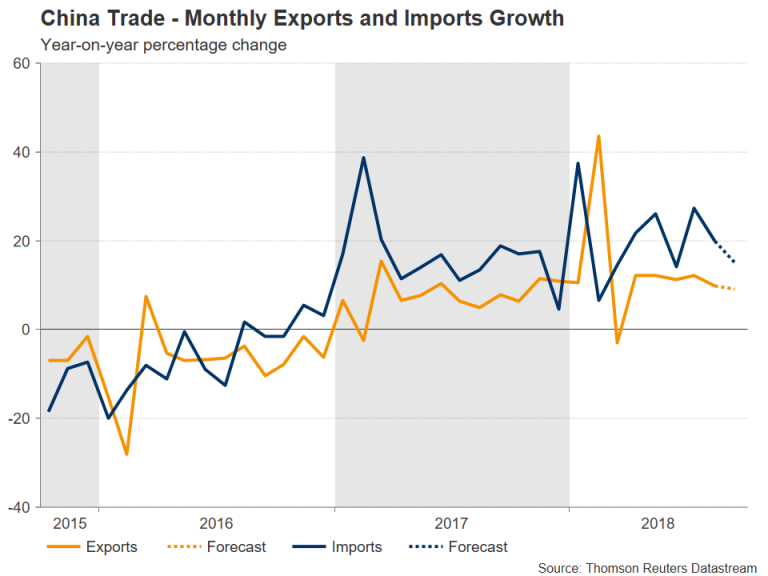
The Australian dollar, which tends to act as a liquid proxy for China-related trades given Australia’s high dependency on exports to China, will likely seek some respite from the past week’s slide if the data comes in mostly in line or better than expected. Aussie traders should also keep an eye on sentiment surveys due out of Australia. The NAB business conditions index is out on Tuesday and will be followed by the Westpac consumer sentiment gauge on Wednesday.
More gains expected for Japanese machinery orders
Capital spending by corporations in Japan has been rising strongly in 2018, lifting growth out of negative territory in the second quarter and defying heightened global trade tensions. Core machinery orders – a forward looking indicator of capital expenditure – are released on Wednesday and are forecast to have fallen back by 4% month-on-month in August after an 11% surge in July. Also of interest will be corporate goods prices (a measure of producer prices in Japan) on Thursday.
The yen, which advanced against most majors this week apart from the US dollar, could extend its gains if the data surprise to the upside. But the Japanese currency would likely continue to struggle vs the bullish greenback even as the Bank of Japan has been allowing the yield on 10-year Japanese government bonds to rise to multi-year highs.
ECB minutes eyed for hawkish tilt
Mario Draghi, the President of the European Central Bank, surprised markets at the recent European Parliament hearing when he described the pick-up in underlying inflation as “relatively vigorous”. Although concerns about Italy’s budget deficit and a strong dollar made the euro’s gains from Draghi’s remarks short lived, investors will still be looking at the account of the ECB’s September policy meeting due on Thursday for signs that policymakers are becoming more confident about the Eurozone’s inflation outlook.
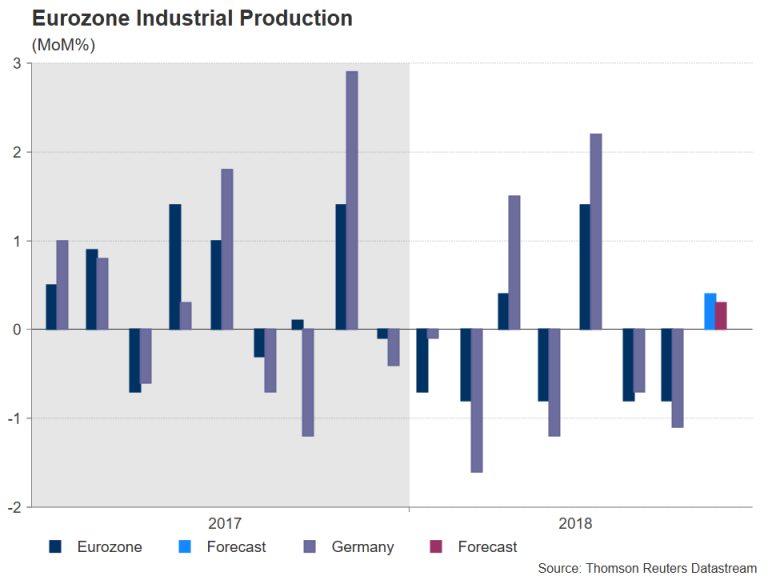
In terms of data, industrial production indicators will dominate the calendar, with German numbers released alongside the euro-wide figures. First up are the German ones on Monday followed by the Eurozone stats on Friday. Industrial output in the Eurozone’s largest economy is projected to have expanded by 0.4% m/m in August, after a 1.1% drop in the prior month. A bounce back is also being anticipated for the Eurozone, with production expected to have risen by 0.3% m/m in August after declining by 0.8% in July. Also to watch are the Eurozone sentix index for October on Monday and German August trade data on Tuesday.
UK to publish monthly GDP and production numbers
British growth was recently revised back down to 0.1% quarter-on-quarter for the first three months of the year, while second quarter growth was confirmed at 0.4%. Things are looking rosier for the third quarter and there should be more evidence of this from the monthly GDP estimates due on Wednesday. UK GDP is expected to have expanded by 0.1% m/m in August, to produce an annual figure of 1.5%. On a 3-month basis, growth is forecast at 0.6%, which would match July’s rate and point to growth of a similar amount for the third quarter.
Industrial and manufacturing production figures, as well as the latest trade numbers will also be released on Wednesday. Both industrial and manufacturing output are forecast to have increased by an unimpressive 0.1% m/m in August, underlining the fact that the services sector remains the main driver of British growth.
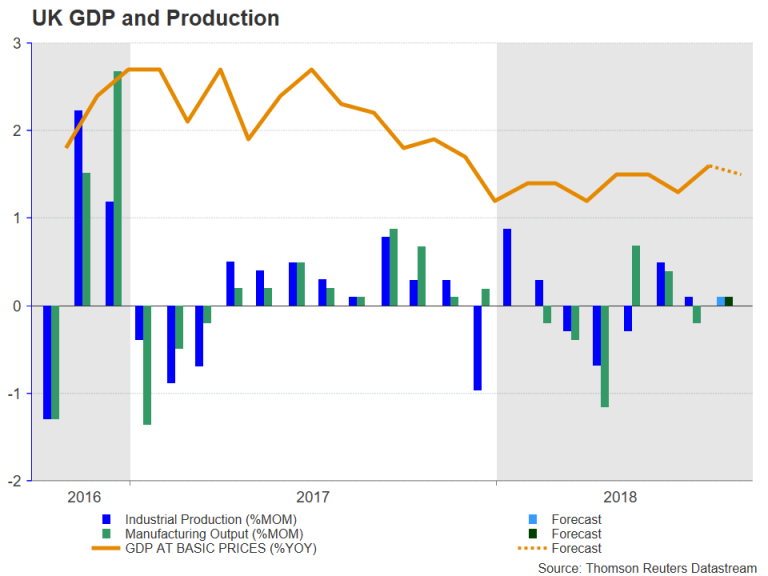
A positive set of data could help sterling make a sustained recovery above the $1.30 level after slipping below the level at the start of the week on the back of a stronger greenback. The pound received a lift, though, later in the week on reports that the UK and the EU are in the last stages of finalising the Withdrawal Agreement. A disappointing economic release is unlikely to weigh on the pound significantly if Brexit-related headlines remain positive. However, a fresh stumbling block in the Brexit talks could offset any upbeat numbers out of the UK.
US inflation to ease further in October
Inflation gauges will be the primary release out of the United States in the coming days, highlighting a muted week. With markets closed on Monday for Columbus Day, September producer prices will start the week on Wednesday. They will be followed by the consumer price index (CPI) on Thursday. The 12-month rate of CPI is expected to have risen by 2.4% in September, edging down from the prior 2.7%. However, the core CPI index is anticipated to tick higher by 0.1 percentage points to 2.3% year-on-year.
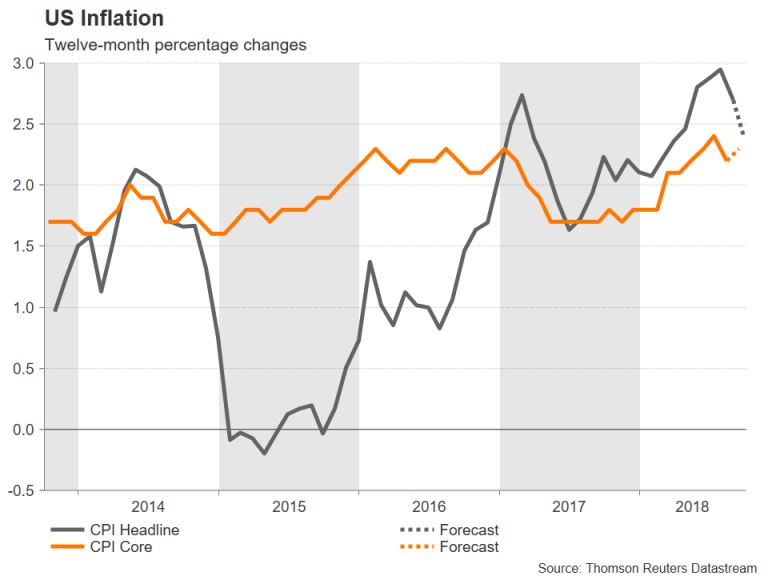
There will be more price barometers on Friday from import prices for September, while the only major non-inflation data will come from the University of Michigan’s preliminary reading of the consumer sentiment index for October.
The dollar is unlikely to see large moves to the CPI numbers, unless there is a large deviation from the forecasts, as it would not alter the Fed’s near-term rate path.