Sample Category Title
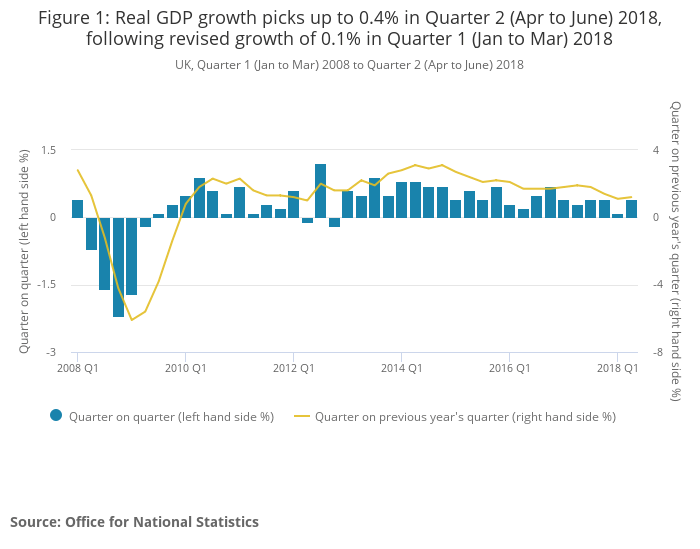
UK Q2 GDP finalized at 0.4% qoq, unrevised
UK Q2 GDP was finalized at 0.4% qoq, unrevised. Growth were driven by services sector, which increased by 0.6%, partly on retail sales. Household spending grew 0.4% but business investment dropped notably by -0.7%. ONS noted that "the recent narrative on UK GDP remains unchanged – the underlying trend is still one of slowing real GDP growth." Also from UK, current account deficit widened to GBP -20.3B in Q2.
EUR/USD Nose Diving After The FOMC Statement
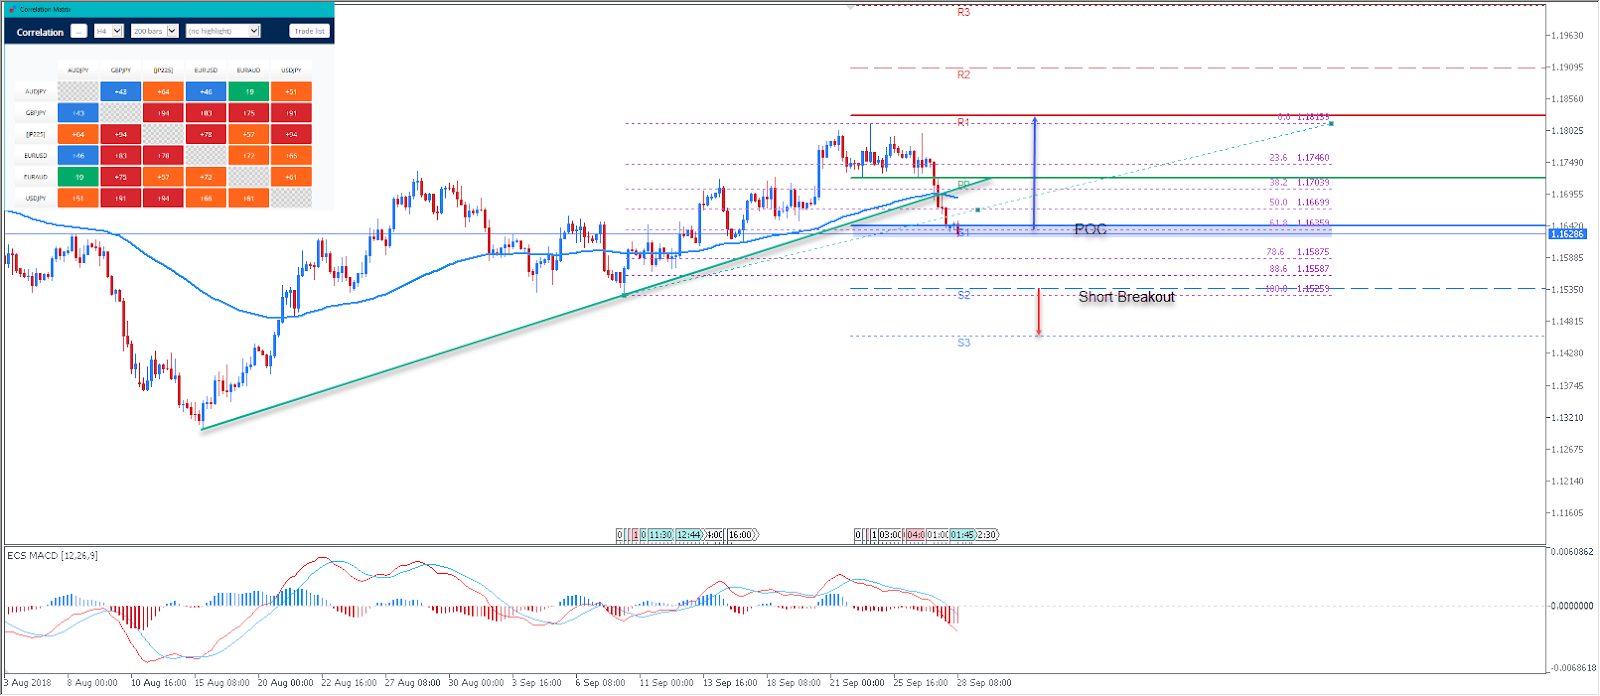
The EURUSD currency pair has dropped from the recent highs, weakened by the FOMC statement, general USD strength and risk-on sentiment. The ECB president Mario Draghi welcomed the growth in the EU economy, however he failed to mention anything regarding interest rates. As head of the ECB, which controls short term interest rates, he has more influence over the euro's value than any other person. Additionally, no major news is expected for the Euro today or next week. Don't forget to follow our Forex calendar for all regular updates on the news, economic announcements, forecasts and much more.
Technically, the EUR/USD currency pair has formed an ascending trend line since August, as we can see on the chart above. However the price broke below the trend line reaching the Admiral pivot point, and its close to S1 support. Rejections from the POC zone 1.1600-15 are possible as long as the 88.6 fib holds- 1.1558. A loss of 88.6 fib might put the pair into neutral-to bearish territory.The price might get a slightly higher than usual volatility at the break of S2 and 1.1525, so be careful and follow the price action as usual.
Pivot Lines - Weekly Support and Resistance
POC - POC - Point Of Confluence (The zone where we expect the price to react - aka the entry zone)
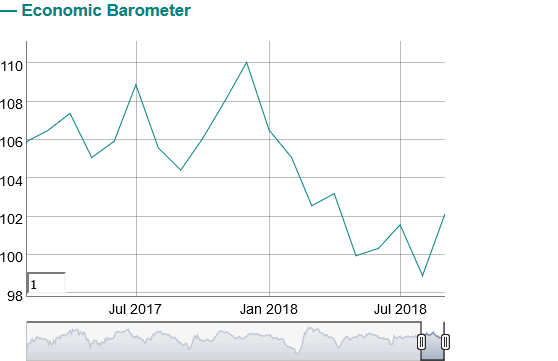
Swiss KOF rose to 102.2, down trend halted
Swiss KOF Economic Barometer rose notably to 102.2 in September, up 3.3 pts from 98.9. It also beat expectation of 100.1. KOF noted the this may imply that the downward trend, which has been visible since the beginning of 2018, might have come to a halt.
The strongest positive contributions came from manufacturing sector. And among manufacturing, "positive development can be attributed mainly to the metal processing industry, followed by the machine building and the food processing as well as the textile industries and finally the chemical industry." Meanwhile, overall improvement in manufacturing is driven by "a more optimistic assessment of employment, followed by the assessments of production and the overall business situation".
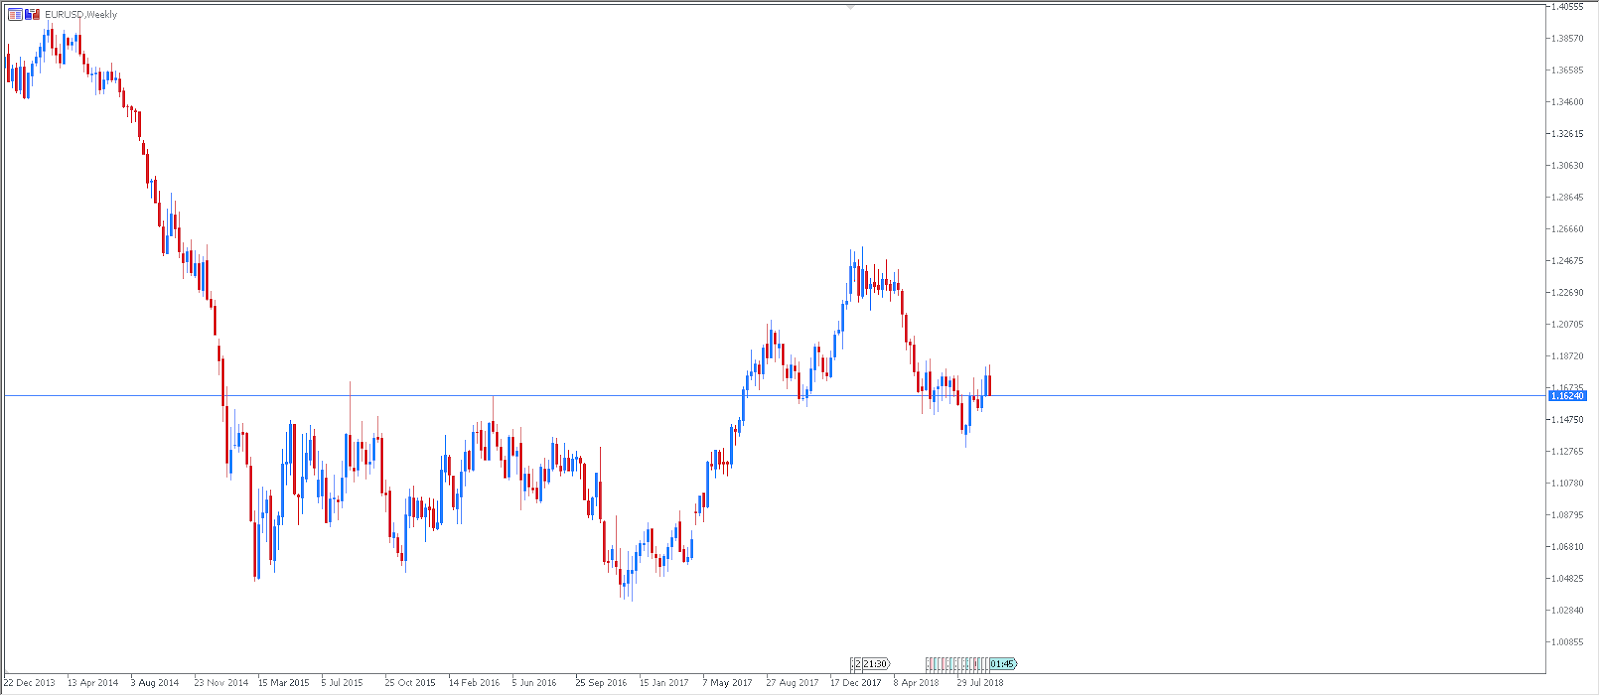
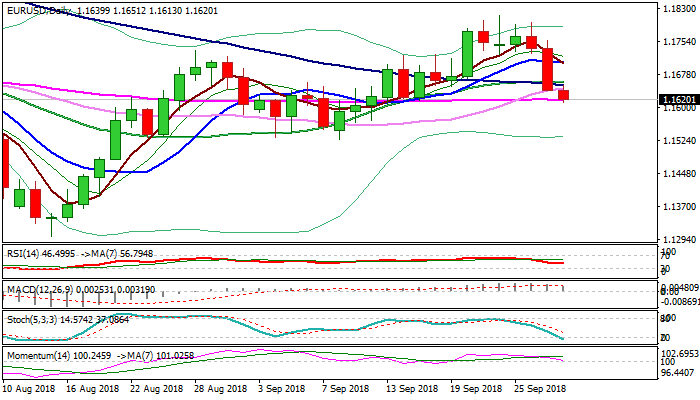
EURUSD Outlook: Threat Of Further Weakness On Weekly Close Below 30SMA
The Euro extended pullback from 1.1815 high through pivots at 1.1655/36 (rising 30SMA/Fibo 61.8% of 1.1526/1.1815 upleg) and cracked sideways-moving 55SMA (1.1617) which marks next key support.
The pair holds in red for the third straight day and made the biggest one-day fall since 14 June on Thursday, as downside pressure increased after release of upbeat US GDP data.
Daily techs are weakening, as MA's are turning to bearish setup and south-heading momentum is approaching the border of negative territory, signaling further downside. Weekly close below 30SMA would generate bearish signal and risk extension towards 1.1526 (10Sep trough).
Daily cloud twists late next week and could act as a magnet.
Meanwhile, bears may take a breather on profit-taking/oversold conditions, with broken 100SMA (1.1652) to ideally cap and guard upper pivots at 1.1700 zone (broken 10SMA/base of thick 4-hr cloud).
Res: 1.1652, 1.1670, 1.1692, 1.1704
Sup: 1.1613, 1.1594, 1.1565, 1.1534
Forex Technical Analysis: EUR/USD, USD/JPY, GBP/USD
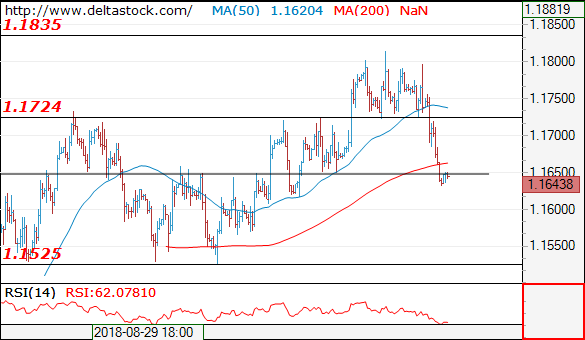
EUR/USD
Current level - 1.1643
The bias is obviously bearish, for a slide towards 1.1530 area. Key hurdle lies at 1.1730.
| Resistance | Support | ||
| intraday | intraweek | intraday | intraweek |
| 1.1650 | 1.1835 | 1.1600 | 1.1300 |
| 1.1730 | 1.2010 | 1.1530 | 1.1100 |
 USD/JPY
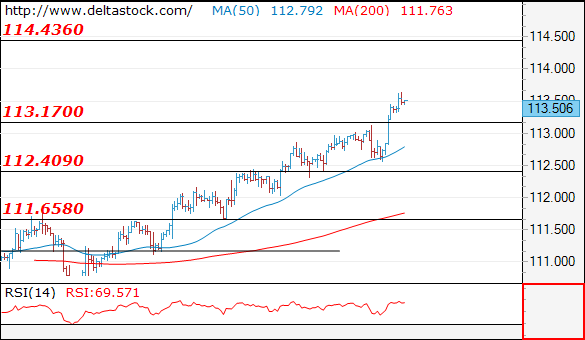
Current level - 113.50
Yesterday's slide failed to reach 112.40 and the uptrend was renewed, heading towards 114.40 area. Key intraday support lies at 113.20.
| Resistance | Support | ||
| intraday | intraweek | intraday | intraweek |
| 113.20 | 114.40 | 112.70 | 111.65 |
| 114.40 | 114.40 | 112.40 | 110.40 |
GBP/USD
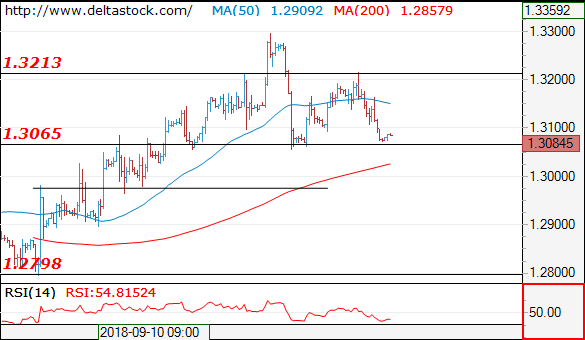
Current level - 1.3084
My outlook here is bearish, for a break through 1.3065, en route to 1.2970.
| Resistance | Support | ||
| intraday | intraweek | intraday | intraweek |
| 1.3210 | 1.3440 | 1.3065 | 1.2570 |
| 1.3295 | 1.3440 | 1.2970 | 1.2570 |
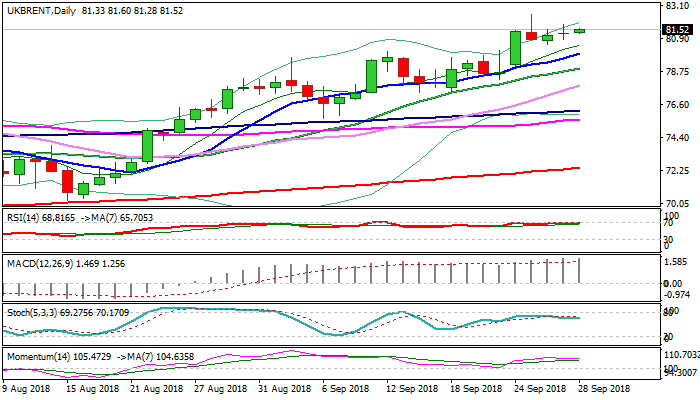
Brent Oil Outlook: Extended Consolidation To Precede Fresh Upside, Strong Bullish Signal On Weekly Close Above $80
Brent oil edged higher in early Friday's trading, signaling that corrective pullback from new four-year high at $82.53, which found footstep at $80.51, might be over. Fresh advance is offsetting impact from Thursday's long-legged Doji candle, with contract being on track for the third consecutive bullish weekly close and looking for strong signal on eventual weekly close above broken psychological $80 barrier after repeated failure in May (spikes to $80.48/47 were short-lived). Bullish daily techs remain supportive, but sideways-moving momentum suggests the price may hold in extended consolidation before fresh push higher. Bulls also look for close above next pivotal barrier, cracked Fibo 61.8% of $115.68/$27.09 fall) to generate another strong bullish signal for extension towards $87.92 (29 Oct 2014 high). Overall sentiment remains bullish, with focus on US sanctions on Iran, but traders are still trying to estimate potential impact to global supply once the sanctions start on Nov 4, with concerns whether OPEC and Russia will be able to cover the gap in supply after Iran will be out. Consolidation range low at $80.51 marks solid support, guarding $80.00 pivot (reinforced by rising 10SMA) which needs to hold extended dips and keep bulls intact.
Res: 81.87, 82.53, 82.84, 83.00
Sup: 81.28, 80.83, 80.51, 80.00
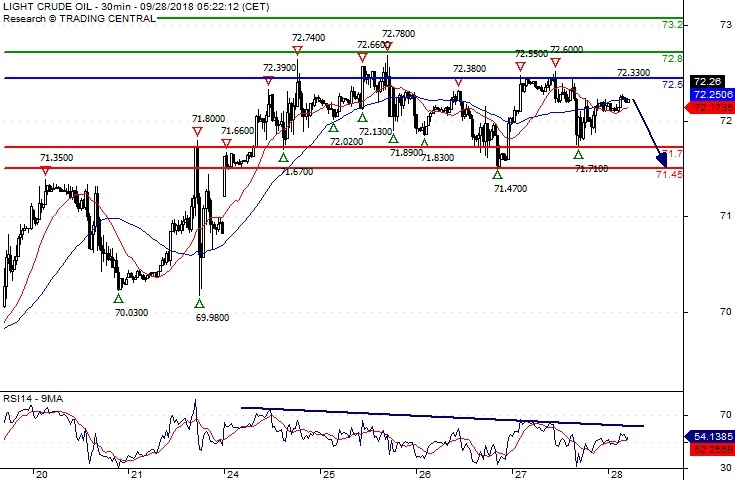
Crude Oil Consolidation In Place
Pivot (invalidation): 72.50
Our preference Short positions below 72.50 with targets at 71.70 & 71.45 in extension.
Alternative scenario Above 72.50 look for further upside with 72.80 & 73.20 as targets.
Comment The RSI is capped by a bearish trend line.
Silver Spot Caution
Pivot (invalidation): 14.3000
Our preference Short positions below 14.3000 with targets at 14.2000 & 14.1500 in extension.
Alternative scenario Above 14.3000 look for further upside with 14.3800 & 14.4500 as targets.
Comment The RSI is mixed and calls for caution.
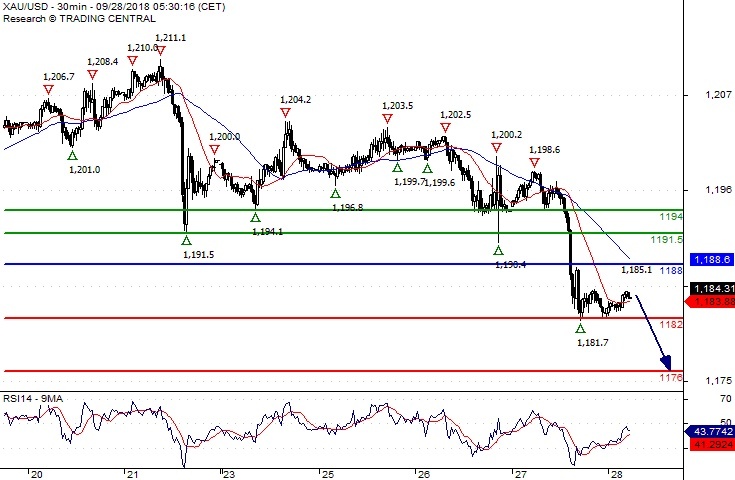
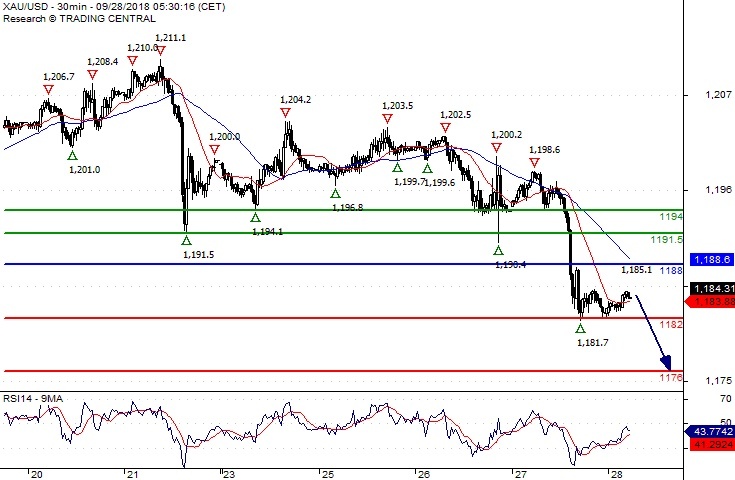
Gold Spot Key Resistance At 1188.00
Pivot (invalidation): 1188.00
Our preference Short positions below 1188.00 with targets at 1182.00 & 1176.00 in extension.
Alternative scenario Above 1188.00 look for further upside with 1191.50 & 1194.00 as targets.
Comment The RSI is mixed to bearish.
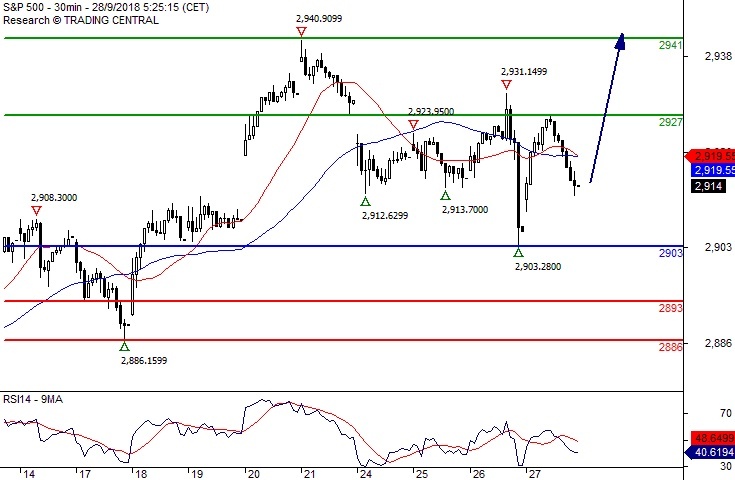
S&P 500 Intraday Support Around 2903.00
Pivot (invalidation): 2903.00
Our preference Long positions above 2903.00 with targets at 2927.00 & 2941.00 in extension.
Alternative scenario Below 2903.00 look for further downside with 2893.00 & 2886.00 as targets.
Comment The RSI is mixed to bullish.