Sample Category Title
XAUUSD Analysis: Trades At 1,200.00
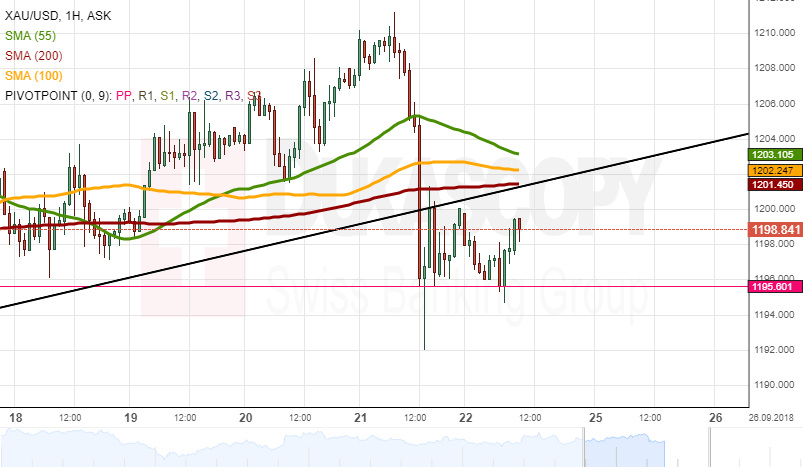
The gold price depreciated 0.65% since Friday's trading session. On Monday morning, the yellow metal was located at the 1,200.00 mark.
The fundamentals pushed the rate downwards to pass through the SMAs, which were supporting the rate for the previous two sessions. On Monday, the SMAs are playing a role of resistance for gold.
Most likely, the yellow metal will trade downwards due to the resistance of the SMAs to stay in the range between the 1,202.00 and the monthly pivot point at 1,195.00 mark.
On the other hand, the rate might move through the SMAs if there are bullish fundamental news during the day.
Euro Continues To Rally Underpinned By Better Than Expected IFO Data
Notes/Observations
- German IFO beats, keeps Euro and Yields bid -Sterling appreciates on Brexit Minister Raab comments
- European Indices trade slightly lower across the board tracking losses in Asia
Asia:
- Japan said to consider bilateral trade agreement with the US; could lead to lower tariffs on US agriculture imports and avoid higher tariffs on Japanese autos.
- US tariffs on $200B in China goods take effect, China has canceled upcoming trade talks with US amid escalating tariff threats
- China says door of negotiations always open, but talks will not happen under tariff threat
Europe:
- UK Brexit Minister Raab on radio interview confident will get deal at the end, confident progress will be made; Cable rises -Reportedly aides to PM May have started contingency planning for possible snap election in November, Brexit Minister Raab reiterated the UK is standing firm on Brexit proposals, no election is planned
- UK Foreign Sec Hunt refuses to rule out Canada-style Brexit deal
- German September IFO comes ahead of consensus but declines slight from the prior month, uncertainty growing among companies Energy At meeting on Sunday, OPEC+ affirmed plans to gradually continue increasing crude output in line with decision from the summer
Economic Data:
- (DE) GERMANY SEPT IFO BUSINESS CLIMATE: 103.7 V 103.2E; CURRENT ASSESSMENT: 106.4 V 106.0E
- (CH) SNB Total Sight Deposits for Week Ended Sept 21st (CHF): 577.6B v 577.1B prior
Fixed Income Issuance:
- Non seen
SPEAKERS/FIXED INCOME/FX/COMMODITIES/ERRATUM
Equities
- Indices [Stoxx50 -0.3% at 3,419, FTSE -0.1% at 7,480, DAX -0.3% at 12,389, CAC-40 -0.2% at 5,481, IBEX-35 -0.5% at 9,543, FTSE MIB -0.5% at 21,427, SMI % at , S&P 500 Futures -0.2%]
- Market Focal Points/Key Themes: European indices open broadly lower and remain negative as the session wore on; risk sentiment impacted over trade concerns as US tariffs come into effect and China cancels trade talks; consumer discretionary sector among worst performers, especially autos; Sky confirmes to be acquired by Comcast; Randgold confirms to be acquired by Barrick; over weekend rumors surfaced that Casino rejected offer from Carrefour, which was later denied by Carrefour; attention turning to the Fed's monetary policy decision later in the week
Equities
- Consumer discretionary: Gerry Weber GW1.DE -19.9% (studying restructuring), Sky SKY.UK +8.8% (to be acquired), Tarkett TKTT.FR -4.9% (analyst action), Thomas Cook TCG.UK -19.7% (trading update, CFO steps down), Tomtom TOM2.NL -5.6% (Toyota to add Android Auto)
- Consumer staples: Greenyard GREEN.BE +0.2% (asset sale)
- Energy: Tullow Oil TLW.UK +1.6% (exploration update)
- Healthcare: Coloplast COLOB.DK -2.5% (analyst action), Mithra Pharmaceuticals MITRA.BE +2.6% (licence deal), Solvay SOLB.BE +0.8% (investor update)
- Materials: Randgold RRS.UK +3.6% (to be acquired)
- Utilities: Engie ENGI.FR -0.6% (cuts outlook)
Speakers
- (IT) Italy FinMin Tria to fix 2019 deficit at 1.6%; Gov may talk with EU on possibly wider gap - press
- (CN) China says door of negotiation always open, but talks should be based on mutual respect and equality; Trade talks will not happen under tariff threat - press
- (UK) UK Brexit Secretary Raab: Wants a good deal with the EU, but ready for a no deal - radio interview IFO Economist Wohlrabe: Despite good business sentiment there is increasing uncertainty among companies (IR) Iran Oil Min Zanganeh: OPEC + meeting yield no positive result for President Trump
Currencies
- GBPUSD trades firmer reclaiming the 1.31 handle after comments with UK Brexit Min Raab says confident will make progress on Brexit. The Indian rupee continues to weaken, with the USD/INR rising to a high of 72.73 as suspected central bank intervention helped cap gains. Trade concerns continue to weigh as China cancels trade talks with the US.
Fixed Income
- Bund Futures trades at 158.84 down 22 ticks after German IFO business morale falls less than expected. Resistance moves to 161.82 then 163. A downside break of 158.25 sees 157.69 initially.
- Gilt futures trades at 121.08 down 20 ticks following the move in Treasuries. Continued support at 120.50, with a continued move higher targeting 123.93 then 124.00.
- Monday 's liquidity report showed Friday's excess liquidity rose from €1.851T to €1.861T. Use of the marginal lending facility stayed steady from €30M to €21M.
- Corporate issuance saw high grade issuers raise $34.3B in the primary market last week
Looking Ahead
- 06:00 (UK) Sept CBI Industrial Trends Total Orders: 4e v 7 prior
- 07:00 (BR) Brazil Sep FGV Consumer Confidence: # v 83.8 prior
- 07:25 (BR) Brazil Central Bank Weekly Economists Survey
- 07:30 (TR) Turkey Sept Real Sector Confidence (Seasonally Adj): No est v 96.3 prior; Real Sector Confidence (NSA): No est v 96.4 prior, Capacity Utilization: No est v 77.8% prior
- 08:00 (PL) Poland Aug M3 Money Supply M/M: 0.6%e v 0.3% prior; Y/Y: 7.5%e v 7.3% prior
- 08:00 (CL) Chile Aug PPI M/M: No est v -2.8% prior
- 08:05 (UK) Baltic Dry Bulk Index
- 08:30 (US) Aug Chicago Fed National Activity Index: 0.20e v 0.13 prior
- 08:30 (CA) Canada July Wholesale Trade Sales M/M: +0.4%e v -0.8% prior
- 09:00 (BE) Belgium Sept Business Confidence: -0.6e v -0.3 prior
- 09:30 (BR) Brazil Aug Current Account: -$1.3Be v-$4.4B prior; Foreign Direct Investment (FDI): $9.5Be v $3.9B prior
- 10:30 (US) Sept Dallas Fed Manufacturing Activity: 31.0e v 30.9 prior
- 16:00 (US) Weekly Crop Progress Report
USDCHF Looking Bearish In The Short And Medium Term
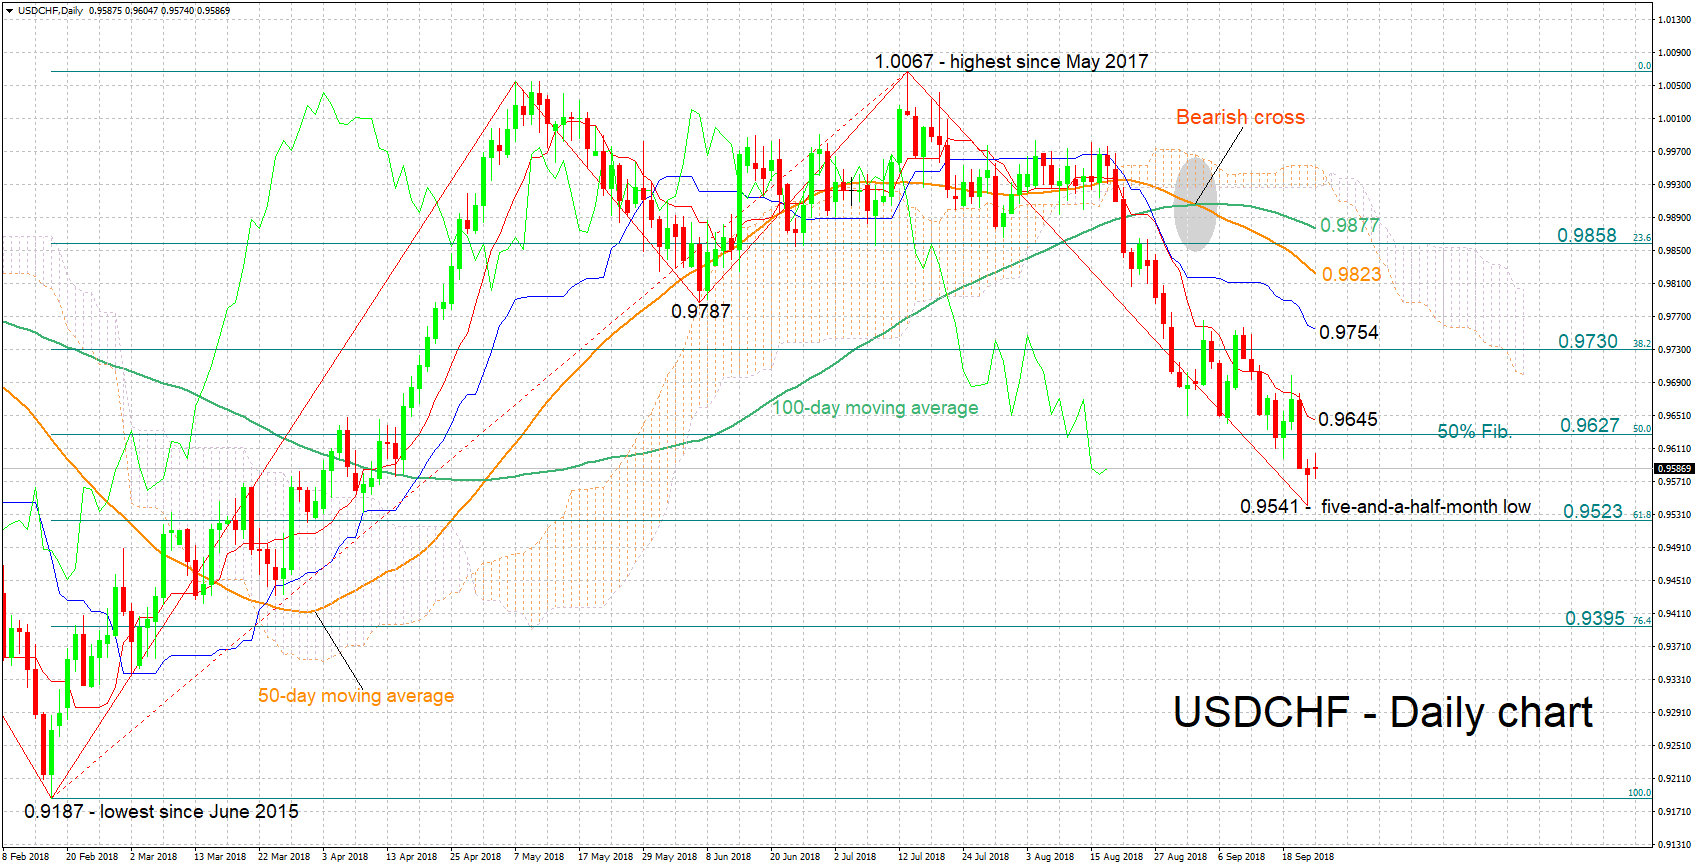
USDCHF lost 4.8% after reaching its highest since May 2017 of 1.0067 around mid-July. It is currently trading not far above a five-and-a-half-month low of 0.9541 tracked on Friday.
The Tenkan- and Kijun-sen lines are negatively aligned in support of a bearish short-term bias for the pair.
Should USDCHF extend lower, support may come around the 61.8% Fibonacci retracement level of the upleg from 0.9187 to 1.0067 at 0.9523; last week’s five-and-a-half-month nadir of 0.9541 is also part of the area around this point. Lower still, the 76.4% Fibonacci mark at 0.9395 would increasingly come into scope.
On the upside, resistance could occur around the 50% Fibonacci level at 0.9627; the Tenkan-sen lies not far above at 0.9645. Further above, the focus would turn to the 38.2% Fibonacci point at 0.9730.
The medium-term picture is looking bearish, with price action taking place below the 50- and 100-day (simple) moving average lines, as well as below the Ichimoku cloud. Overall, trading activity is confirming the negative medium-term signal given by the bearish cross recorded in early September when the 50-day MA moved below the 100-day one.
To sum up, both the short- and medium-term outlooks are looking predominantly negative at the moment.
The Analytical Overview Of The Main Currency Pairs
The EUR/USD currency pair
Technical indicators of the currency pair:
Prev Open: 1.17764
Open: 1.17401
% chg. over the last day: -0.23
Day's range: 1.17368 – 1.17523
52 wk range: 1.0571 – 1.2557
On Friday, the EUR/USD currency pair moved away from local highs. At the moment, the technical pattern is ambiguous. The EUR/USD quotes are testing local support and resistance levels: 1.17300 and 1.17700, respectively. The positions should be opened from these marks. The further growth of the EUR/USD currency pair is not excluded.
The news feed on 2018.09.24:
German Ifo business climate index at 11:00 (GMT+3:00).
We also recommend paying attention to the speech by the ECB president Draghi.
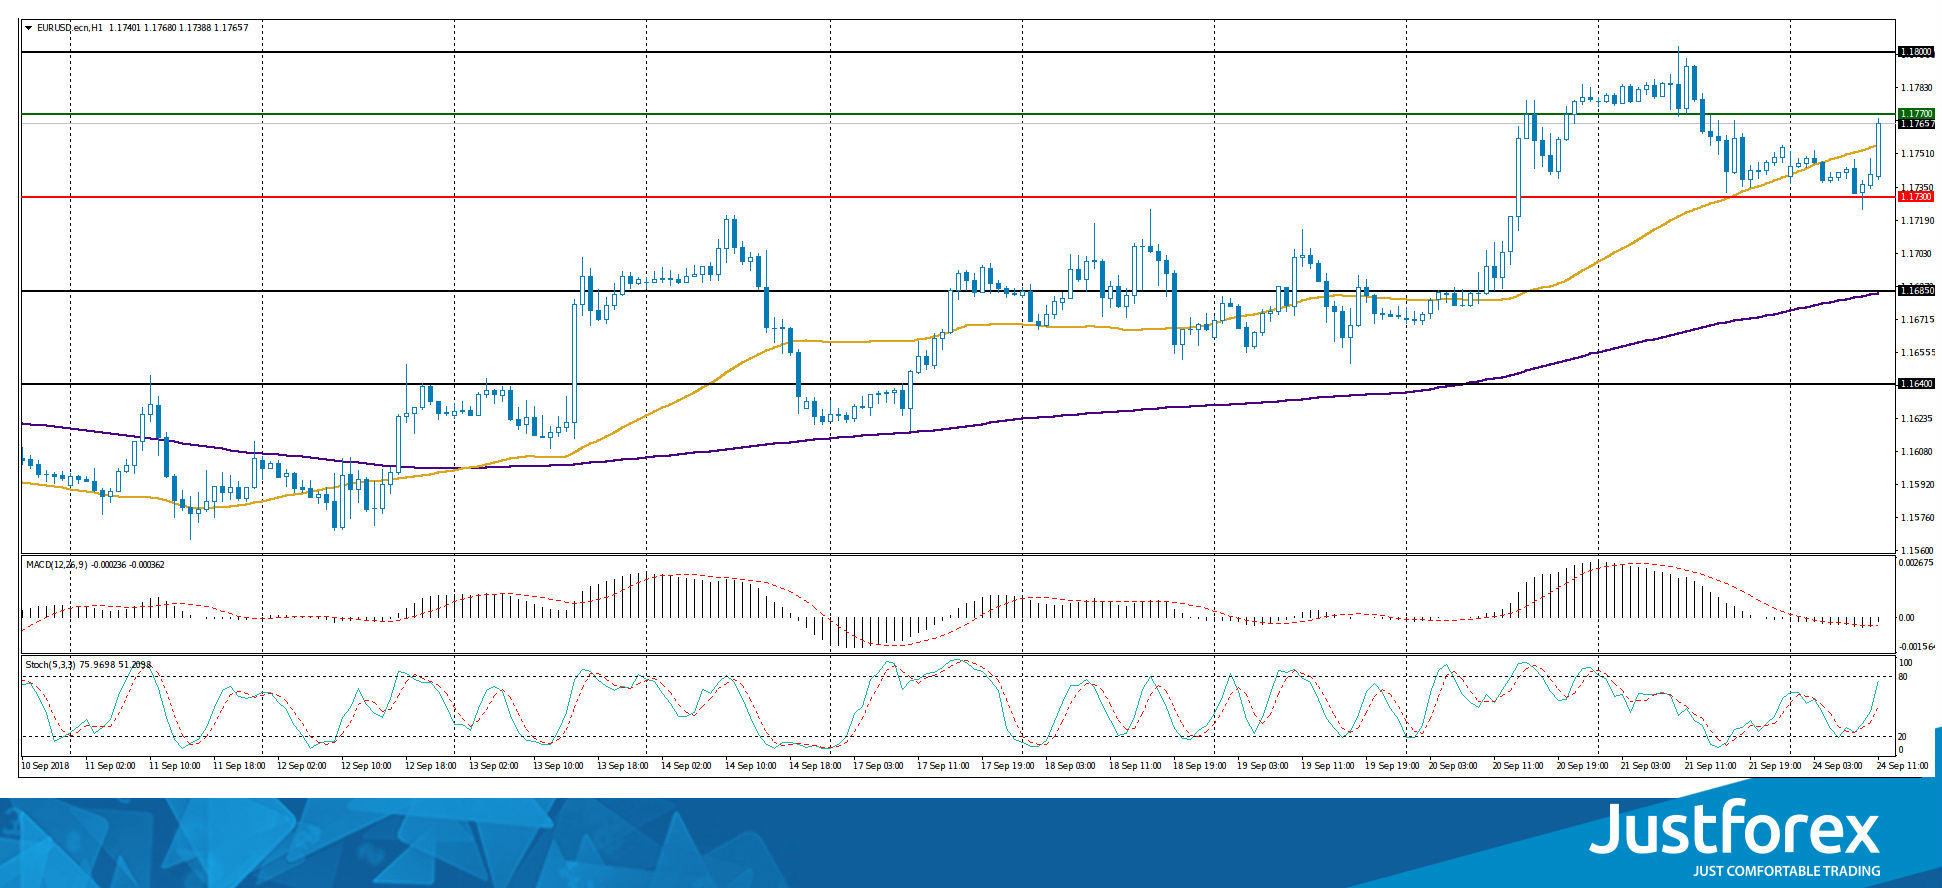
Indicators do not send accurate signals: the price has crossed 50 MA.
The MACD histogram is near 0 mark. There are no accurate signals.
Stochastic Oscillator is located in the neutral zone, the %K line is above the %D line, which indicates the growth of quotes.
Trading recommendations
Support levels: 1.17300, 1.16850, 1.16400
Resistance levels: 1.17700, 1.18000
If the price fixes above the resistance level of 1.17700, further growth of the EUR/USD quotes is expected. The movement is tending to 1.18000-1.18200.
An alternative may be the decrease of the EUR/USD currency pair to 1.16850-1.16400.
The GBP/USD currency pair
Technical indicators of the currency pair:
Prev Open: 1.32500
Open: 1.30749
% chg. over the last day: -1.43
Day's range: 1.30963 – 1.31151
52 wk range: 1.2361 – 1.4345
On Friday, aggressive sales were observed on the GBP/USD currency pair. The decrease in quotes exceeded 175 points. The British pound weakened significantly against the US dollar after Theresa May stated that Brexit negotiations were at an impasse. At the moment, the key trading range is 1.30700-1.31300. The positions should be opened from these marks.
Today, the news feed on the UK economy is calm.
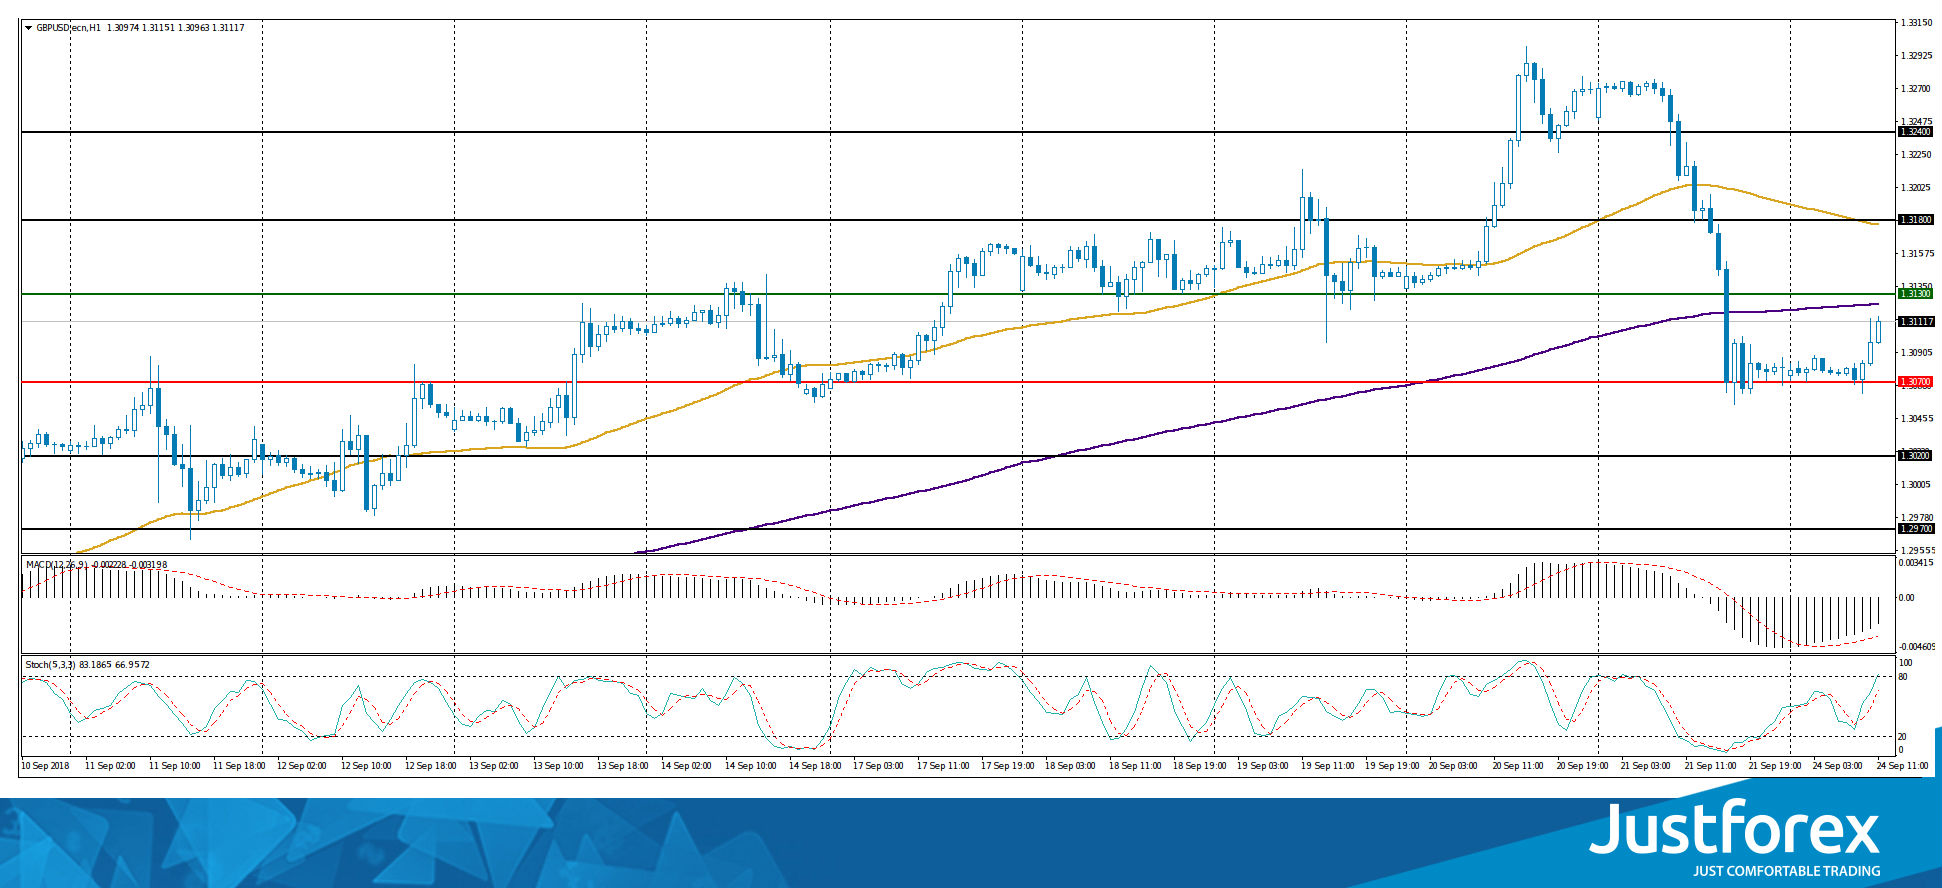
The price has fixed below 50 MA and 200 MA, which signals the power of sellers.
The MACD histogram is located in the negative zone, but above the signal line, which gives a weak signal to sell GBP/USD.
Stochastic Oscillator is in the neutral zone, the %K line is above the %D line, which indicates the bullish sentiment.
Trading recommendations
Support levels: 1.30700, 1.30200, 1.29700
Resistance levels: 1.31300, 1.31800, 1.32400
If the price fixes below the local support of 1.30700, further decline in the GBP/USD currency pair is expected. The movement is tending to 1.30200-1.30000.
An alternative may be the GBP/USD quotes growth to the local offer zone of 1.31800-1.32000.
The USD/CAD currency pair
Technical indicators of the currency pair:
Prev Open: 1.29042
Open: 1.29243
% chg. over the last day: +0.09
Day's range: 1.29157 – 1.29276
52 wk range: 1.2059 – 1.3795
The USD/CAD quotes are still in a sideways trend. A unidirectional trend is not observed. According to report published on Friday, the core retail sales index in Canada rose to 0.9% in August instead of 0.6%. Local support and resistance levels are: 1.29150 and 1.29500, respectively. We recommend looking for entry points to the market from these marks.
The news feed on the economy of Canada is calm.
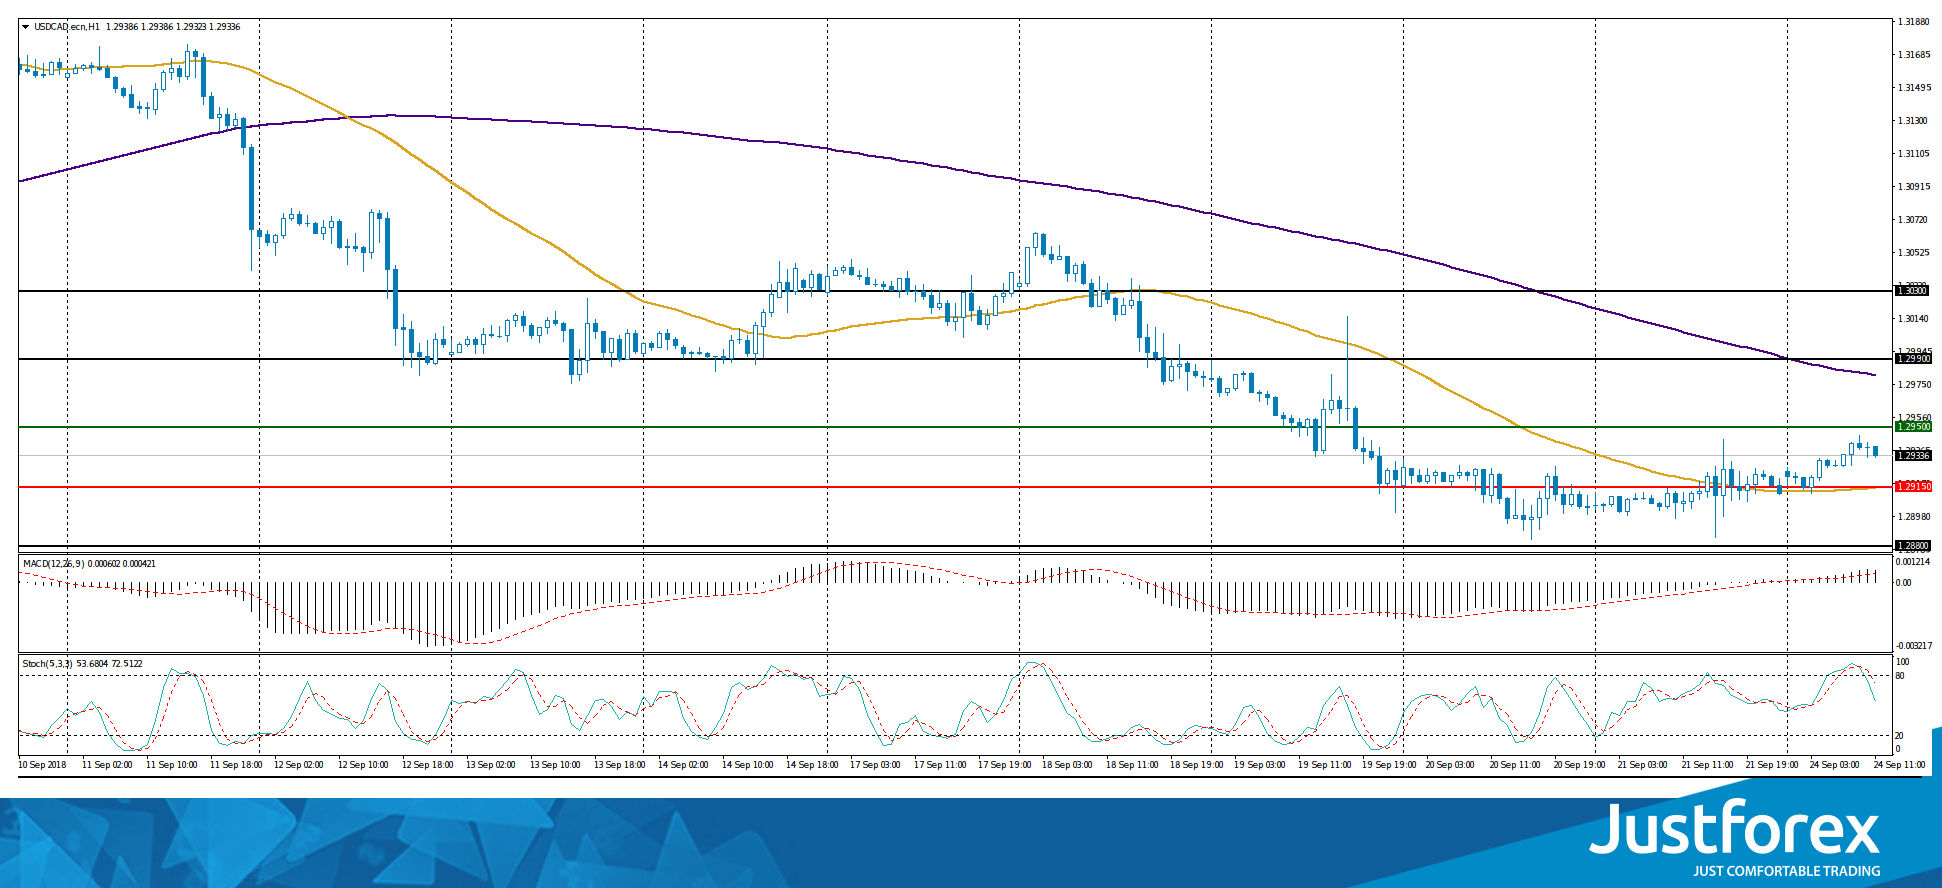
The price has fixed between 50 MA and 200 MA, which are dynamic support and resistance levels.
The MACD histogram is in the positive zone, above the signal line, which signals to buy USD/CAD.
Stochastic Oscillator is in the neutral zone, the %K line is below the %D line, which indicates the bearish sentiment.
Trading recommendations
Support levels: 1.29150, 1.28800
Resistance levels: 1.29500, 1.29900, 1.30300
If the price fixes below the local support of 1.29150, the USD/CAD quotes are expected to decline. The movement is tending to 1.28800-1.28500.
Alternative option. If the price fixes above 1.29500, it is necessary to consider purchases of USD/CAD. The target movement level is 1.29900-1.30300.
The USD/JPY currency pair
Technical indicators of the currency pair:
Prev Open: 112.440
Open: 112.422
% chg. over the last day: +0.07
Day's range: 112.429 – 112.874
52 wk range: 104.56 – 114.74
The technical pattern on the USD/JPY currency pair is ambiguous. At the moment, quotes are consolidating. Local support and resistance levels are: 112.450 and 112.700. We recommend paying attention to the US government bonds yield. Positions should be opened from the key levels.
The news feed on the economy of Japan is calm today.
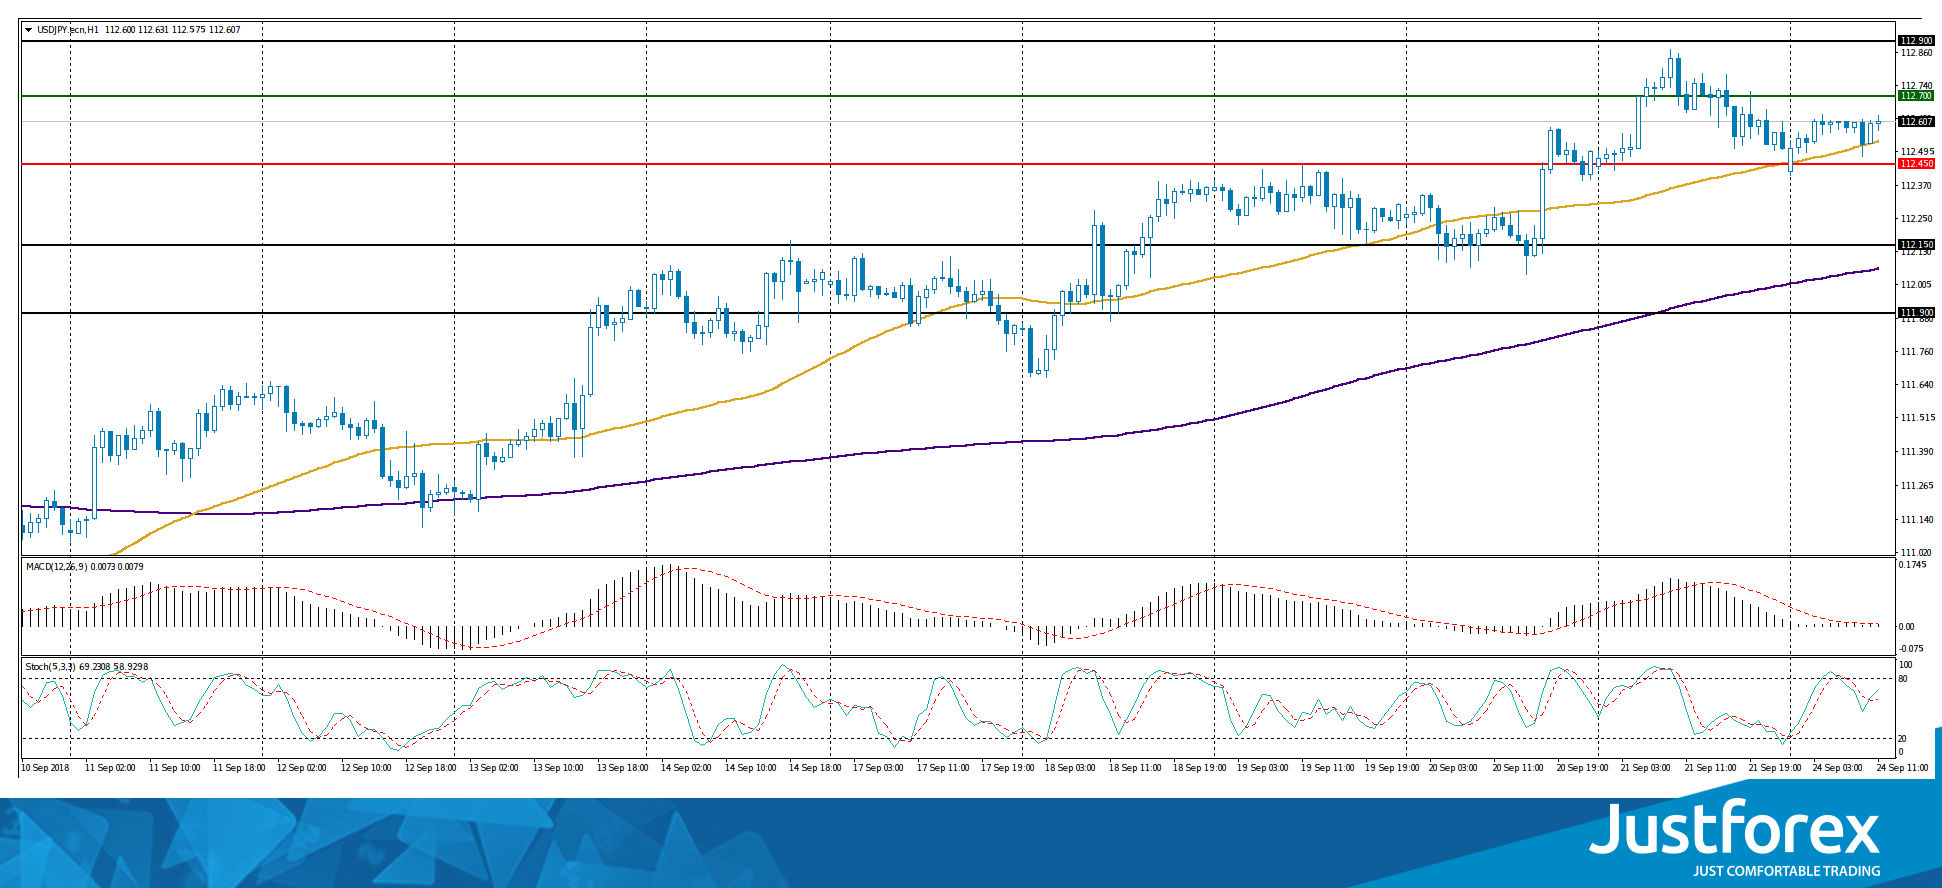
The price has fixed above 50 MA and 200 MA, which signals the power of buyers.
The MACD histogram is located near the 0 mark. There are no signals.
Stochastic Oscillator is in the neutral zone, the %K line has crossed the %D line. There are no accurate signals.
Trading recommendations
Support levels: 112.450, 112.150, 111.900
Resistance levels: 112.700, 112.900
If the price fixes above the resistance level of 112.700, the USD/JPY quotes are expected to rise. The movement is tending to 112.900-113.200.
Alternative option. If the price fixes below 112.450, we recommend looking for entry points to open short positions. The target movement level is 112.150-111.900
WTI Oil Outlook: Surges To 2 ½ Month High On Rising Concerns Over Iran Sanctions
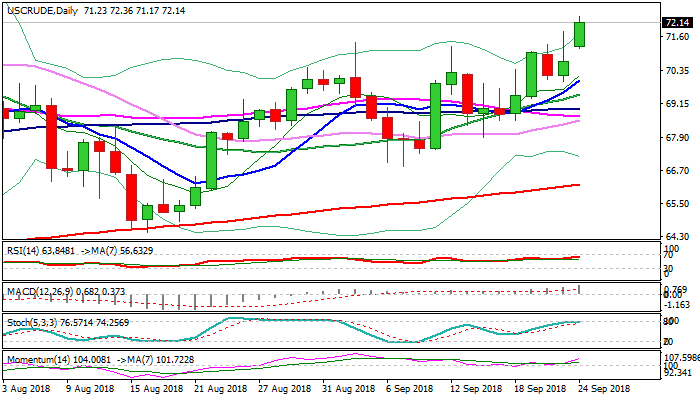
WTI oil opened with gap-higher on Monday and rallied strongly, hitting new high at $72.36 (the highest since 11 July) driven by concerns about upcoming US sanctions on Iran, which already caused a fall in Iran’s oil export.
Tightening global supply and last week’s comment from Saudi Arabia, showing their agreement with higher oil prices, added to strong bullish sentiment.
Monday’s rally made eventual break above cracked Fibo barrier at $71.17 (61.8% of $75.34/$64.43 descend) and also completed inverse H&S pattern on daily chart, generating strong bullish signal.
Daily techs are in full bullish setup and support further advance, but bulls may take a breather before resuming towards target at $72.77 (Fibo 76.4%), as slow stochastic turned sideways at the border of overbought territory.
Shallow dips are expected as positioning for fresh upside, with $71.20 zone (former highs / broken Fibo barrier) expected to ideally hold.
Res: 72.36, 72.77, 73.64, 74.00
Sup: 71.80, 71.17, 70.88, 70.00
US Growth To Slow
US growth to slow
Q4 should see a US slowdown: we suspect China retaliations will erode US growth. This means the tightening cycle is pretty much priced in: 80% probability of a December hike and another 0.8% of tightening over the next 12 months. This Tuesday-Wednesday meeting of the Federal Reserve's monetary managers would have to deliver an extremely hawkish surprise to cause markets to reprice. Since the last monetary meeting, US-China trade tensions have accelerated. Risk to front-end yields are skewed to the downside (US 2-year yields elevated at 2.80%). Easing yields at the short end of the curve will push USD lower against G10 currencies. Any expression of concerns by Fed members will remove hawkishness and press front-end yields lower.
Geopolitical uncertainty keeps USD firm. News that China would withdraw from trade talks with US has fuelled fears. Combined with chaos of Brexit, rising Iran-US tensions and negative developments in Italian budget discussion, markets are risk-off, driving USD higher. The US economic improvement due to Trump fiscal stimulus, tax boost and accelerated investment spending due to trade concerns has offset the natural cyclical slowdown.
Swiss trade surplus to decline
Although Switzerland's balance of payments increased CHF 2 billion to CHF 22 billion in Q2, we expect the trend to reverse in Q3, as the US-China trade war weighs on the franc, which has appreciated against the Euro and US dollar by -2% and -2.80% since the beginning of June. Further trade uncertainties will push the CHF higher, which disadvantages Swiss exporters.
The Swiss economy grew at 3.20% in Q2, above the historical pace of 1.90%) and the Swiss National Bank's forecast of 2%. The country's financial account continues to drop, with both assets and liabilities declining by CHF 50 billion and CHF 60 billion amid divestments from foreign companies due to US tax reforms. EUR/CHF is currently trading at 1.1280, expected to trade sideways.
New Tariffs to Hit China as Trade Wars Continue
The U.S. administration ramped up further tariff increases on goods imports from China last week. The U.S. President Donald Trump announced new tariffs after the closing bell for the stock markets on Monday. This was later followed up by a series of tweets taking a swing at Beijing.
President Trump said that China had openly admitted that they were impacting and changing the elections by attacking the farmers and industrial workers.
He, however, brushed aside his suspicions noting that the tariffs were as a result of the actions from Beijing.
The tariffs came as the President initially announced last week, according to a report from the Wall Street Journal. Trump said that both sides were preparing to hold fresh talks on the tariffs and he expected a deal soon.
Both the administrations have already imposed 25 percent tariffs on over $50 billion of goods from either side. Beijing had further issued new taxes on $60 billion on U.S. goods if the next round of tariffs went into effect.
The new tariffs which are expected to hit over $200 billion in Chinese goods come into effect from Monday, September 24. The tariffs, starting at 10% will be raised to 25% at the start of next year. However, this is subject to the outcome of further negotiations and if China and the U.S. couldn't agree.
Lindsay Walters, the White House spokeswoman said "The President has been clear that he and his administration will continue to take action to address China’s unfair trade practices. We encourage China to address the long-standing concerns raised by the United States."
The President also warned that any retaliatory measures taken by China could result in further tariff hikes. However, China was quick to respond to the threats.
Officials in Beijing slammed the U.S. by imposing 25% tariffs on soybean imports from the U.S.
China has been targeting the soybean sector and other farming products in the agricultural belt in a bid to weaken support for Trump.
The U.S. President said that his administration was open to making a deal to end the trade wars before consumers on both ends start to feel the pain of higher costs.
"China has had many opportunities to address our concerns fully," Trump said noting that "I urge China’s leaders to take swift action to end their country’s unfair trade practices."
The President also threatened to add further tariffs amount to $267 billion on Chinese goods. This would raise the total to $517 billion which leads to pretty much everything that the U.S. imports from China.
Beijing officials, however, called the bluff by adding their tariffs on U.S. goods. Currently, China is seen targeting $60 billion in U.S. products. This is expected to come into effect from September 24. The Chinese administration already levied tariffs of 10% and 5% on over 5000 goods, ranging from coffee and honey to industrial chemicals.
The new round of tariffs comes as the U.S. heads into the mid-term elections.
The market reaction to the news was primarily muted, but this could potentially change if the tariffs went into effect.
China was seen assuring the markets as it said that it had sufficient tools to steer through the economic challenges. Growth is expected to slow in the coming quarters. Recent data already indicated that producer prices were falling.
China is currently targeting a growth rate of around 6.5% for this year while targeting a 3% inflation rate.
China released 36k-word white paper showing it’s not backing down on trade war with US
China's State Council release a "White Paper on China-US Economic and Trade Frictions and China's Position" today. This 36000 words paper consists of six sections, detailing the benefits of the bilateral trade, the economic and trade relations, US protectionism and trade hegemonism, the threat of US practice to world economy and China's own position.
In particular, the paper condemns the under the "America First" bandwagon, the new US government "abandoned the basic norms of international exchanges such as mutual respect and equal consultation, and implemented unilateralism, protectionism and economic hegemonism."And the US used different means to "carry out economic intimidation, and impose extreme pressure its own interests impose its own interests on China." The paper also detailed the new protectionist measures of the US. These include measures that discriminate products of other countries, abused national security investigations, subsidies on local industries.
China's own position include defending the "dignity and core interests of the country", "promote healthy trade relationship with the US", "promote and improve multilateral trade system", "protect property and intellectual property rights", "protect rights of foreign businesses in China", "continue deepening reforms on opening the markets", work on win-win relationships with developed and developing countries", etc.
All-in-all, the main message is that China is not going to back down in the trade conflicts. That's what we get. Below are the links to the details as reported by the official Xinhua (in simplified Chinese). Look like they're pretty serious.
- China publishes "White Paper on China-US Economic and Trade Frictions and China's Position"
- The White Paper Explains China's Eight Stands on Sino-US Trade and Economic Friction
- White Paper: Sino-US economic and trade cooperation is a win-win situation rather than a zero-sum game
- White Papers Discriminate the Six Major Facts of Sino-US Economic and Trade Relations
- White Paper: China's attitude towards protecting intellectual property rights is firmly
- White Paper: U.S. Government Trade Protectionism Seriously Affects the Normal Development of Sino-US Economic and Trade Relations
- White paper: Trade protectionism ultimately harms US interests
- White Paper: U.S. Government's Trade Hegemonism has shaken the foundation of the global multilateral trading system
- White Paper: US Government Misconduct Destroys International Economic Order
- White Paper: China firmly protects the legitimate rights and interests of foreign businessmen in China
- White Paper: China Firmly Deepens Reform and Expands Opening
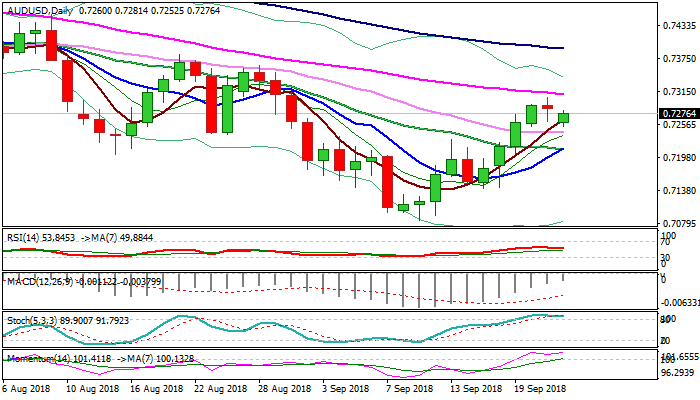
AUDUSD Outlook: Aussie Was Hit By China’s Decision But Dips Were Limited So Far
The Aussie dollar holds in green after gap-lower opening on Monday and hitting new low at 0.7252, but recovery attempts were so far limited, with Asian high at 0.7281 being so far intact.
Announcement that China is pulling out of trade talks with US, weighs on Australian dollar, with additional pressure coming from formation of reversal pattern on daily chart, after Friday's action ended in long-legged Doji.
Sideways-moving 30SMA marks initial support at 0.7241, guarding lower pivot at 0.7214 (converged 10/20SMA), break of which would generate bearish signal.
Falling 55SMA is pivotal barrier (0.7310) and break here is needed to neutralize downside risk and signal continuation of broader uptrend from 0.7085 (11 Sep low).
Res: 0.7281, 0.7310, 0.7330, 0.7362
Sup: 0.7252, 0.7241, 0.7214, 0.7194
Gold Retains Narrow Range In Short-Term, Lacks Direction
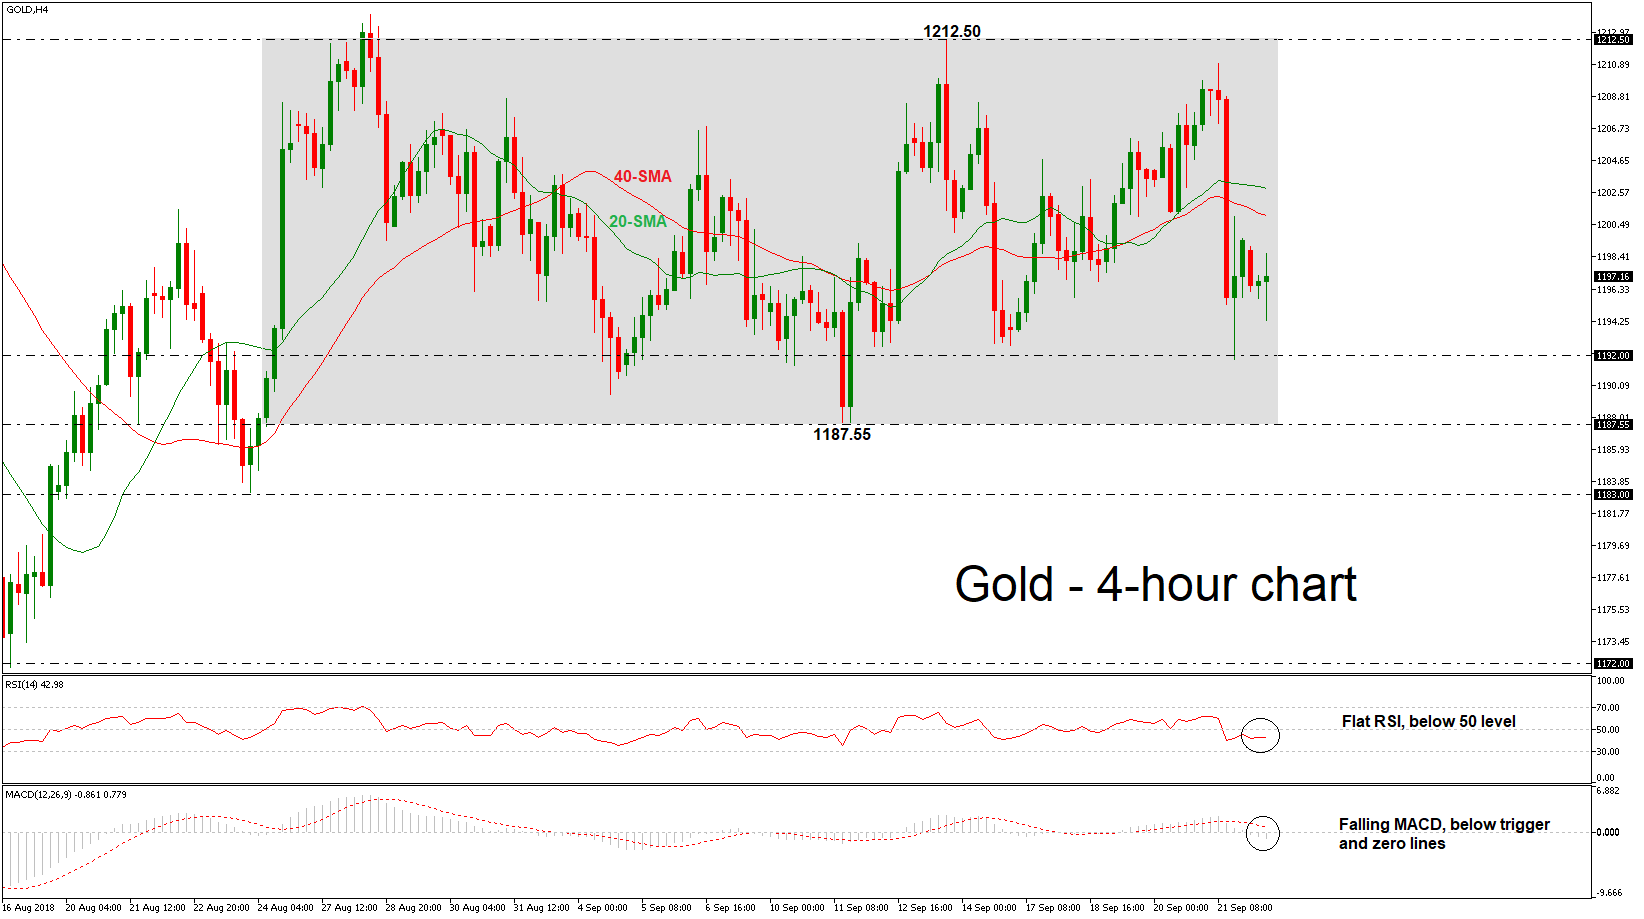
Gold prices have been developing within a narrow range over the last month with upper boundary the 1212.50 resistance level and lower boundary the 1187.55 support barrier. Also, the price still trades below the 20- and 40-period simple moving averages (SMAs) on the 4-hour chart. Notice that the RSI is mostly moving sideways below the 50 level and the MACD remains below both its trigger and zero lines.
If price action jumps above the SMAs, there is scope to test the upper boundary of 1212.50, taken from the high on September 13. Clearing this key level could see additional gains towards the 1217 – 1220 resistance zone, identified by the peaks on August 28.
Alternatively, if the precious metal dips below the 1187.55 key level, then the focus would shift towards the 1183 support hurdle, identified by the low on August 24. If this level is breached too, it would increase downside pressure and may bring about a continuation of the bearish tendency. From there, the metal would be on the path towards the 1172 low.
Despite the neutral short-term bias, in the bigger picture the price has been developing in bearish mode since the pullback on the 1365 resistance barrier.