Sample Category Title
Eco Data 9/24/18
[php_everywhere instance="1"]
Forex Forecast and Cryptocurrencies Forecast
First, a review of last week’s events:
EUR/USD. Recall that most experts (55%) had voted for the further growth of the pair and its transition to the zone 1.1745-1.1845. This forecast turned out to be 100% true, and the pair fixed the weekly high at 1.1802 on Friday morning, having risen by 180 points in five days.
The main reason for the dollar to weaken was the hope that China and the United States could avoid a full-scale trade war. The devastating victory of the Americans became less obvious, and investors turned their attention to more risky assets and started to get rid of the dollar mass.
Another reason for the US currency fall was the delay in the deal between Canada and the US on the North American Free Trade Area (NAFTA). As for the upcoming interest rate raise on September 25-26, the market has already played this scenario long time ago. As a result, the dollar index fell to a two-month low. However, at the very end of Friday, the "buck" managed to win back a part of the losses, and the pair completed the week-long marathon at 1.1750;
GBP/USD. 60% of experts, supported by the overwhelming majority of oscillators, trend indicators, as well as graphical analysis on H4, felt that the pair would continue its growth to the area of 1.3210-1.3315. That was how it all happened: the week high was seen on Thursday at height 1.3296. In addition to the factors listed above, the pound growth was facilitated by positive retail sales statistics in the UK and some progress on the issue of the Irish border at the Brexit talks.
However, the pound's victory over the dollar turned out to be short-lived, and it was on Friday, that, having broken through the support of the two-week rising channel, the pair collapsed by more than 200 points, returning to the mark of the beginning of the week at 1.3075. The reason is still the same: the uncertainty for Brexit;
USD/JPY. While the dollar was weakening against the euro and the pound, it continued to strengthen against the yen. Interest in risk-free assets this week was falling rapidly, and, in addition to the American currency, the Japanese currency was on this list as well. And the yen, having a negative interest rate of -0.1%, topped this rating of UNattractiveness for investors, ahead of the dollar. As a result, the yen lost about 50 points to the dollar, and the pair ended the week at 112.60;
Cryptocurrencies. As expected, the bitcoin stayed in the corridor between $6,000 and $7,000, compensating the drop in the first half of the week with a subsequent rise above $6,700. The end of the five-day week was to please the holders of almost all coins from the TOP-100, which moved into the green zone. But if the growth of the ethereum (ETH/USD) or the litecoin (LTH/USD) turned out to be rather weak, the ripple (XRP/USD) became the real star of the week, jumping up by almost 45%. The factors that contributed to its rise, include the hints of the Ripple management to launch a new product xRapid, the company's exit to the world's largest Asian money transfer market and the launch of its work in Africa.
As for the forecast for the coming week, summarizing the opinions of a number of analysts, as well as forecasts made on the basis of a variety of methods of technical and graphical analysis, we can say the following:
EUR/USD. The coming week will be filled with a variety of events that can affect trends and exchange rates. As for dollar pairs, the most important of such events will be the Fed's decision on the interest rate. It goes without saying that the market has already prepared for its increase, but the volatility growth on Wednesday September 26 is still guaranteed. But if the rate remains unchanged by any chance, it will produce an explosion effect, and the dollar will collapse at a cosmic speed.
The final decision of the US Federal Reserve is still unknown. At the time of writing this forecast, the situation looks like this:
- 90% of the indicators, graphical analysis on H4 and D1, as well as 55% of experts vote for the growth of the pair. The nearest target is 1.1850, the next one is 100 points higher.
- 45% of analysts have given their votes for the strengthening of the dollar as well as 10% of oscillators that signal the pair is overbought. Supports are 1.1620 and 1.1530. The ultimate goal in the medium term is at the low of August at the level of 1.1300;
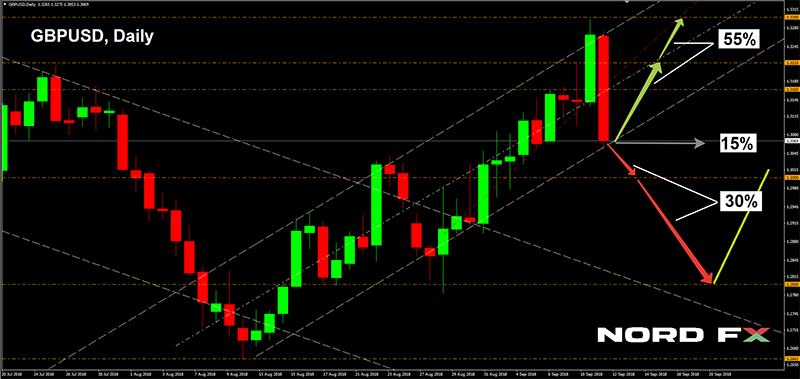
GBP/USD. 55% of experts also vote for the growth of this pair, 30% are for its fall, and the remaining 15% have taken a neutral position. After a sharp fall on Friday September 21, the indications of trend indicators were divided almost in half, and 20% of the oscillators signal the pair is oversold.
As for the graphical analysis, it shows a possible fall of the pair to the level of 1.3000 on H4, and as for D1, the target of the week is the level of 1.2800, after which a rebound to 1.3020 may follow.
Resistance is at the levels of 1.3165, 1.3215 and 1.3300;
USD/JPY. Theoretically, the formation of trends could be influenced by the Bank of Japan management meeting on Tuesday, September 25, but it is hardly worth waiting for any radical decisions from it.
Most analysts (60%) believe that the yen has already made too many concessions to the dollar, and now one should expect the correction of the pair down. Graphical analysis on H4 agrees with this as well as 10% of oscillators on D1, giving signals that the pair is overbought. Supports are at the levels of 111.70, 111.25 and 110.75.
An alternative scenario, the growth of the pair to the height of 113.20, is supported by 40% of experts, graphical analysis on D1 and 100% of trend indicators on H4 and D1. The following targets are 113.75 and 114.75;
Cryptocurrencies. The crypto market desperately needs some positive news that can move it up. This can be the appearance of major institutional investors capable of pouring into it billions of dollars. However, some experts fear that such "whales" will very quickly supersede the small "fish" from the market, making the entire idea of decentralized finance doubtful. They name the launch of bitcoin futures last December, which laid the foundation for a massive collapse in the digital currencies rates, as an argument.
But the fears do not end there. For example, a meeting of Mt.Gox creditors is planned for September 26, where a chance to compensate the losses of former customers of this exchange by selling off reserves of 170 thousand BTC coins will be discussed. Nobody knows what can happen in this case. But it is enough to remember that in February-March this year, the bitcoin lost about 20% of the cost on the news of a similar sale. And if on September 30 the US regulator (SEC) rejects the application for the ETF launch, the rate of the model crypto currency may just as well collapse significantly below $5,000. The positive SEC decision (and even just a hint on it) could raise the pair BTC/USD above the $7,000-7,500 zone.
EUR/USD Weekly Outlook
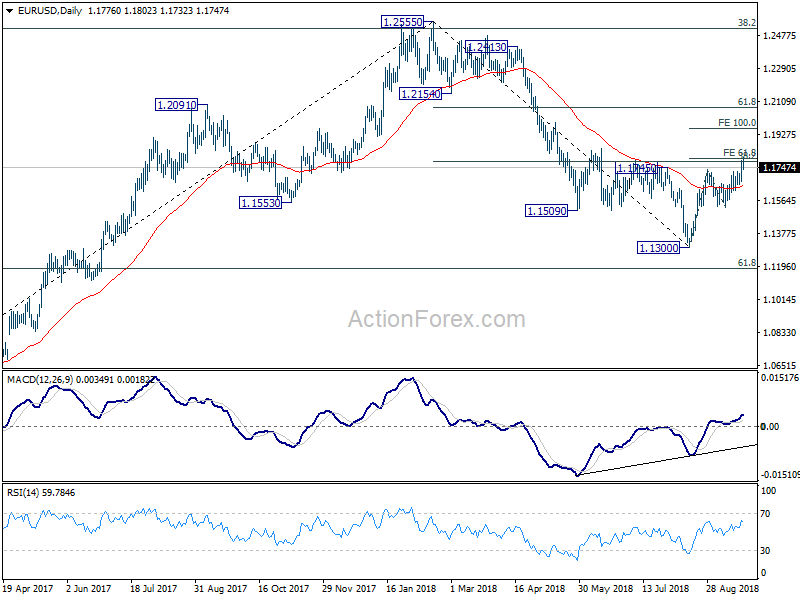
EUR/USD surged to as high as 1.1802 last week but failed to sustain above 38.2% retracement of 1.2555 to 1.1300 at 1.1779 and retreated. Initial bias is neutral this week first. At this point, we maintain our view that 1.1779 should limit upside, at least on first attempt, to bring near term reversal. On the downside, break of 1.1649 minor support will be the first signal that corrective rise from 1.1300 has completed. Intraday bias will be turned to the downside for 1.1525 support first. Break will confirm and bring retest of 1.1300 low. However, sustained break of 1.1779 will extend the corrective rise from 1.1300 to 100% projection of 1.1300 to 1.1733 from 1.1525 at 1.1958 before completion.
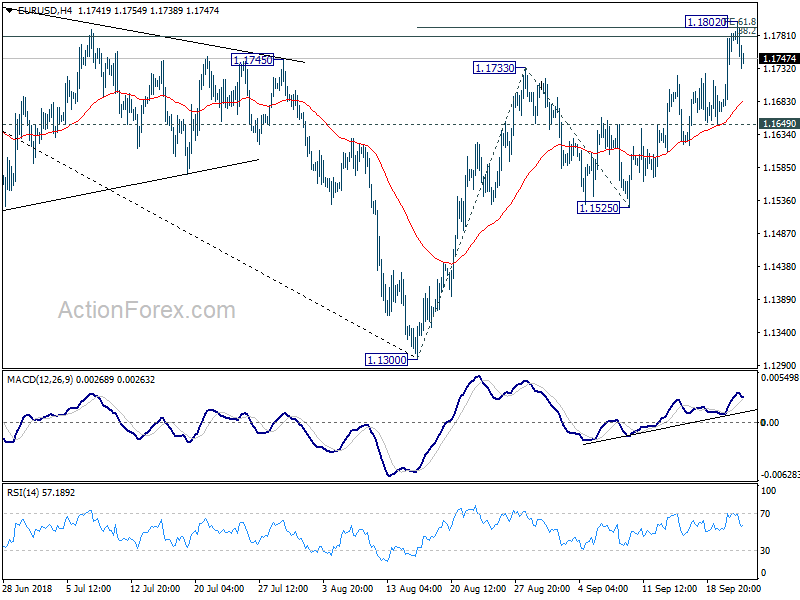
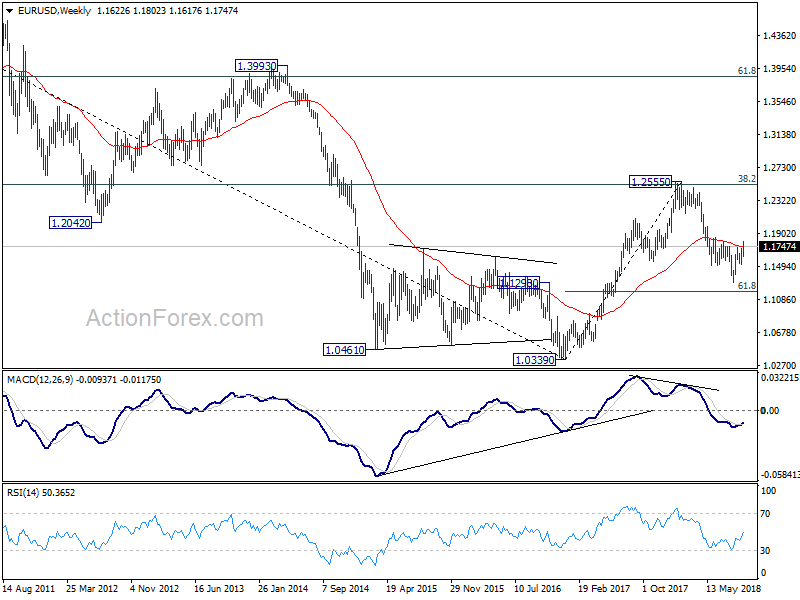
In the bigger picture, a medium term bottom should be in place at 1.1300, on bullish convergence condition in daily MACD and some consolidations would be seen. But still, note that EUR/USD was rejected by 38.2% retracement of 1.6039 (2008 high) to 1.0339 (2017 low) at 1.2516. That carries some long term bearish implications. Thus, we'd expect fall from 1.2555 high to resume after consolidation completes. Below 1.1300 should send EUR/USD through 61.8% retracement of 1.0339 to 1.2555 at 1.1186. And, in that case, EUR/USD would head to retest 1.0339 (2017 low).
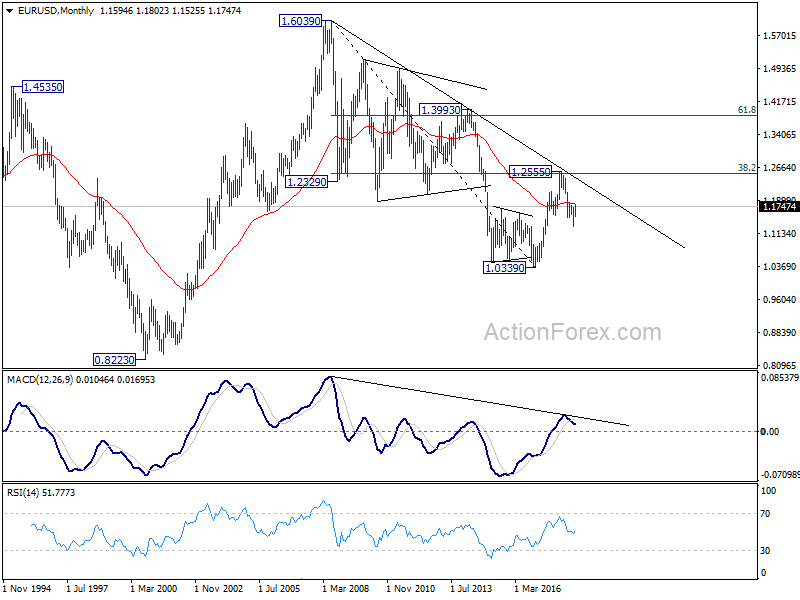
In the long term picture, the rejection from 38.2% retracement of 1.6039 to 1.0339 at 1.2516 argues that long term down trend from 1.6039 (2008 high) might not be over yet. EUR/USD is also held below decade long trend line resistance. Firm break of 61.8% retracement of 1.0339 to 1.2555 at 1.1186 should at least bring a retest on 1.0339 low.
USD/JPY Weekly Outlook
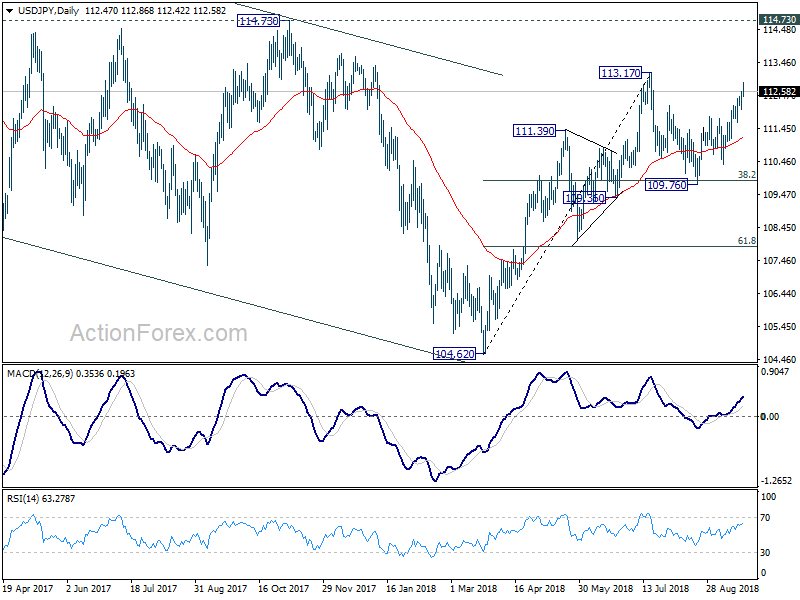
USD/JPY rose to as high as 112.89 last week as the rebound from 109.76 extended. Initial bias stays on the upside this week for 113.17 resistance first. Decisive break there will resume whole rally from 104.62 and target 114.73 resistance next. On the downside, below 112.38 minor support will turn intraday bias neutral first. But near term outlook will now stay cautiously bullish as long as 111.82 resistance turned support holds.
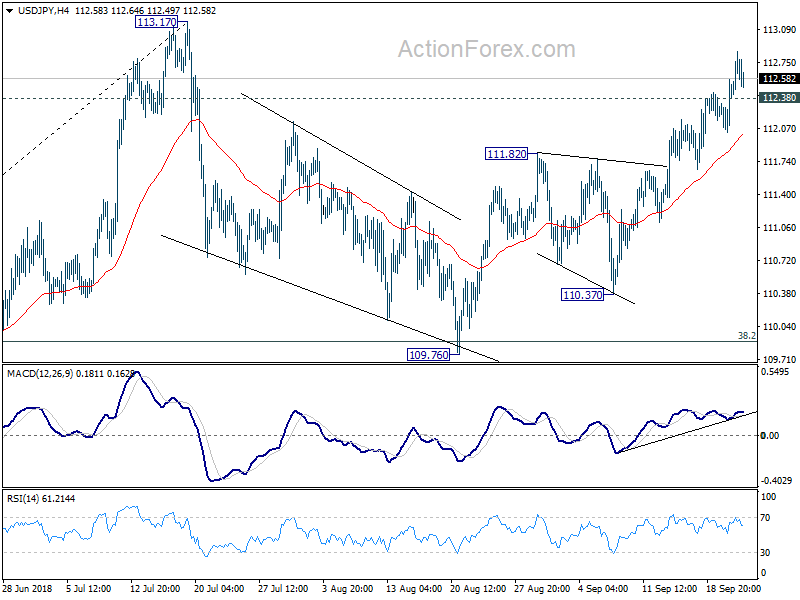
In the bigger picture, corrective fall from 118.65 (2016 high) should have completed with three waves down to 104.62. Decisive break of 114.73 resistance will likely resume whole rally from 98.97 (2016 low) to 100% projection of 98.97 to 118.65 from 104.62 at 124.30, which is reasonably close to 125.85 (2015 high). This will stay as the preferred case as long as 109.36 support holds. However, decisive break of 109.36 will mix up the outlook again. And deeper fall should be seen back to 61.8% retracement of 104.62 to 113.17 at 107.88 and below.
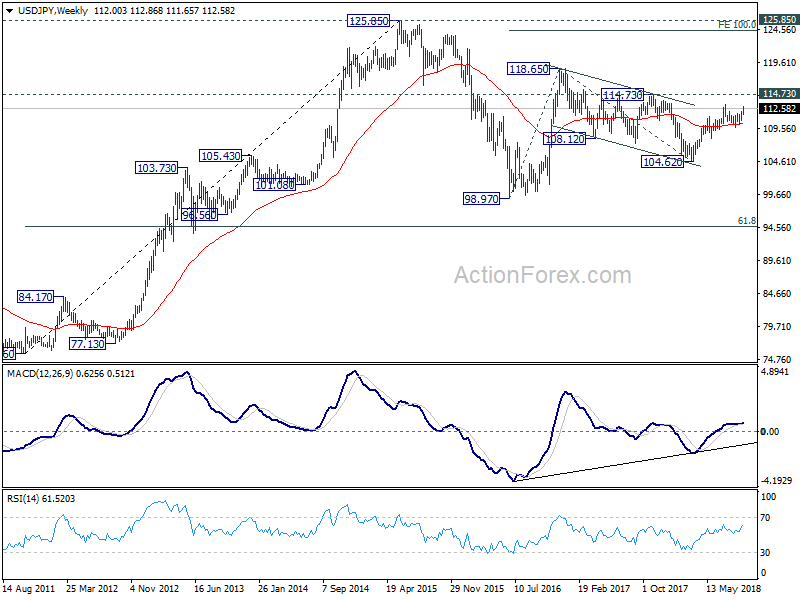
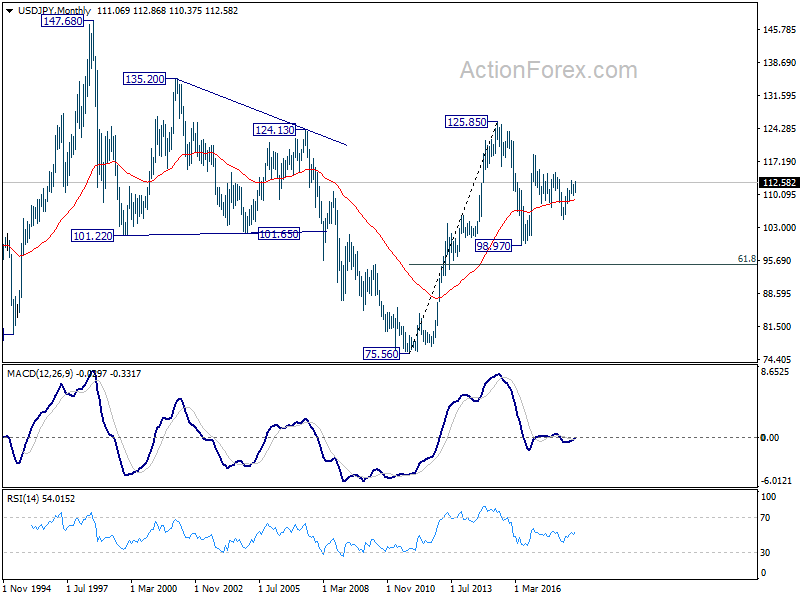
In the long term picture, the rise from 75.56 (2011 low) long term bottom to 125.85 top is viewed as an impulsive move, no change in this view. Price actions from 125.85 are seen as a corrective move which could still extend. In case of deeper fall, downside should be contained by 61.8% retracement of 75.56 to 125.85 at 94.77. Up trend from 75.56 is expected to resume at a later stage for above 135.20/147.68 resistance zone.
GBP/USD Weekly Outlook
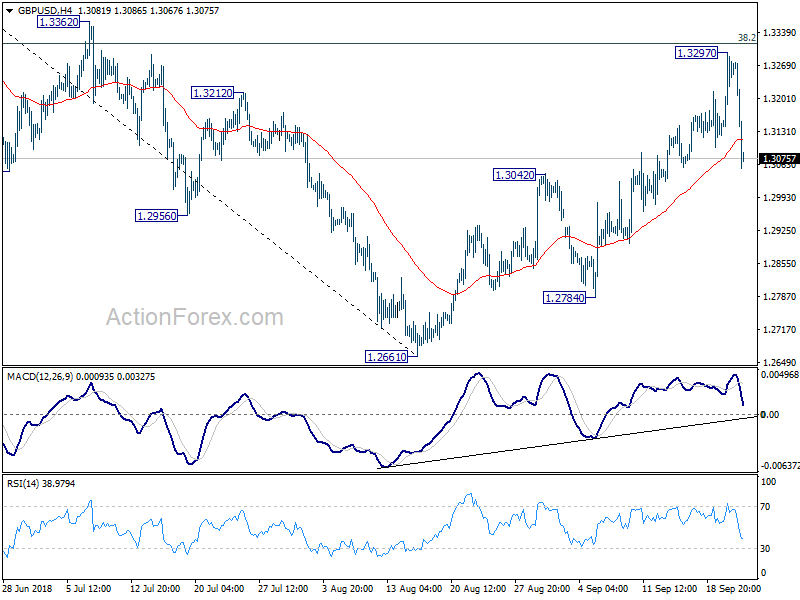
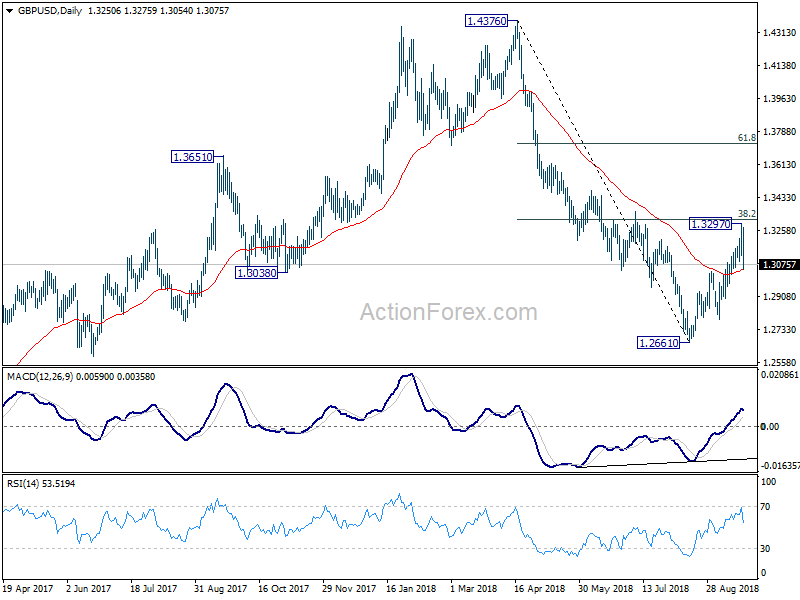
GBP/USD's corrective rise from 1.2661 extended to 1.3297 last week but faced strong resistance from 1.3316 key fibonacci level and reversed. Initial bias stays on the downside for 1.3042 resistance turned support first. Break will target 1.2784 support next. On the upside, break of 1.3297 is now needed to confirm rise resumption. Otherwise, risk will stay on the downside even in case of recovery.
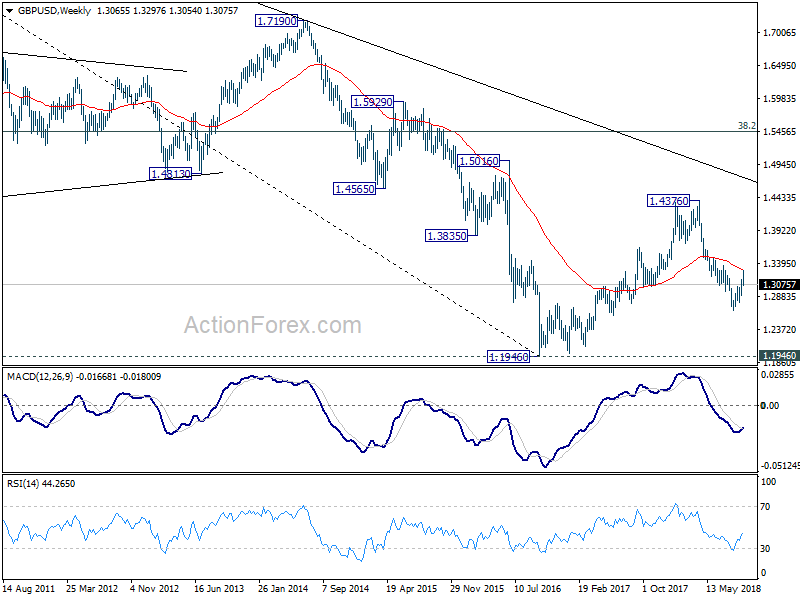
In the bigger picture, whole medium term rebound from 1.1946 (2016 low) should have completed at 1.4376 already, after rejection from 55 month EMA (now at 1.4062). The structure and momentum of the fall from 1.4376 argues that it's resuming long term down trend. And this will be the preferred case as long as 38.2% retracement of 1.4376 to 1.2661 at 1.3316 holds. However, firm break of 1.3316 would bring stronger rebound to 61.8% retracement at 1.3721. And, the eventual depth of the fall from 1.4376, and the chance of hitting 1.1946 low, will depend on the strength of the interim corrective rebound from 1.2661.
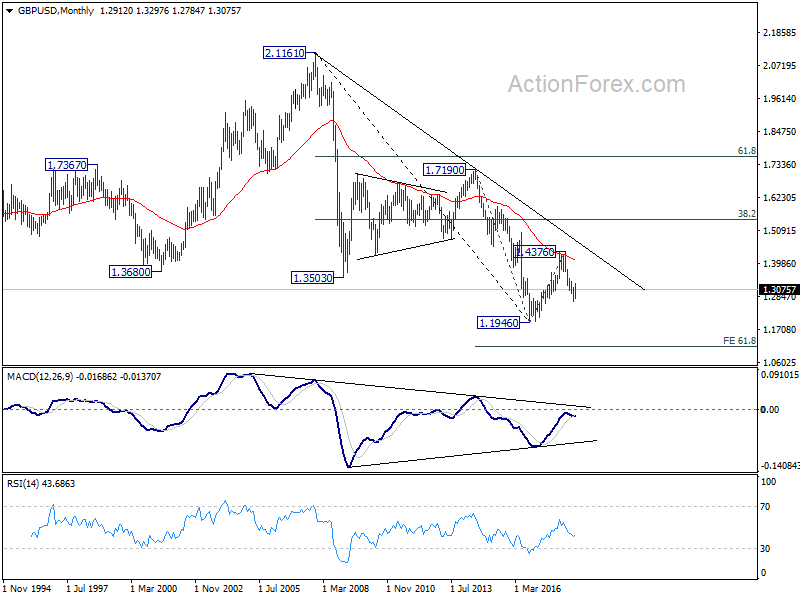
In the longer term picture, outlook in GBP/USD is held bearish. Rebound from 1.1946 was rejected solidly by falling 55 month EMA. The pair was limited well below 38.2% retracement of 2.1161 (2007 high) to 1.1946, as well as the decade long falling trend line. On break of 1.1946, next target will be 61.8% projection of 1.7190 to 1.1946 from 1.4376 at 1.1135.
USD/CHF Weekly Outlook
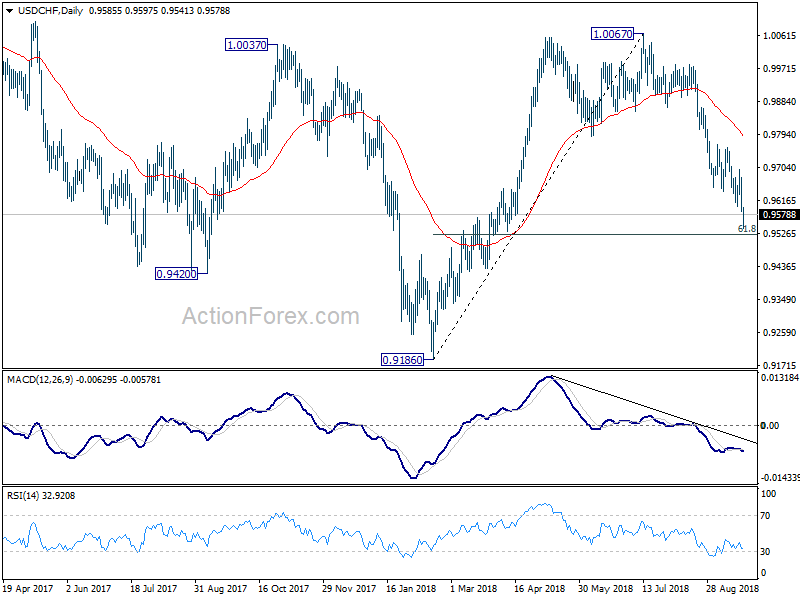
USD/CHF's decline from 1.0067 continued last week and hit as low as 0.9541. Initial bias stays on the downside this week for 0.9523 fibonacci level next. We'd look for bottoming sign there to bring rebound. On the upside, break of 0.651 support turned resistance will indicate short term bottoming and target 0.9757 resistance. However, sustained break of 0.9523 would pave the way to retest 0.9186 low.
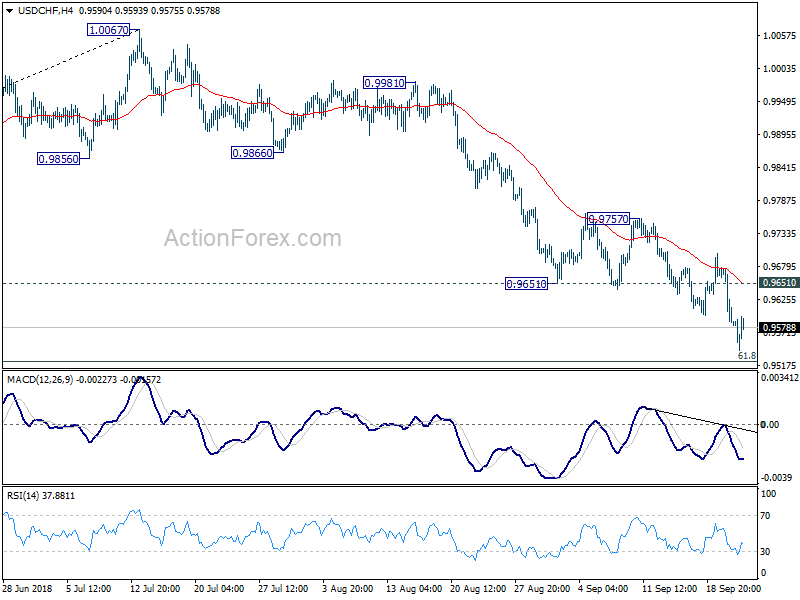
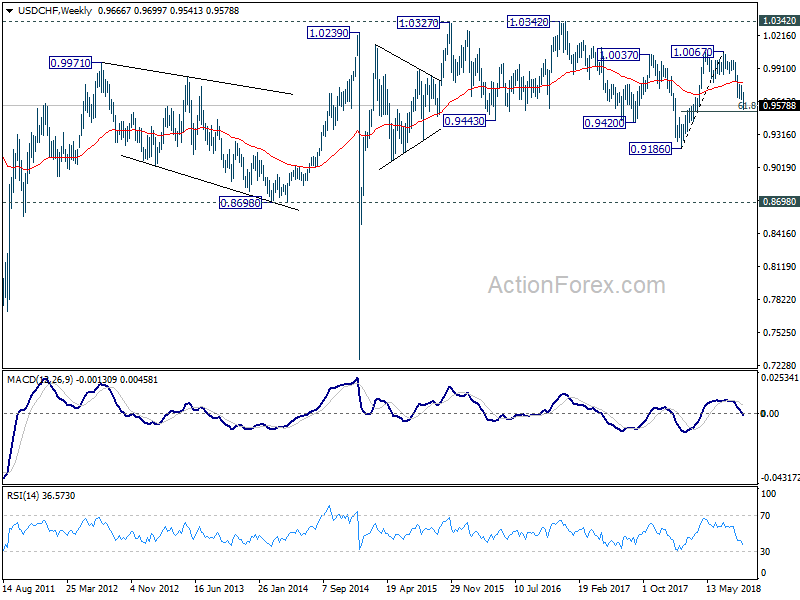
In the bigger picture, rise from 0.9186 low has completed at 1.0067, after failing to sustain above 1.0037 resistance. Fall from 1.0067 could extend to 61.8% retracement of 0.9816 to 1.0067 at 0.9523 and below. But for now, we don't expect a break of 0.9186 low. On the upside, firm break of 0.9866 support turned resistance will suggests that fall from 1.0067 has completed and rise from 0.9186 is resuming.
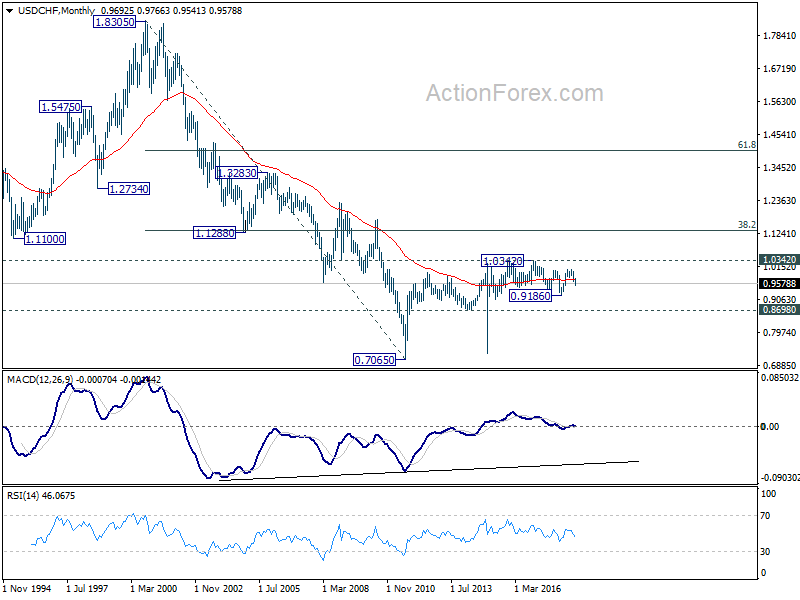
In the long term picture, price actions from 0.7065 (2011 low) are not clearly impulsive yet. Thus, we'll treat it as developing into a corrective pattern, at least, until a firm break of 1.0342 resistance.
AUD/USD Weekly Outlook
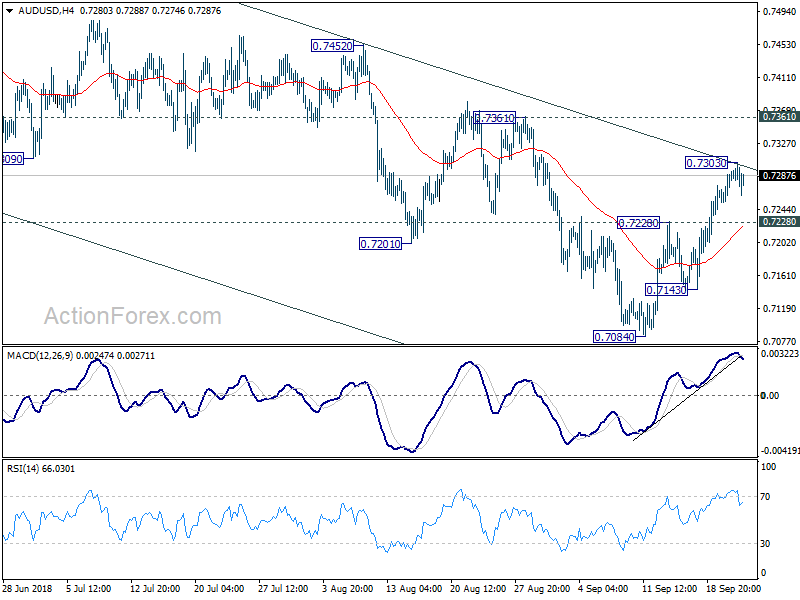
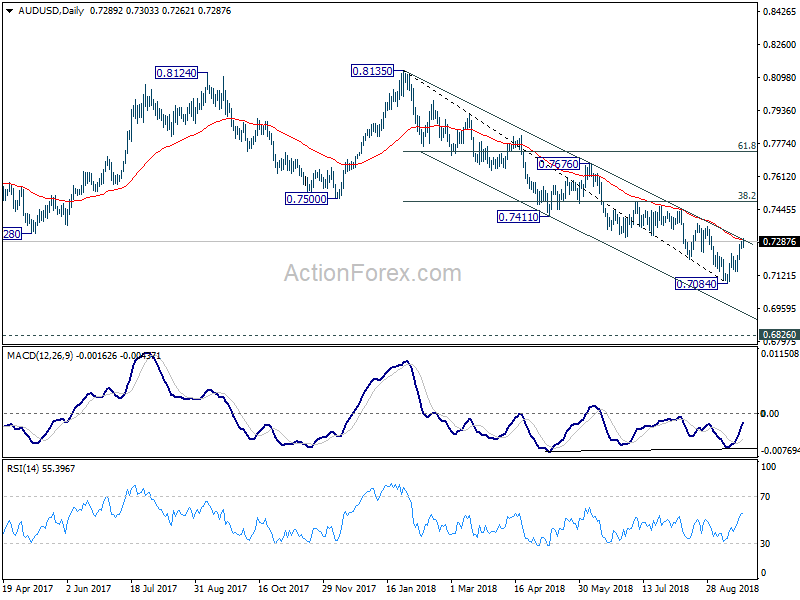
AUD/USD's corrective rebound from 0.7804 extended to 0.7303 last week but formed a temporary top there. Initial bias is neutral this week first. While further rise cannot be ruled out, upside should be limited well below 0.7361 resistance to complete the correction and bring down trend resumption. On the downside, below 0.7228 resistance turned support will turn bias back to the downside for 0.7143 first. Break there will likely resume larger fall from 0.8135 through 0.7084 low. However, sustained break of 0.7361 will carry larger bullish implication.
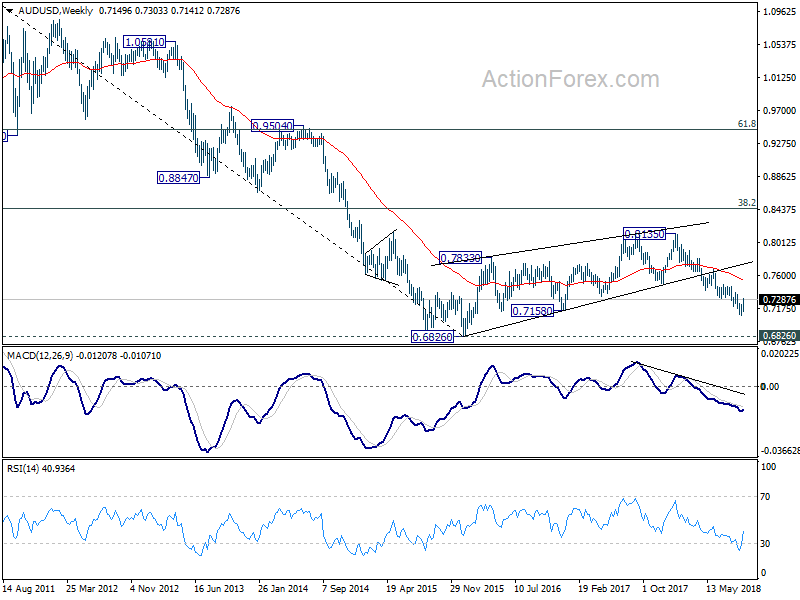
In the bigger picture, rebound from 0.6826 (2016 low) is seen as a corrective move that should be completed at 0.8135. Fall from there would extend to have a test on 0.6826. There is prospect of resuming long term down trend from 1.1079 (2011 high). Current downside momentum as seen in weekly MACD support this bearish case. Firm break of 0.6826 will target 0.6008 key support next (2008 low). On the upside, break of 0.7361 resistance, however, argues that a medium term bottom is possibly in place, and stronger rebound could follow. We'll assess the medium term outlook later if this happens.
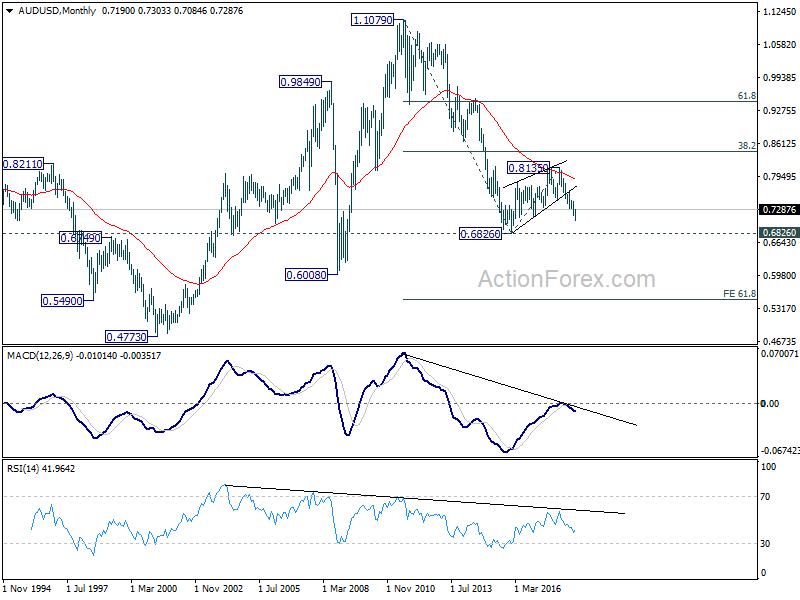
In the longer term picture, the corrective structure of rebound from 0.6826 (2016 low) to 0.8135, and the failure to break 38.2% retracement of 1.1079 (2011 high) to 0.6826 at 0.8451, carry bearish implications. AUD/USD was also rejected by 55 month EMA. Now, the down trend from 1.1079 is in favor to extend. On break of 0.6826, next target will be 61.8% projection of 1.1079 to 0.6826 from 0.8135 at 0.5507.
USD/CAD Weekly Outlook
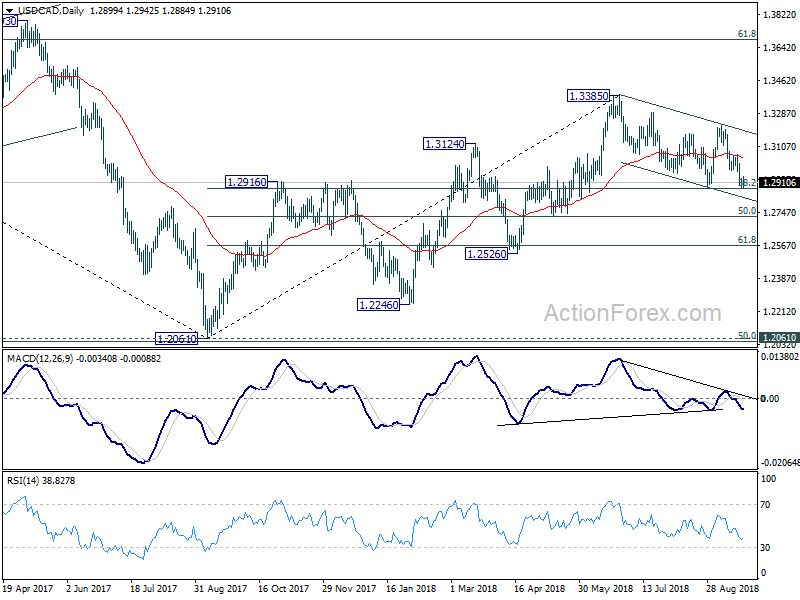
USD/CAD dropped further to 1.2883 last week but formed a temporary low there and recovered. Initial bias is neutral this week first. While the decline was deeper than we expected, it;'s held by 38.2% retracement of 1.2061 to 1.3385 at 1.2879. So, we'll hold on to the view that larger rise from 1.2061 is still in progress. On the upside, above 1.2975 support turned resistance will turn bias back to the upside for 1.3063 first. Break will target 1.3225 key near term resistance. However, sustained break of 1.2879 will dampen our view and target 50% retracement at 1.2723 next.
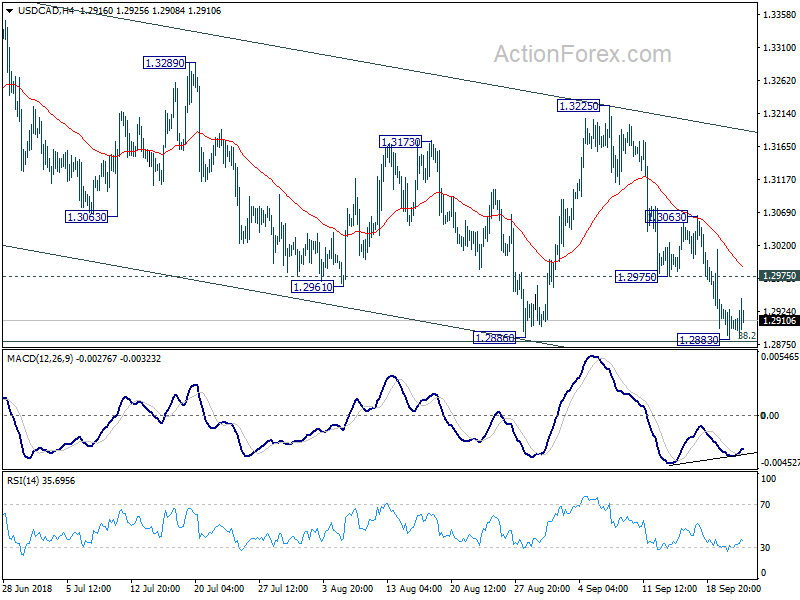
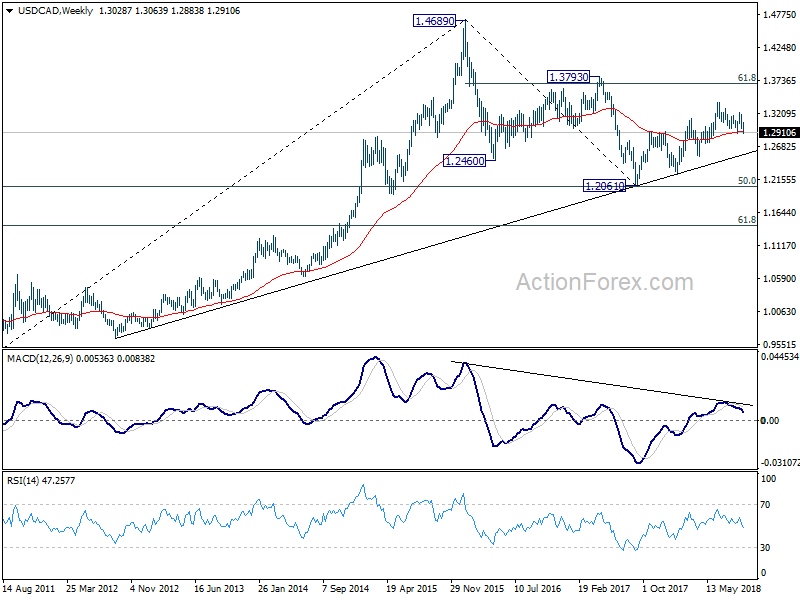
In the bigger picture, focus is back on 38.2% retracement of 1.2061 to 1.3385 at 1.2879 key fibonacci level. As long as it holds, rise from 2017 low at 1.2061 is still in progress. Break of 1.3384 should target 61.8% retracement of 1.4689 (2015 high) to 1.2061 (2017 low) at 1.3685. However, sustained break of 1.2879 will dampen his bullish view and turn focus back to 61.8% retracement at 1.2567, which is close to 1.2526 support.
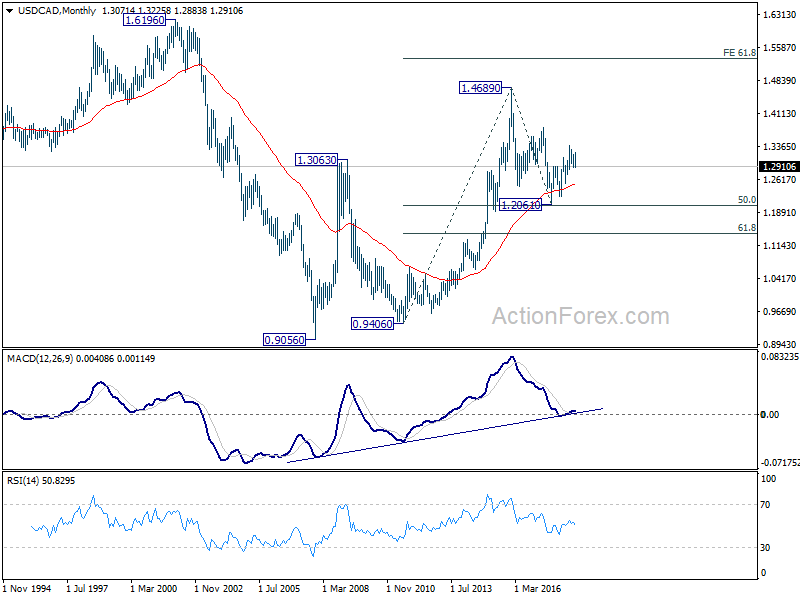
In the longer term picture, corrective fall from 1.4689 (2015 high) should have completed with three waves down to 1.2061, just ahead of 50% retracement of 0.9406 (2011 low) to 1.4689 (2015 high) at 1.2048. The development keeps long term up trend from 0.9406 and that from 0.9056 (2007 low) intact. For now, there is prospect of extending the long term up trend to 61.8% projection of 0.9406 to 1.4689 from 1.2061 at 1.5326 in medium to long term.
GBP/JPY Weekly Outlook
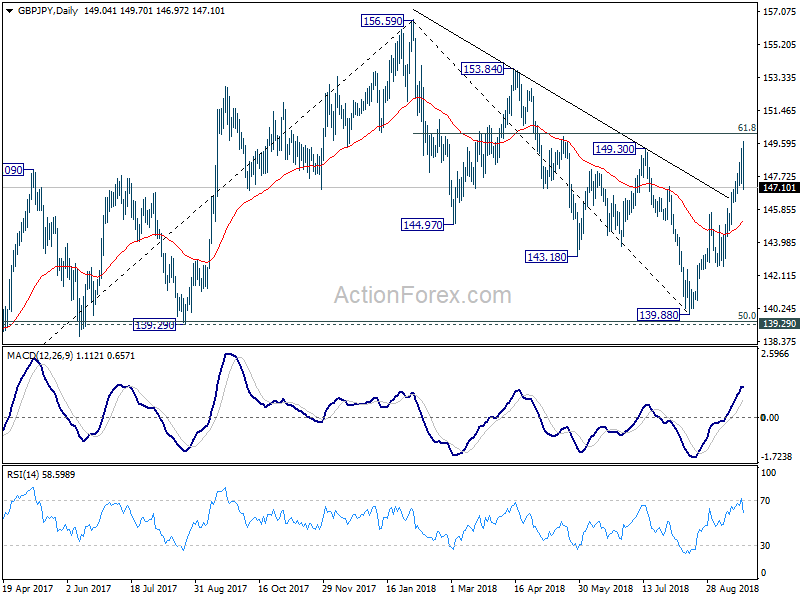
GBP/JPY surged further to as high as 149.70 last week but retreated sharply from there. Initial bias stays neutral this week first. For now, further rise is still expected as long as 145.67 resistance turned support holds. Break of 149.70 will target 153.84/156.69 resistance zone. However, break of 145.67 will suggests that the rebound from 139.88 has completed and turn near term outlook bearish again.
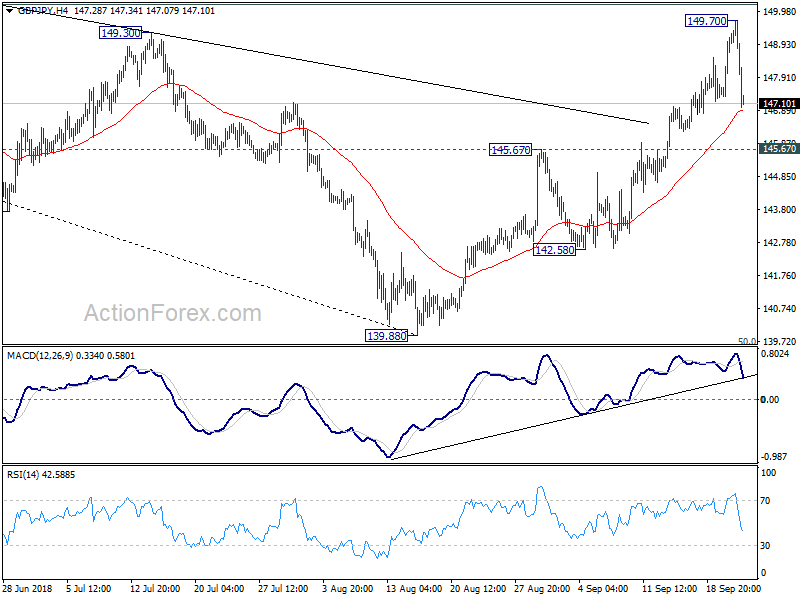
In the bigger picture, current development suggests that GBP/JPY has successfully defended 139.29 cluster support (50% retracement of 122.36 to 156.59 at 139.47). And, the rally from 122.36 (2016 low) is still intact. Such medium to long term rise would extend through 156.96 high. This will now be the preferred case as long as 145.67 near term support holds. However, break of 145.67 will turn focus back to 139.29/47 key support zone.
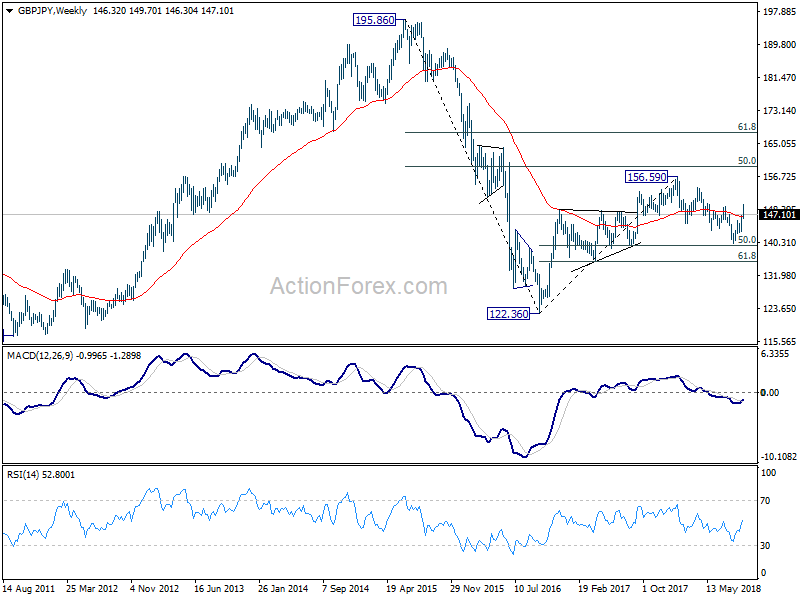
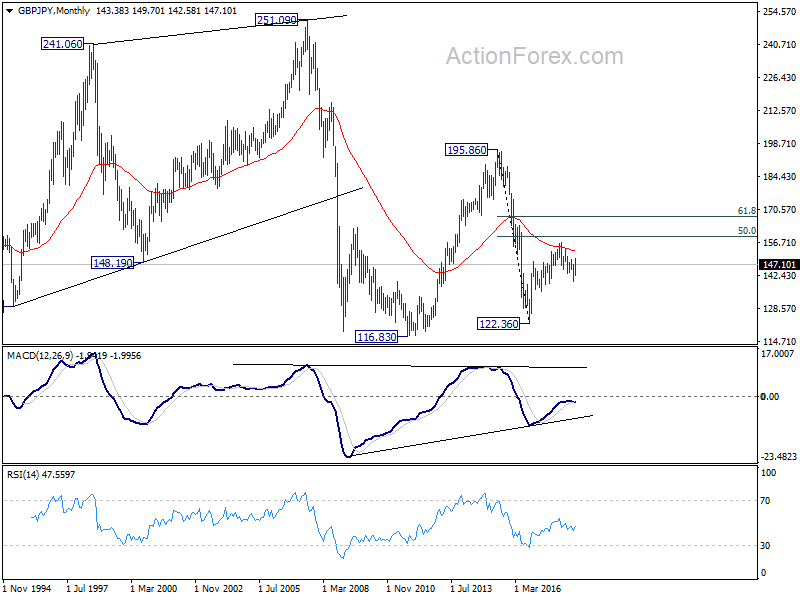
In the longer term picture, the failure to sustain above 55 month EMA (now at 152.74) is mixing up the outlook. Nonetheless, as long as 139.29 holds, rise from 122.36 is in favor to extend to 50% retracement of 195.86 (2015 high) to 122.36 (2016 low) at 159.11, and possibly further to 61.8% retracement at 167.78 before completion. However, firm break of 139.29 will turn focus back to 116.83/122.36 support zone instead.
EUR/JPY Weekly Outlook
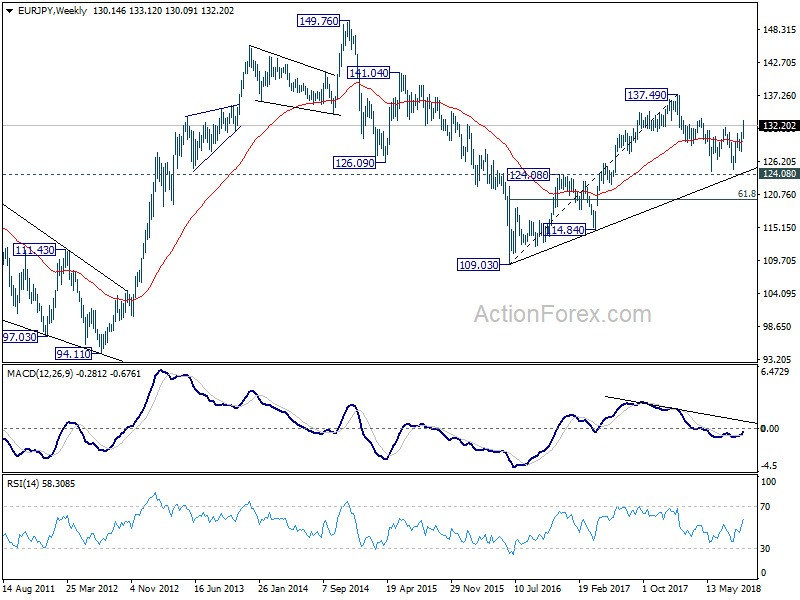
EUR/JPY surged to as high as 133.12 last week before forming a temporary top there and retreated. Initial bias is neutral this week first. Current development suggests that whole corrective fall from 137.49 has completed, ahead of 124.08 key support. Further rise is expected as long as 130.86 resistance turned support holds. On the upside, above 133.12 will target 100% projection of 124.89 to 130.86 from 127.85 at 133.82 first. Break will target 137.49 high. However, firm break of 130.86 will dampen this bullish view and turn focus back to 127.85 support.
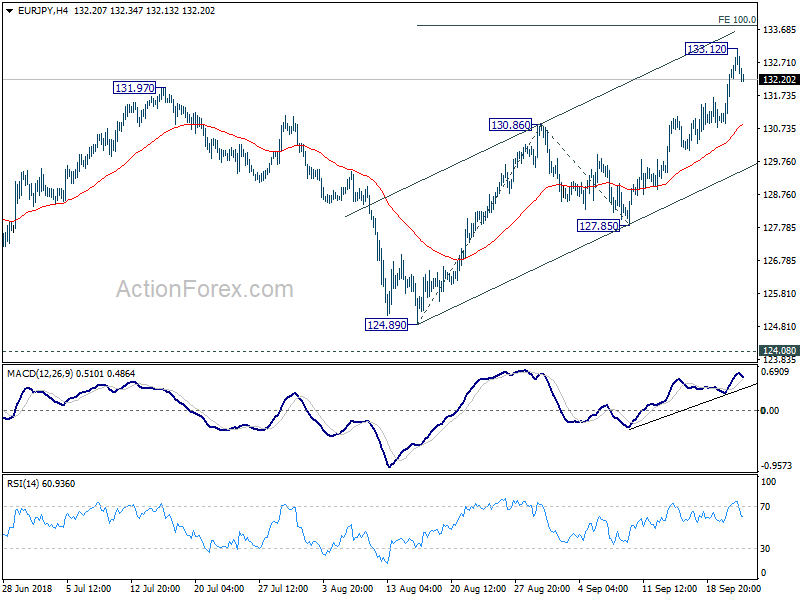
In the bigger picture, current development suggests that EUR/JPY has defended key support level of 124.08 key resistance turned support. And, the larger up trend from 109.03 (2016 low) is still in progress. Firm break of 137.49 will target 141.04/149.76 resistance zone next. This will now be the preferred case as long as 127.85 near term support holds.
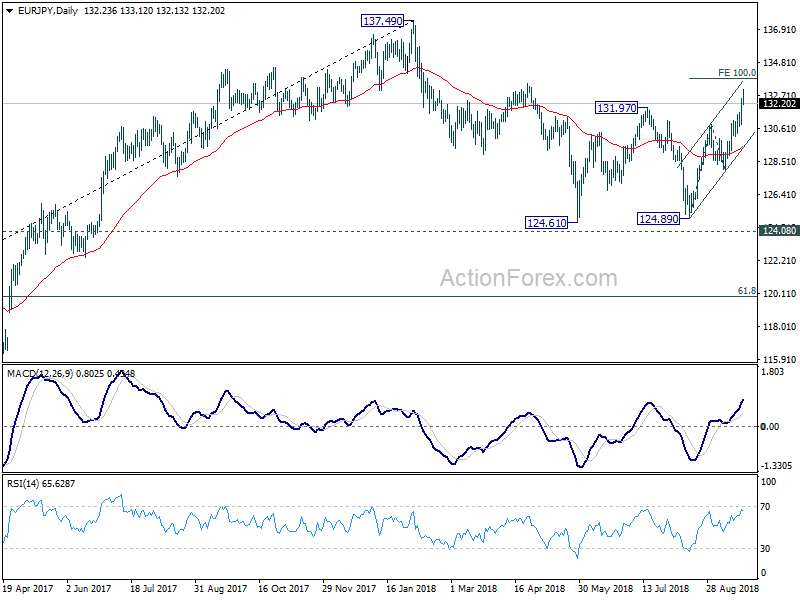
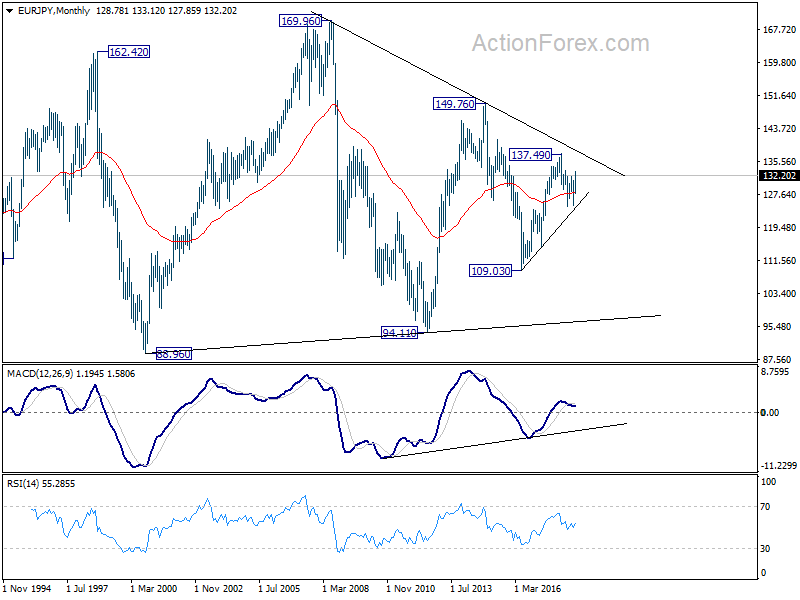
In the long term picture, at this point, EUR/JPY is staying in long term sideway pattern, established since 2000. Rise from 109.03 is seen as a leg inside the pattern. As long as 124.08 support holds, further rally is in favor in medium to long term through 149.76 high. However, break of 124.08 could extend the fall through 109.03 low instead.