

Sample Category Title
EUR/CHF Weekly Outlook
EUR/CHF stayed in range of 1.1178/1342 last week and outlook is unchanged. Initial bias remains neutral this week first. In case of another fall, we'd continue to expect strong support from key support zone of 1.1154/98 to bring reversal. On the upside, break of 1.1342 will reaffirm the case of bullish reversal and target 1.1452 resistance for confirmation. However, sustained break of 1.1154/98 will carry larger bearish implications.
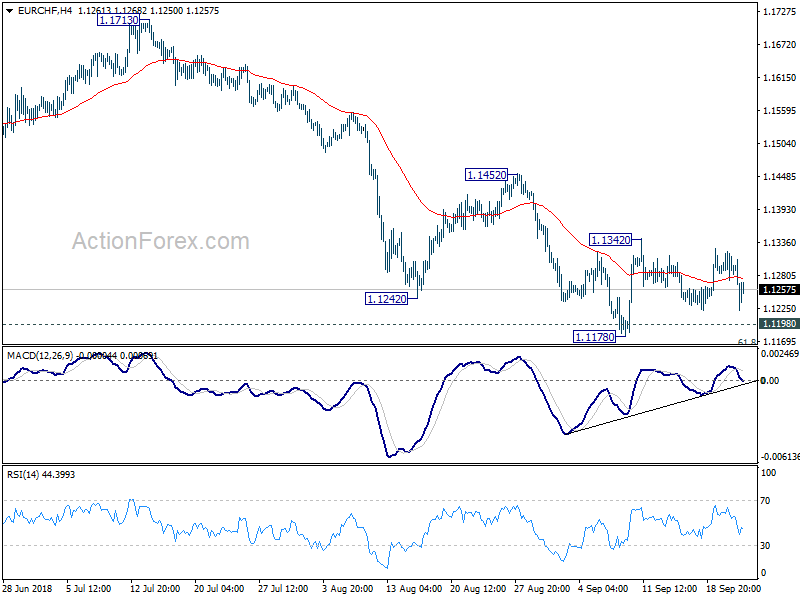
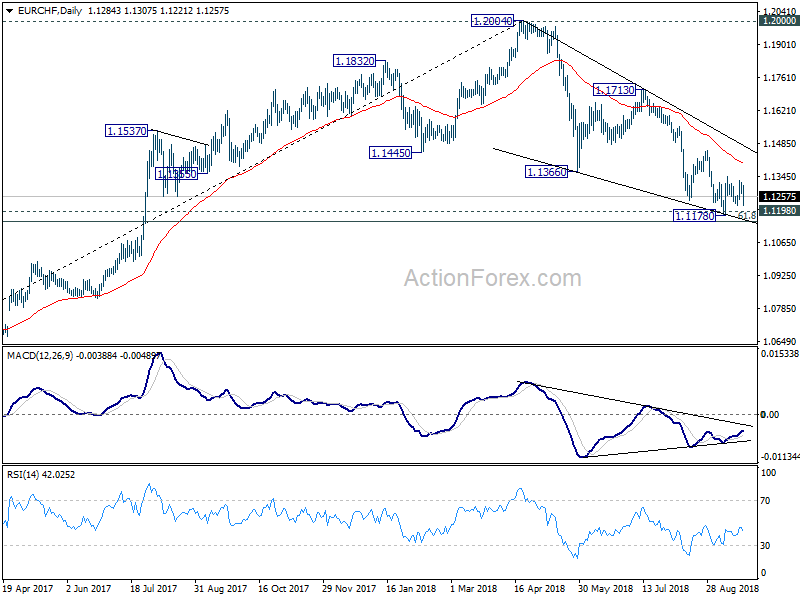
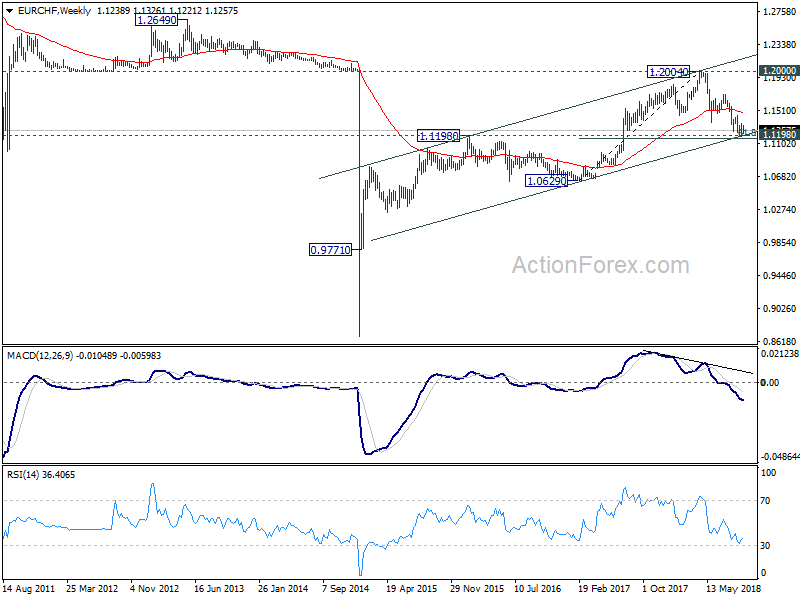
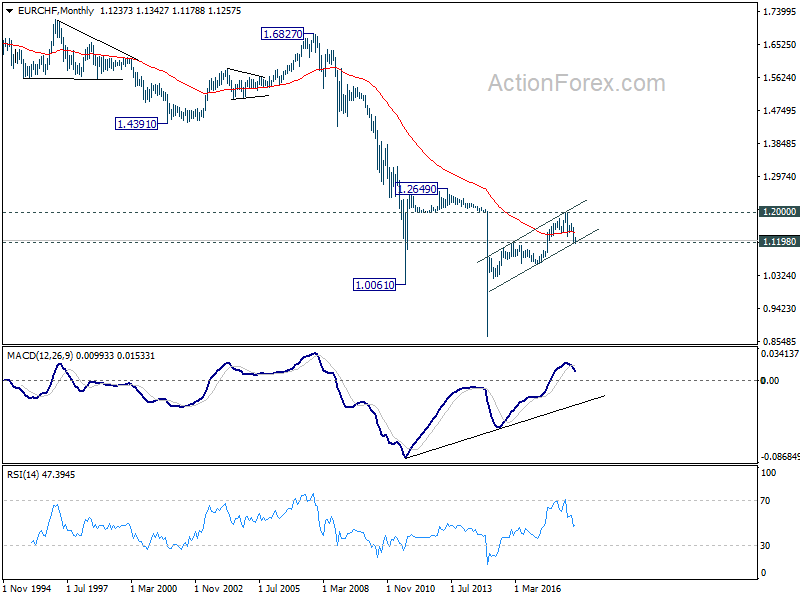
In the bigger picture, for now, the price actions from 1.2004 medium term top is seen as a correction only. Downside should be contained by support zone of 1.1198 (2016 high) and 61.8% retracement of 1.0629 to 1.2004 at 1.1154 to complete it and bring rebound. This cluster level is in proximity to long term channel support (now at 1.1207) too. A break of 1.2 key resistance is still expected in the medium term long term. However, sustained break of the mentioned support zone will mark reversal of the long term trend. In that case, 1.0629 key support will be back into focus.
Dollar and US Yields at Critical Levels, Fate on Fed’s Hands
Yen ended last week as the weakest one as the global markets were in full risk on mode. DOW finally made a new record high, together with S&P 500 and the strength is not limited to the US. Nikkei closed up 3.36% and is now very close to 24129.34 (2018 high). Even the China Shanghai SSE closed up 4.32%, just missing 2800 handle. It's the same in Europe with DAX gained 2.53% and CAC added 2.64%. Treasury yields across the Atlantic also soared with US 10-year yield reclaimed 3% handle. German 10 year bund yields also breached 0.5% but failed to stand firm above.
The escalation of US-China trade war was largely ignored by the markets. Dollar ended as the second weakest one. New Zealand Dollar and Australia Dollar, two currencies most sensitive to US-China trade tensions, were the best preforming ones. Meanwhile, Sterling was the third weakest as Brexit negotiation is now at an impasse after the informal EU summit in Austria.
US-China trade war just took a mickey mouse step
Looking back, the reactions to new round of US-China tariffs showed that investors were actually relieved. USTR announced 10% tariffs on USD 200B in Chinese imports, effective September 24. Tariff ate will be raised to 25% on January 1, 2019. China swiftly announced retaliation on USD 60B imports, tariff rates at 5% and 10%.
It's certainly not the worst case scenario, and far from. So what should be the worst? Imagine Trump kept the original rate of 25% tariffs, effective September 24 too. At the same time, he started the process on tariffs on USD 267B of Chinese goods immediately, and assume that the rate is also 25%. Then we could have 25% tariffs on nearly all Chinese imports by year end, with equivalent countermeasures by China. Comparing to this worst case scenario, the move announced last week was just a mickey mouse step.
Dollar and treasury yield at critical levels, FOMC to decide their fate
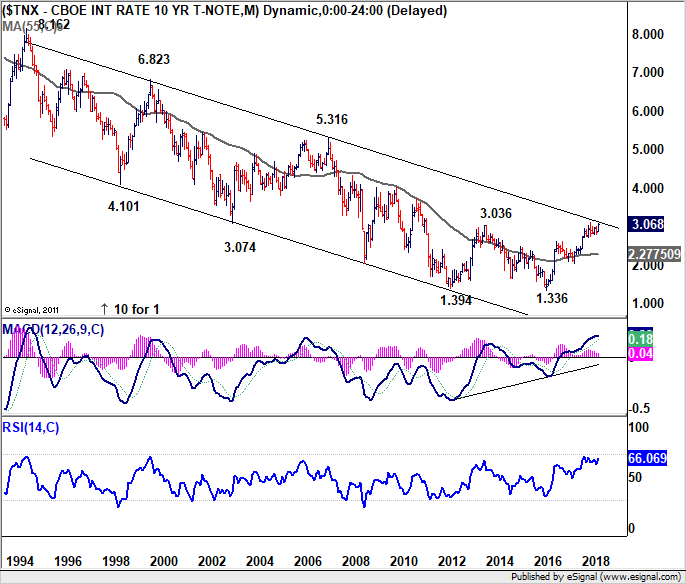
Anyway, the overall developments now put Dollar and yields at very critical levels. Both 10- and 30-year yields are now pressing key long term resistance. At the same time, Dollar is trying to draw support from key level against Euro. Technically, our base case is for Dollar to have a strong rebound and bullish reversal from the current level. Meanwhile, treasury yields would finally take out the multi decade trend defining resistances. But we can be wrong.
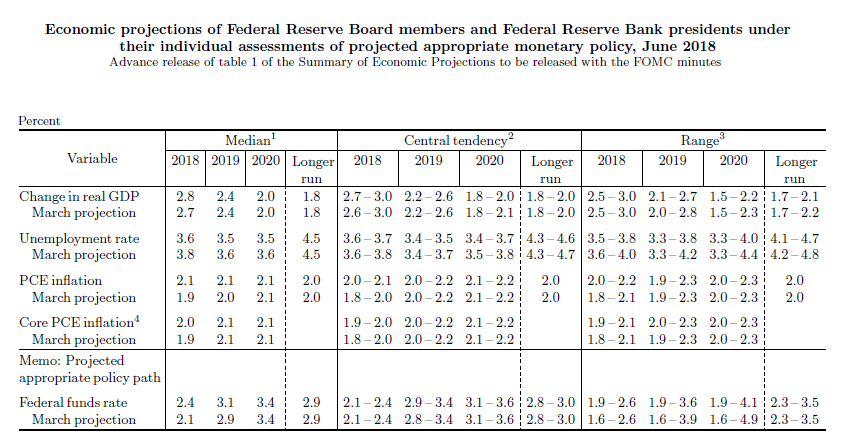
The eventual outcome will very much depend on FOMC meeting this week. There is no doubt that Fed will raise federal funds rate by 25bps to 2.00-2.25%. Voting could be a point of interest as some doves have voiced concerns over flattening yield curve. But more importantly, the new economic projections could be most market moving. In particular, Fed's projections on the longer run federal funds rate. It's estimated to be at 2.9% in June projections. And it's the point where policymakers could see interest rate of being restrictive going beyond. This provides the anchor for assessing how far the current rate hike cycle would go. Any uplift in this figure would send Dollar and yields soaring.
US yield surged sharply, more strength at the long end
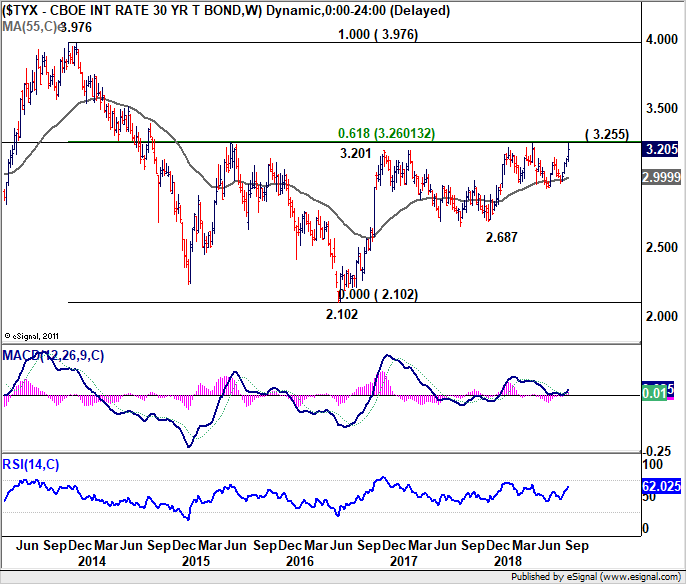
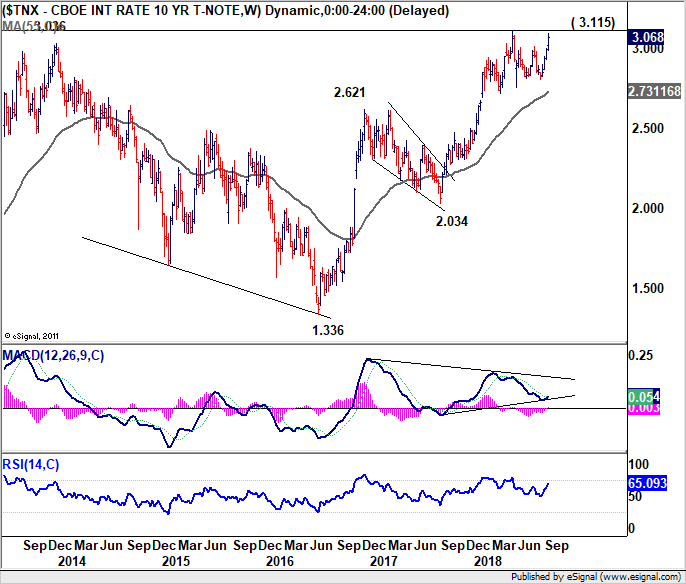
US treasury yields had a strong rally last week, in particular in the long end. 5-year yield closed the week up 0.056 at 2.954. 10-year yield rose 0.074 to 3.068. 30-year yield rose 0.073 to 3.205. Now, both 10 year yield and 30 year yield are back at important resistance levels.
30 year yield (TYX) is facing 3.255 cluster support, with 61.8% retracement of 3.976 to 2.102 at 3.260. The strong support seen from 55 week EMA (now at 2.999) is a sign of underlying bullishness Weekly MACD also stayed positive during the last consolidation pattern. Near term outlook will remain bullish as long as last week's low at 3.120 holds. Decisive break of 3.255/60 will set up a medium term move to 3.976 resistance next.
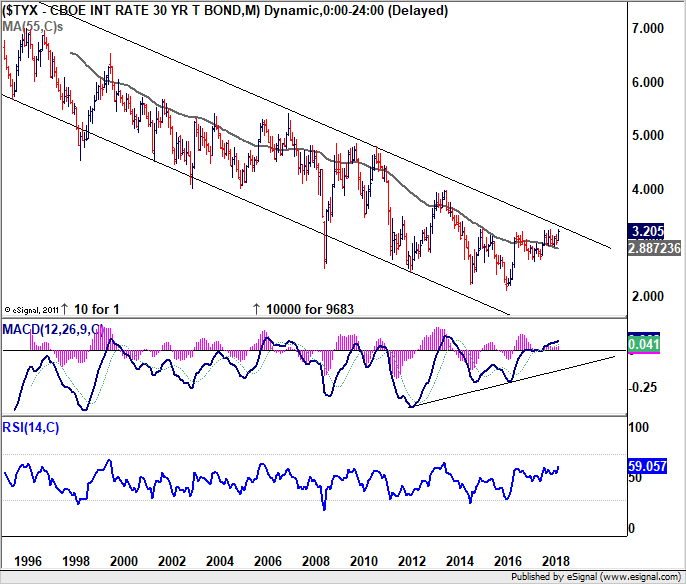
It should also be noted if the bullish case is realized, the multi-decade channel resistance will also be taken out rather decisively. And it's certainly a very bullish development for yields.
10 year yield is looking more bullish then TYX. The consolidation from 3.115 was contained well above 55 week EMA (now at 2.731). Weekly MACD stayed positive throughout. Near term outlook will remain bullish as long as last week's low at 2.989 holds. Firm break of 3.115 will resume whole up trend from 1.336 (2016 low).
Also, next medium term rally will have multi-decade channel resistance taken out. Prior key resistance at 3.036 will be left behind formally. And the development could establish the next medium to long term up trend back towards 5.316. That's a confirmation of end of the era of falling US yields.
Dollar index looking at 93.64 fibonacci level for support
The above bullish case in yield is yet to be confirmed. But if they do happen, it should be very strong support to the greenback. And talking about Dollar, the selloff in the greenback last week was not too unexpected. Dollar index's correction from 96.68 extended to as low as 93.81 but was kept above 38.2% retracement of 88.25 to 96.98 at 93.64 so far. That was equivalent of EUR/USD breaching 1.1779 fibonacci resistance. Also the structure of the decline from 96.98 is so far corrective looking, which doesn't violate our view.
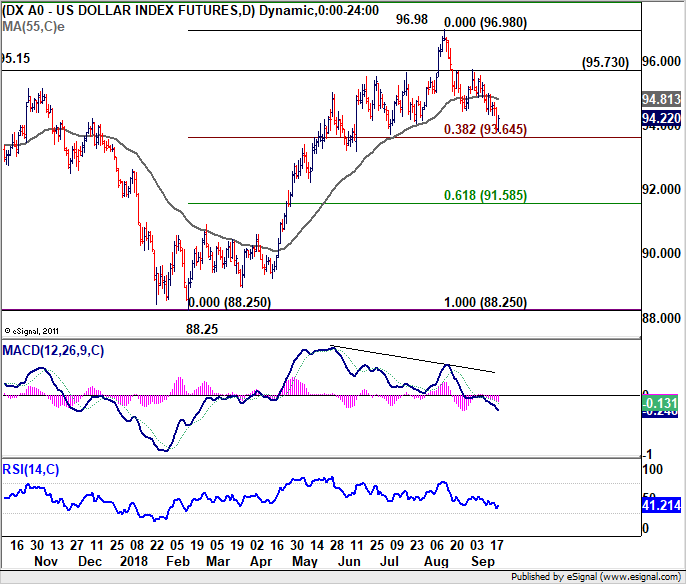
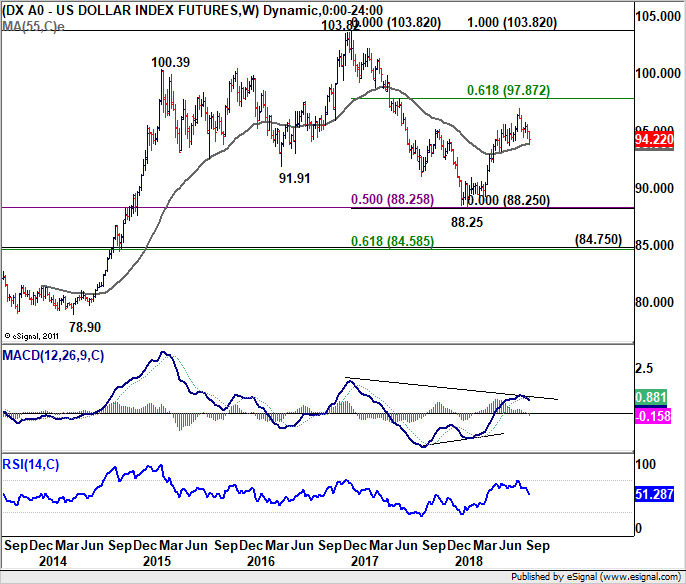
For now, we'd continue to expect this 93.64 fibonacci level to hold, as it's also in proximity to 55 week EMA (now at 93.86). There would be high chance of lifting DXY through 95.73 resistance should TNX and TYX could take out the above mentioned key resistance levels. However, strong rejections by the resistance in TNX and TYX would likely drag dollar index through 93.64 to set up deeper medium term correction.
Position trading strategy
Our sell EUR/GBP strategy was cancelled last week as the cross dipped through 0.8875 support first, before staging a strong rebound towards weekly close. But admittedly, the strategy was wrong. We anticipated some negative news in the early part of the week but eventually, something would be agreed at the EU summit regarding Brexit deal. Unfortunately, the only thing that EU and UK agreed was that they disagreed. EU saw UK Prime Minister Theresa May's Chequer's plan us unworkable. May blamed that EU provided no counterproposals after rejection. The deadlock will continue at least until the next EU summit in October.
On this week's strategy, we'd like to take on a higher risk one in buying Dollar. As noted above, technically, it's the point where Dollar should have a rebound. Based on recent strong data, we don't expect a dovish twist in FOMC announcement. The most dovish scenario is that it doesn't hawkish-up and disappoints the markets. Yen is naturally a good choice considering strong stock and yield rally. But we'd tend to avoid it as it's too close to 113.17 resistance. EUR/AUD's rejection from 1.6172 suggests that Aussie is having an upper hand over Euro. EUR/GBP's strong rebound from 0.8847 indicates Sterling is even weaker. Hence, it brings us back to the miserable pound.
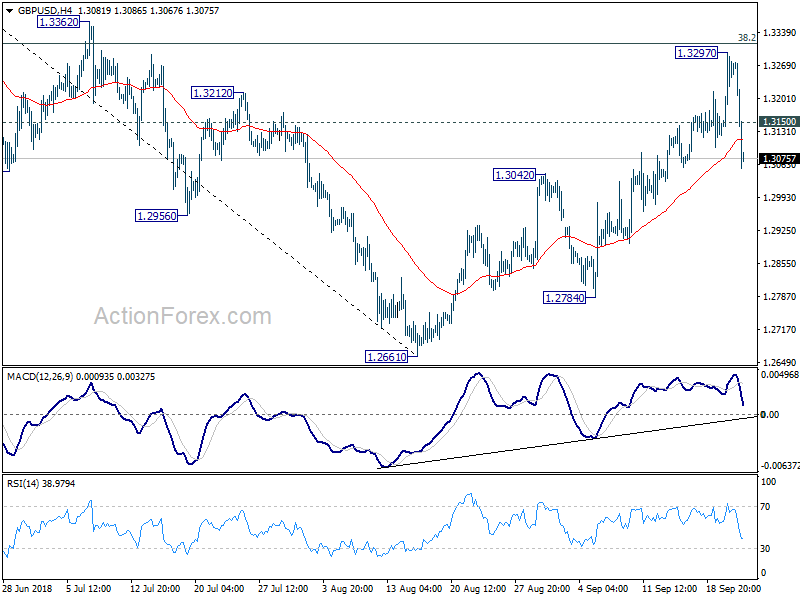
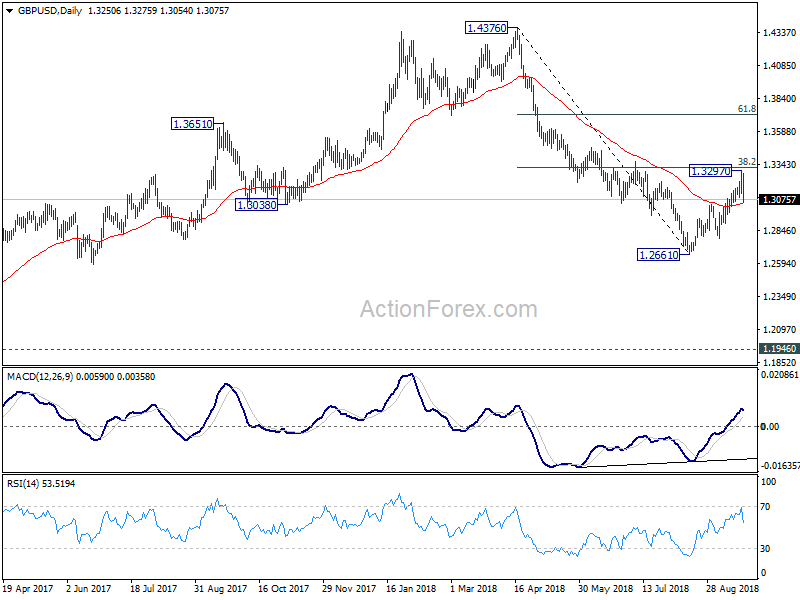
Considering GBP/USD is close to 55 day EMA (now at 1.3051), we'll sell GBP/USD on recovery to 1.3150. Stop will be placed at 1.3300, slightly above 1.3297 top. 1.2661 low will be the target. Risk/reward ratio at 1: 3.26, which is acceptable. Depending on the downside momentum, if things turn out right, we might hold the position through 1.2661.
EUR/USD Weekly Outlook
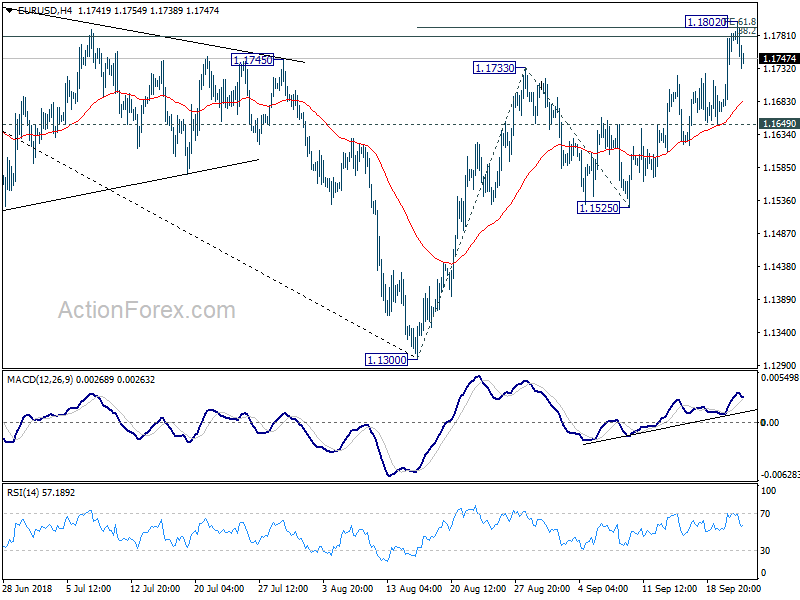
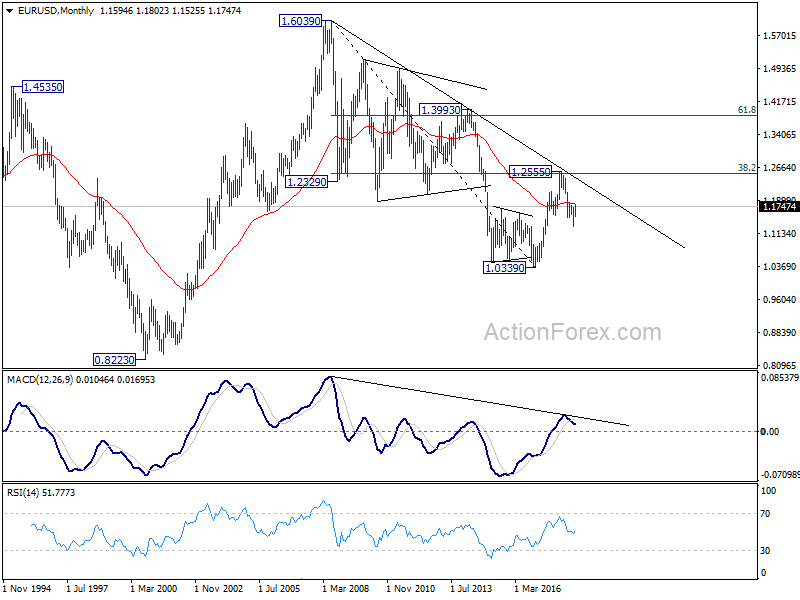
EUR/USD surged to as high as 1.1802 last week but failed to sustain above 38.2% retracement of 1.2555 to 1.1300 at 1.1779 and retreated. Initial bias is neutral this week first. At this point, we maintain our view that 1.1779 should limit upside, at least on first attempt, to bring near term reversal. On the downside, break of 1.1649 minor support will be the first signal that corrective rise from 1.1300 has completed. Intraday bias will be turned to the downside for 1.1525 support first. Break will confirm and bring retest of 1.1300 low. However, sustained break of 1.1779 will extend the corrective rise from 1.1300 to 100% projection of 1.1300 to 1.1733 from 1.1525 at 1.1958 before completion.
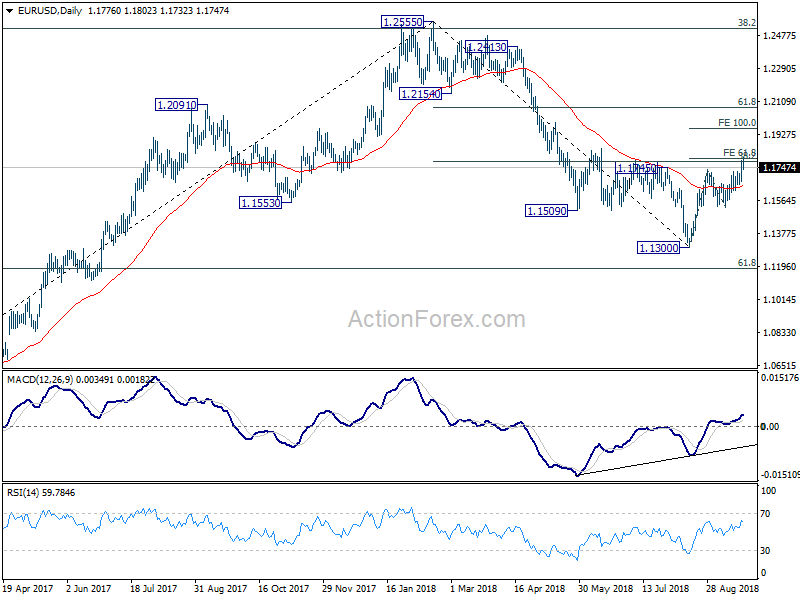
In the bigger picture, a medium term bottom should be in place at 1.1300, on bullish convergence condition in daily MACD and some consolidations would be seen. But still, note that EUR/USD was rejected by 38.2% retracement of 1.6039 (2008 high) to 1.0339 (2017 low) at 1.2516. That carries some long term bearish implications. Thus, we'd expect fall from 1.2555 high to resume after consolidation completes. Below 1.1300 should send EUR/USD through 61.8% retracement of 1.0339 to 1.2555 at 1.1186. And, in that case, EUR/USD would head to retest 1.0339 (2017 low).
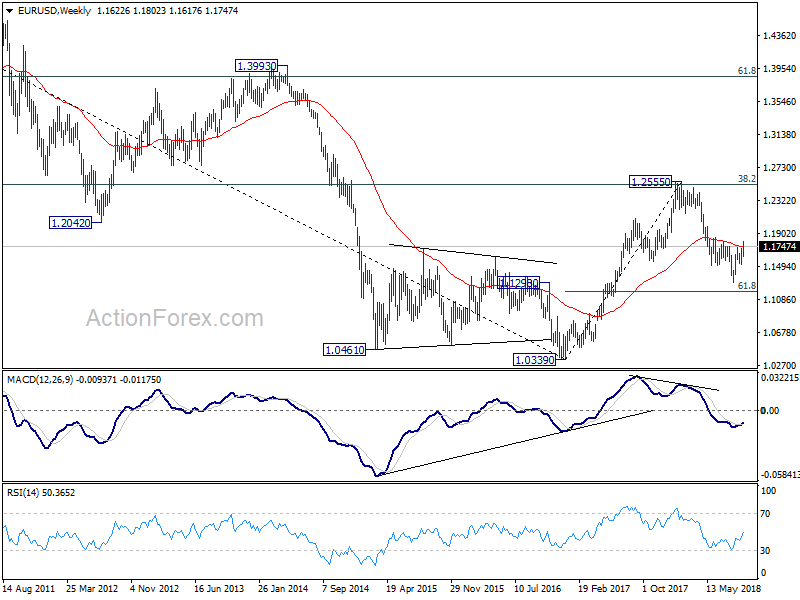
In the long term picture, the rejection from 38.2% retracement of 1.6039 to 1.0339 at 1.2516 argues that long term down trend from 1.6039 (2008 high) might not be over yet. EUR/USD is also held below decade long trend line resistance. Firm break of 61.8% retracement of 1.0339 to 1.2555 at 1.1186 should at least bring a retest on 1.0339 low.
Summary 9/24 – 9/28
Monday, Sep 24, 2018
[php_everywhere instance="1"]
Tuesday, Sep 25, 2018
[php_everywhere instance="2"]
Wednesday, Sep 26 2018
[php_everywhere instance="3"]
Thursday, Sep 27, 2018
[php_everywhere instance="4"]
Friday, Sep 28, 2018
[php_everywhere instance="5"]
Weekly Economic and Financial Commentary: Firmer Global Growth to Be a Gradual Process
U.S. Review
Housing Remains in a Soft Patch
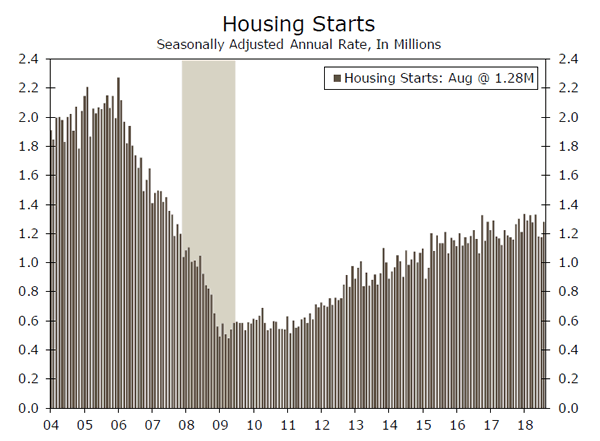
- Housing starts rose 9.2% in August. Volatile multifamily starts increased 29.3%, while single-family units rose 1.9%. Building permits dropped 5.7% during the month.
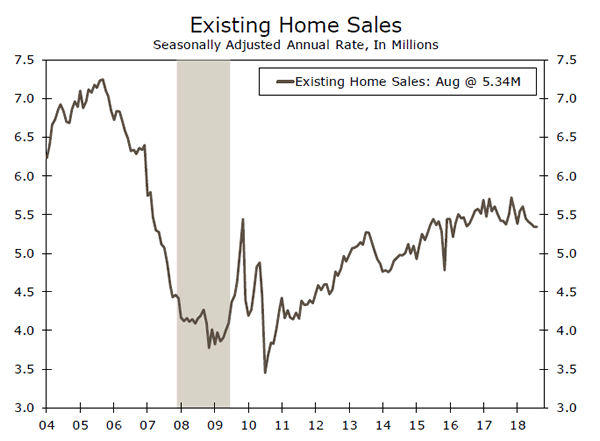
- Existing home sales were unchanged at a 5.34-million unit annual pace in August. The total inventory of available homes was also unchanged at 1.92 million homes. The median price of an existing home rose 4.6% year-over-year.
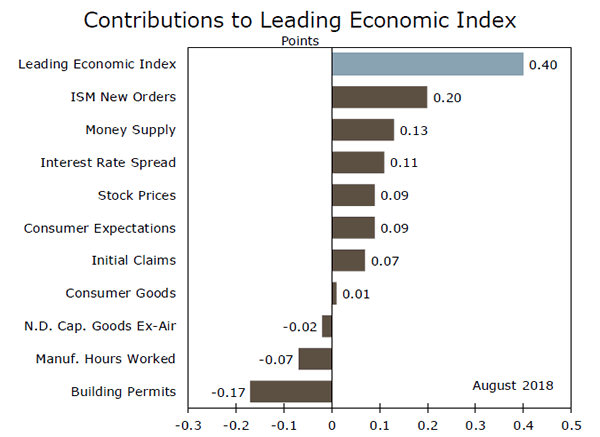
- The Leading Economic Index climbed 0.4% in August, further evidence that economic growth should remain solid in the second half of 2018.
Housing Remains in a Soft Patch
The divide between the sluggish housing market and an economy that continues to exhibit signs of strength continued this week. Housing starts rebounded in August but building permits dropped. Home sales also came in below expectations, as resales of existing homes were unchanged. Despite housing remaining in a soft patch, we still expect real GDP to remain solid and grow 3.1% during Q3 and stay close to that pace through the remainder of the year.
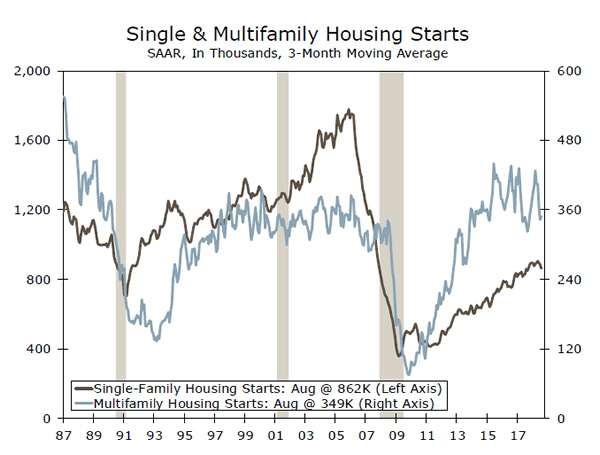
Homebuilding remains subdued. Housing starts rose 9.2% in August; however, building permits dropped 5.7% during the month. Much of the improvement in starts arose from a 29.3% increase in multifamily units. Apartment construction is proving resilient, as affordability and supply concerns are preventing many renters from buying. Single-family starts rose 1.9%. Overall, housing starts came in above consensus, but that is not likely a sign that homebuilding will significantly pick up. Single-family and multifamily starts remain below the pace seen earlier this year.
Housing permits fell 5.7% in August, with multifamily declining 4.9% and single-family dropping 6.1%. Permits are now running below starts, suggesting homebuilding is losing a bit of steam.
The continued sluggish pace of homebuilding and decline in permits run counter to the still strong homebuilders' survey. Shortages of lots and construction workers and higher material prices might be holding back some projects, particularly starter homes.
Home sales also continue to fall short of expectations. Sales of existing homes were unchanged in August at a 5.34 million unit annual pace, following four consecutive months of declining sales. The supply of affordable homes remains exceptionally lean. The total inventory of available homes was unchanged at 1.92 million homes, up from 1.87 million a year ago. Unsold inventory now equates to a 4.3-month supply at the current sales pace. The longterm norm for supply is around 5.5 months.
Existing home sales have been disappointing, as many homeowners remain reluctant to put their homes up for sale due to concerns that they will have a hard time finding a suitable home to buy. The lack of turnover in the housing market has contributed to the sustained run-up in home prices, as homes in desirable locations are tending to draw multiple bids and sell very quickly. The median price of an existing home rose 4.6% year-over-year to $264,800, up from 4.5% a month earlier. According to the National Association of Realtors (NAR), homes typically stayed on the market for 29 days, down from 30 days last August, with 52% of all homes on the market selling in less than a month.
Despite housing being stuck in the slow lane, broader economic activity appears to be solid. The Leading Economic Index (LEI) climbed 0.4% higher in August. The largest contributing factor was a 0.2 point gain from the ISM manufacturing new orders index. A majority of components were also positive contributors to the index, further evidence that economic growth should remain solid in H2-2018.
U.S. Outlook
Consumer Confidence • Tuesday
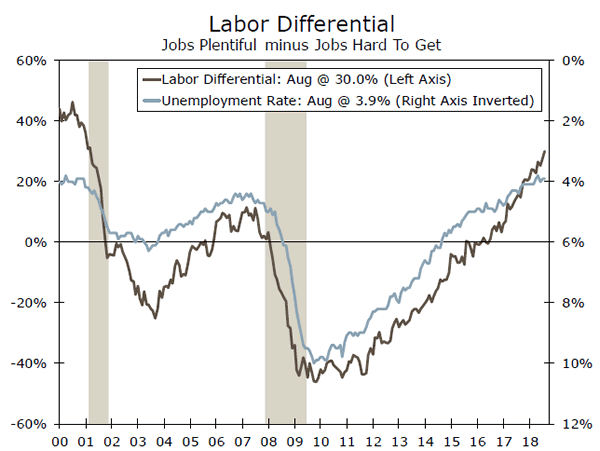
Consumer confidence jumped 5.5 points in August to 133.4. Consumers generally feel upbeat about current economic conditions, but are showing some concern about the future. Current optimism continues to be a reflection of the tightening labor market, as the share of consumers stating jobs as plentiful was little changed, and those who see jobs as hard-to-get fell 2.1 points. These dynamics pushed the labor differential up to its highest level since 2001. Expectations also rose in August, but the overall trend here continues to moderate and will be an area we continue to closely monitor. Consumers generally expect incomes to rise over the next six months, while employment conditions are expected to remain fairly stable. The proportion of consumers who believe present business conditions are good reached a cycle high of 40.3 in August; however, those expecting conditions to worsen rose to 10.5, the highest level since February 2017.
Previous: 133.4 Wells Fargo: 130.5 Consensus: 132.0
Durable Goods • Thursday
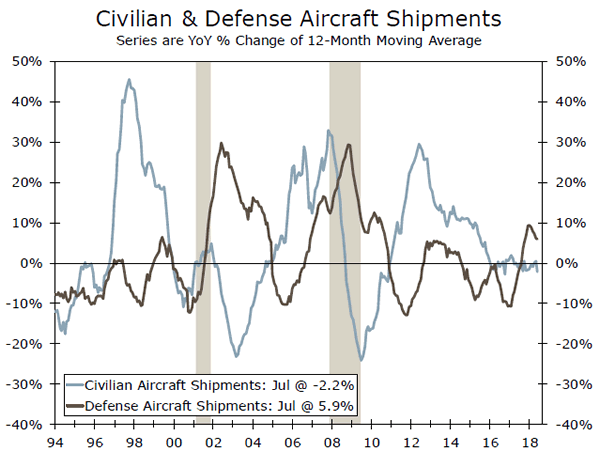
Durable goods orders at U.S. manufactures fell 1.7% in July. The drop was larger than expected, but can mostly be tied to the more than 34% drop in civilian and military aircraft orders. Aircraft shipments remained in line with recent trends. Stripping away the aircraft component, there was fairly broad-based strength in the durable goods report. However, we will be paying close attention to any bounce-back in nondefense shipments in the August report this Thursday, given the BEA includes aircraft in its initial estimate of equipment spending for GDP. Another area that will garner our attention in the upcoming release is inventories. Inventories jumped 1.3% in July, which was the largest one-month stockpiling since 2011. Coming on the heels of a $26.9 billion drawdown in Q2 inventories, even a modest increase in Q3 could add a full percentage point to headline GDP. We expect to see some rebound in August with durable goods orders rising 1.1%.
Previous: -1.7% Wells Fargo: 1.1% Consensus: 1.8% (Month-over-Month)
Personal Income & Spending • Friday
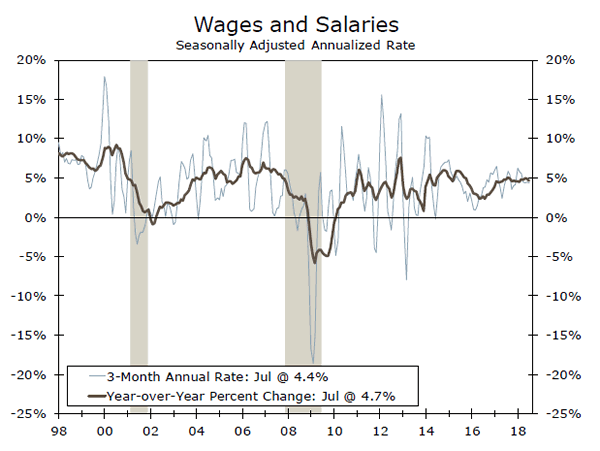
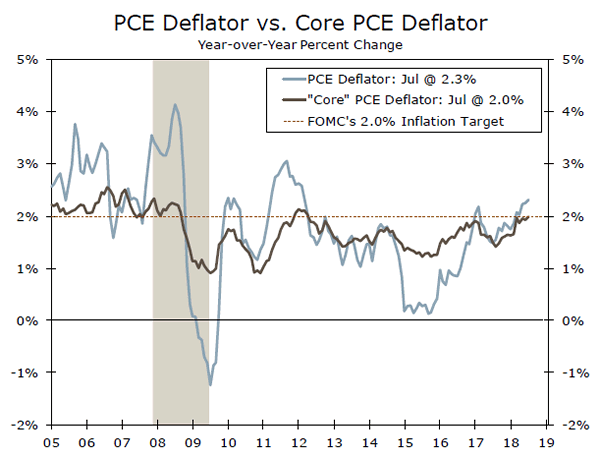
Personal income rose 0.3% in July. Strong job growth and a tight labor market continue to be reflected in the sustained pace of wages and salaries, which were up 4.7% on a year-over-year basis. Personal spending remained elevated, rising 0.4% for the second consecutive month. Consumer spending grew at a break-neck pace in the second quarter, and July's increase in spending offers some affirmation that strong consumption carried into the current quarter. Modest gains in income and rising inflation, however, suggest the pace of spending may slow somewhat in the second half of the year. The overall PCE deflator rose 0.1% in July, this nudged the year-over-year rate up to 2.3%, marking the fastest pace in six years. Core PCE, a more reliable gauge of underlying inflation trends, was up 2.0% from a year-ago in July. With both figures in line with the Fed's target, there was nothing in July's report to dissuade policy makers from another rate hike at next week's monetary policy meeting.
Previous: 0.3% & 0.4% Wells Fargo: 0.4% & 0.3% Consensus: 0.4% & 0.3% (Month-over-Month)
Global Review
Firmer Global Growth to Be a Gradual Process
- This week's global data were mixed. The Eurozone services PMI rose in September but the manufacturing PMI fell, while in the U.K., August CPI inflation and retail sales were both firmer over the month. Signs of global growth improvement remain gradual, and we still look for ECB and Bank of England policy rates to remain steady for some time.
- This week saw some central bank monetary policy announcements, but limited action. Norway's central bank hiked interest rates in response to firmer growth and inflation. The Swiss central bank kept interest rates in negative territory, while the Bank of Japan held monetary policy unchanged.
European Data Mixed, Central Banks Mostly Steady
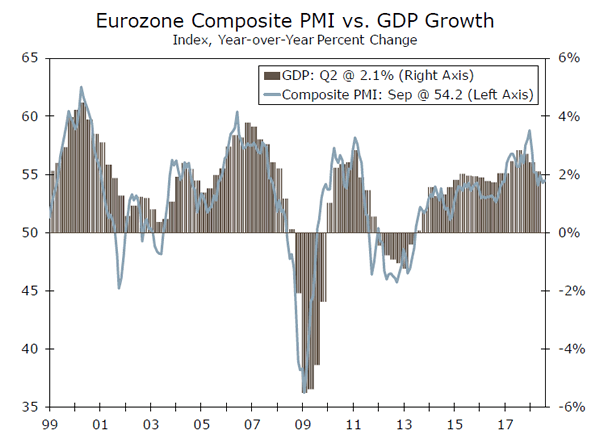
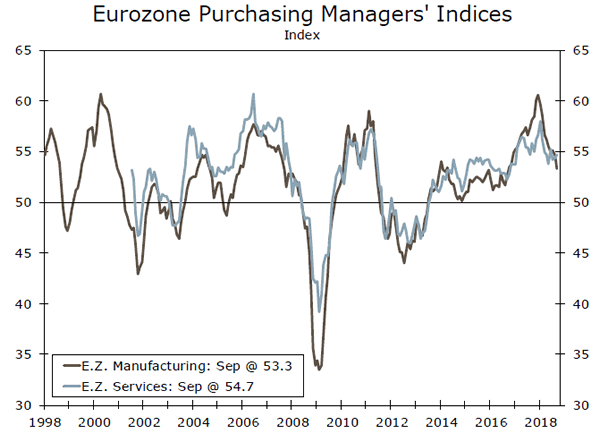
This week saw several economic releases from Europe which were mixed overall and do not yet represent a strong upswing. From the Eurozone, this week's key releases were the manufacturing and service sector purchasing managers indices (PMIs) for September. The manufacturing PMI fell to 53.3, and is now at its lowest level since late 2016. However, the PMI for the service sector–which accounts for the majority of the Eurozone economy–rose to 54.7. Overall, confidence surveys remain consistent with GDP growth in the 1.5%-2.0% range. While there have been some hints of firming wages across the Eurozone, underlying inflation pressures are muted and likely to pick up only gradually, meaning that European Central Bank interest rates should be on hold for an extended period.
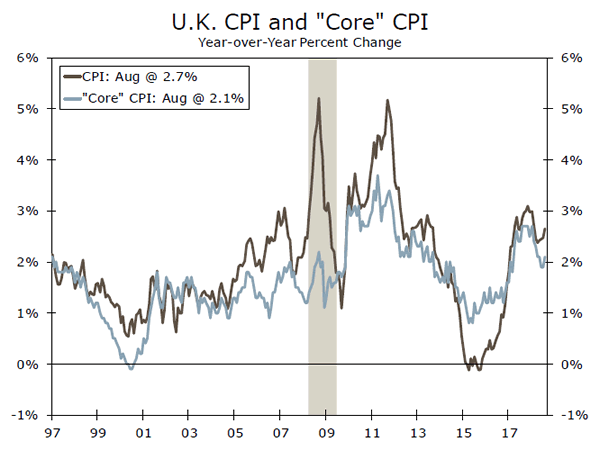
In the United Kingdom, economic data were a touch stronger over the past week. August CPI inflation firmed to 2.7% year-over-year, and core CPI inflation firmed to 2.1%. Despite that uptick, inflation pressures are dissipating overall, after a post-Brexit inflation surge as the pound fell sharply. Meanwhile, August retail sales unexpectedly rose 0.3% month over month, and the July sales gain was revised higher. Still, coming after relatively moderate Q2 GDP growth of 0.4% quarter over quarter (not annualized), we do not see growth or inflation as strong enough to draw the Bank of England off the monetary policy sidelines at this point, especially given the potential for uncertainty to persist while U.K. and European officials continue to negotiate the terms of the United Kingdom's post-Brexit relationship with the European Union.
There were also a couple of central bank monetary policy announcements of note in recent days. Norway's central bank raised its deposit rate by 25 bps to 0.75%, as CPI inflation and economic growth have firmed perceptibly in recent months and quarters. Norway's central bank also indicated that further rate increases were likely, but at a slightly slower pace than previously signaled, with the deposit rate projected just above 2.00% by the end of 2021. In Switzerland, even with solid growth and some quickening of inflation, the Swiss National Bank kept its policy interest rate deeply in negative territory at -0.75%, and gave some hints of concern about Swiss franc strength, stating the currency had appreciated noticeably.
Bank of Japan Keeps Monetary Policy Unchanged
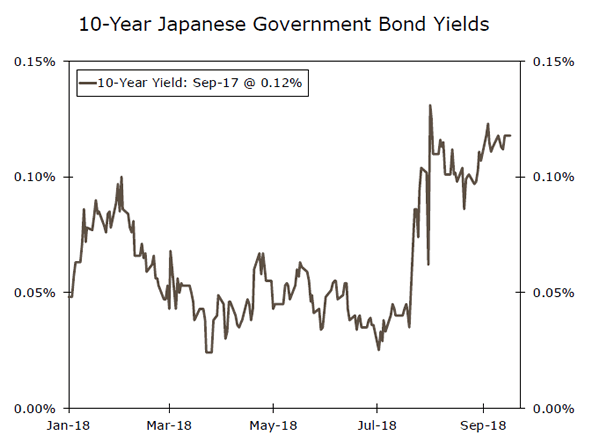
Japan's central bank made no change to its monetary policy stance at its September meeting. The "on-hold" outcome is not surprising given that at its most recent meeting in July, the central bank kept its target for the 10-year government bond yield at zero percent, but doubled the tolerance band for variability around that target to +/- 20 bps. Q2 GDP growth was solid enough at 3.0% annualized, and the August CPI excluding fresh food firmed to 0.9% year over year. That remains well short of the Bank of Japan's inflation goal of 2% and, moreover, price gains have mainly been led by higher food and energy prices. We do not expect the central bank to adjust policy further for the time being.
Global Outlook
Mexico Economic Activity • Tuesday
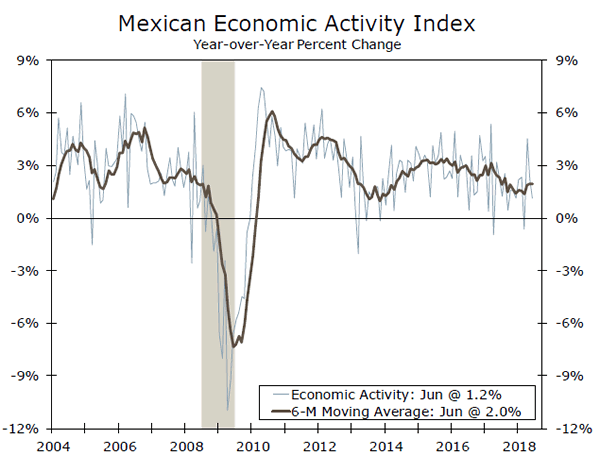
Mexico's economy has endured a great deal of uncertainty this year, with ongoing NAFTA negotiations and a pivotal presidential election among the key economic events of focus in 2018. Despite that uncertainty, the Mexican economy has been resilient, and in fact, growth is showing signs of picking up. Indeed, economic activity has accelerated modestly in recent months after a lengthy slowdown, supported by a rebound in the manufacturing and construction sectors. Strong U.S. economic growth and a competitive exchange rate have likely helped activity in these sectors at the margin.
Meanwhile, growth in the services sector has remained subdued. In all, high real interest rates are likely to limit the extent of any pickup in overall economic growth in Mexico, even as solid U.S. growth provides ongoing support for the Mexican economy. Our forecasts call for GDP growth in Mexico of just 2.2% in full-year 2018.
Previous: 1.15% Consensus: 2.60% (Year-over-Year)
Eurozone Core CPI • Friday
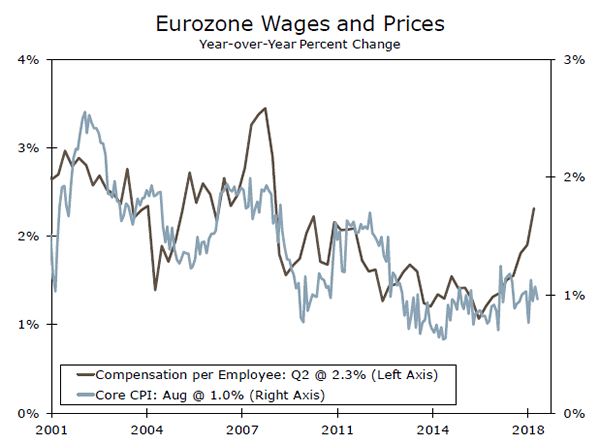
Inflation remains the key variable of focus for the European Central Bank (ECB) as it moves toward a less accommodative monetary policy stance. With core inflation "stuck" near 1%, there is little urgency for the central bank to further dial back easy monetary policy, for now. That lack of urgency is reflected in forward guidance from the ECB, as it said that interest rates would likely remain on hold at least through summer 2019.
That said, underlying inflation pressures in the Eurozone are firming, a sign that a pickup in core inflation may not be too far off. Indeed, as the region's labor market has tightened, wage growth has climbed in recent quarters. In our view, it will be particularly important to monitor the pass-through from quicker wage growth to core inflation for signs on whether the ECB will need to rethink its current guidance on interest rate policy.
Previous: 1.0% Consensus: 1.1% (Year-over-Year)
Canada GDP • Friday
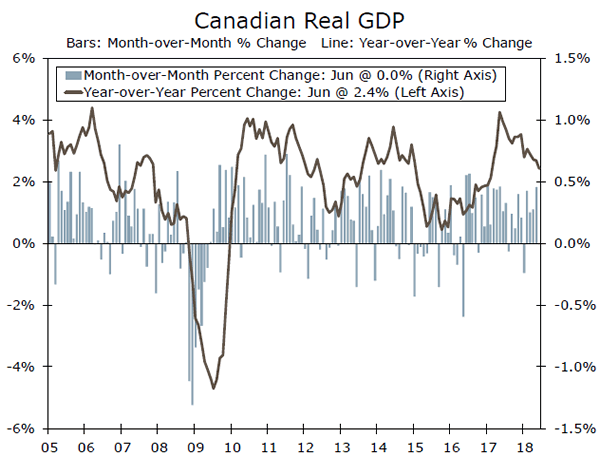
Economic growth in Canada has softened a bit in recent months after a strong 2017, in which real GDP rose 3% during the year. The slowdown has been relatively broad based, although to be sure, GDP growth in Canada remains above the Bank of Canada's (BoC) estimate for potential growth. Indeed, real GDP rose 2.4% year over year in June, compared to the BoC estimate for potential growth of just below 2%.
Based on these estimates, the output gap (the gap between actual and potential GDP) in Canada is likely continuing to narrow, a dynamic that is consistent with core inflation right around the central bank's 2% target. While growth could edge lower in the months ahead, the BoC likely will push on with its gradual rate hike cycle. We look for one more 25 bps rate hike from the BoC before year-end as long as inflation remains firm.
Previous: 0.0% (Month-over-Month)
Point of View
Interest Rate Watch
FOMC Meeting More About 2019
The FOMC is all but certain to take the fed funds rate up another 25 bps at next week's meeting. Currently the market places the chance of a quarter-point hike at 98%. That will make any communication tweaks about future rate hikes the main draw on Wednesday.
There are likely to be few changes to the post meeting statement. Recent indicators point to growth remaining "strong." Risks still look to be balanced as the Fed navigates the tailwinds of fiscal stimulus with the potential headwinds of trade dislocations and volatility in emerging markets.
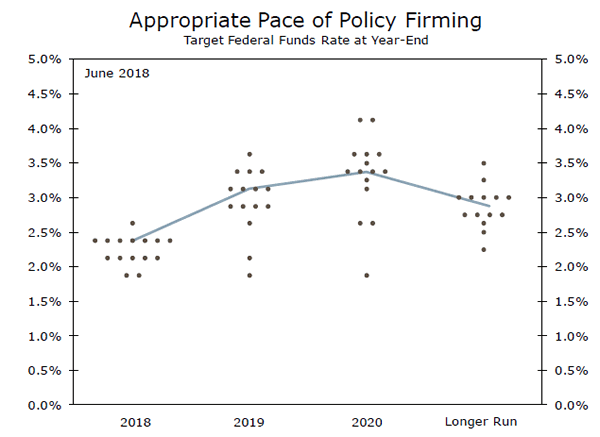
While the statement is unlikely to provide much new insight, updated economic projections should help bring the near-term rate path into view. In June, the median estimate for the fed funds rate at year-end rose to 2.4%, implying another rate hike in December. With hiring still robust and core PCE inflation reaching the Fed's 2% target for the first time in six years, we would expect the "dots" to show that the majority of FOMC members still support a total of four rate increases this year.
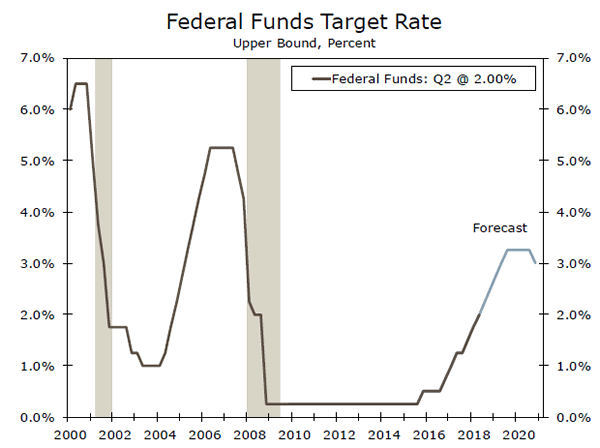
More uncertainty surrounds 2019. The additional two rate hikes before the end of the year would bring the fed funds rate to 2.25%-2.50%, only about 50 bps below what most Fed officials estimate to be "neutral".
At its June meeting, the committee indicated it would likely be appropriate to raise rates above their long-run level by 2019 or 2020, consistent with the median estimate for three rate hikes in 2019. We are in the camp that the FOMC will carry on raising the fed funds rate 25 bps points once a quarter through Q3-2019. At that point, the fed funds rate is likely to be slightly restrictive based on FOMC estimates. Markets, however, are more skeptical. Futures point to the fed funds rate rising to about 2.75% by next September.
The timing and degree of policy changes next year come with an added degree of uncertainty as we reach a critical stage of the cycle. Not only are there questions about neutral, but press conferences after each meeting and new members, including Vice Chair Rich Clarida this month, may also sway the timing and path of policy changes.
Credit Market Insights
The Changing FOMC Composition
This week brought several announcements related to the FOMC. First, Mary Daly was appointed as the head of the San Francisco Fed effective on October 1, meaning she will be a voting member of the FOMC beginning with its November meeting. Next, Richard Clarida was sworn in as Vice Chair; he will vote at the FOMC meeting next Wednesday. Lastly, the White House announced the nomination of Nellie Lang to the Board of Governors, pending Senate confirmation.
While the Senate is otherwise consumed with a rather more contentious confirmation process, Lang will join Marvin Goodfriend and Michelle Bowman in the queue of appointed Fed Governors awaiting confirmation. While such a shift in composition could have implications for the future path of the Fed's interest rate-setting body, we do not expect a major change in course in the near term. The FOMC, under the leadership of Chair Powell, will continue to operate under a "risk management" framework—one that is largely continuous with former Chair Yellen's data dependent "wait and see" approach. Indeed, our call for two more rate hikes this year is largely in line with market-implied probabilities and the FOMC's own projections. But, as mentioned in Interest Rate Watch, monetary policy in 2019 is more uncertain. We see three hikes next year, but as views begin to diverge about the prudent path of the fed funds rate, it will become more important and informative to know the names, faces and views behind the dots.
Topic of the Week
More than Just a Coincidence?
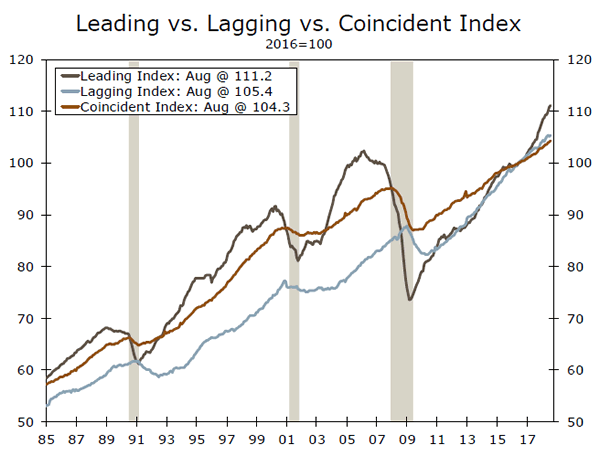
We learned this week that the Leading Economic Index (LEI) was up again in August. Maybe you missed it. It did not exactly cause a halt in trading when it hit the wire. Maybe that's because the LEI has not posted a sequential decline in 27 months. Business cycle indicators have a tendency to fade into the background as a sense of complacency inevitably sets in when the economy is booming and the stock market is setting record highs. Is there anything that market-watchers might be missing in the underlying details?
The release of the LEI also brings with it fresh readings on two other business cycle composites, the Coincident Index and Lagging Index. As the names imply, these measures offer a contemporaneous assessment as well as a rearview mirror for testing the winds of the economy. All three are plotted in the top graph and a few interesting things emerge. First, the good news: the LEI is rising at a steep incline signaling fair skies and following seas. Although we also would point out that, interestingly, the lagging index (blue line) is outpacing the coincident index (maroon line) and this recent emergence in this cycle is the first time that this has happened in the past 30+ years.
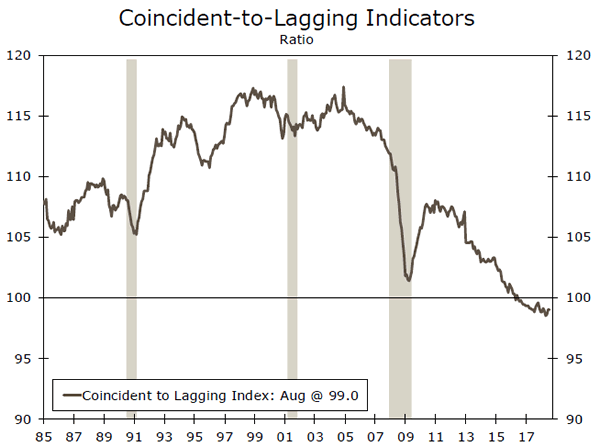
There are some advocates of another approach and that is to make a ratio of Coincident-to-Lagging indicators. We have plotted this ratio in the lower chart. A theory popularized by the economist Richard Yamarone is that when an economic expansion is peaking, both measures are rising but the rate of increase for the coincident measure will be smaller and will thus result in a decline in the coincident-to-lagging ratio.
You might take a skeptic's view of the warning in this cycle as the coincident-to-lagging ratio has declined on trend since about 2013. Still, as the current expansion nears the end of its 111th month, this is no time for complacency. We still think the expansion has a few years to run, but we'll use this space to keep you updated on warning signs along the way in the months ahead.
The Weekly Bottom Line: Positive Data Releases Overshadowed by NAFTA
U.S. Highlights
- U.S. equity markets were unbowed by escalating trade actions between the U.S. and China this week. The S&P500 reached new highs bolstered by healthy earnings reports and growth in share buybacks.
- Equity market optimism is backed up by an economy set to grow by an impressive 2.9% this year, boosted by fiscal stimulus. The Fed is expected to respond to consistently above-trend growth with another 25 basis point rate hike next week, taking the upper limit of the fed funds rate to 2.25%.
- Our latest forecast does not include the impacts of the latest tit for tat tariffs between the U.S. and China. If the current tranche plays out as planned, it could weigh notably on growth at the same time as the fiscal sugar rush fades.
Canadian Highlights
- It was a decent week for Canadian data, with manufacturing sales surprising on the upside and pointing to a positive Q3, alongside decent retail sales.
- Adding to the busy economic calendar was an existing home sales print that reinforced the post-B20 housing market stabilization narrative, and core CPI measures sitting at the BoC's target.
- NAFTA talks stole the show this week, with no clear end in sight as Canada emphasized the importance of a good deal irrespective of looming deadlines.
U.S. - Market Optimism Unbowed by Trade Risks
Neither escalating trade wars, devastating hurricanes, rising interest rates, nor tumultuous emerging markets prevented the S&P500 from attaining new heights this week. Strong corporate earnings growth is playing a key role, as is a 50% increase in share buybacks over the first half of 2018. Thanks to tax cuts, corporations are awash with cash, and have managed to increase capital expenditures and return money to shareholders.
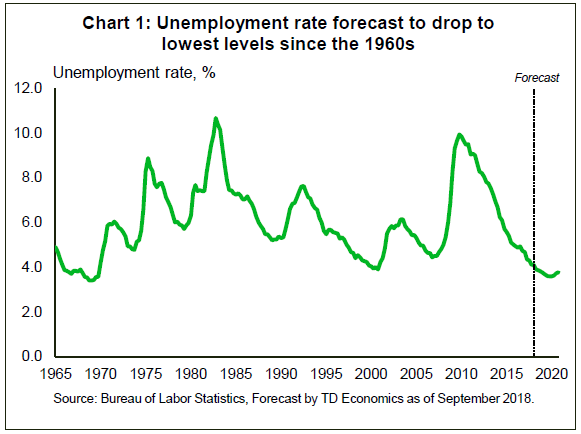
Strength in equity markets is backed up by a very healthy U.S. economy. Our latest Quarterly Forecast outlines how fiscal stimulus is helping to boost real GDP growth to 2.9% this year. Growth well above potential is expected to push the unemployment rate to the lowest level since Woodstock (Chart 1). With the economic party raging, the Federal Reserve is widely expected to drain some more punch from the bowl next Wednesday. A 25 basis-point rate hike will raise the fed funds rate to 2.00-2.25%, marking the eighth rate hike since 2015. We expect the Fed to hike four more times over the next year, placing the fed funds target at a peak level of 3.25% in 2019.
Next week's decision looks like a done deal, but the Fed's economic forecast will still be closely watched. Now that another tranche of tariffs on Chinese imports and China's retaliatory measures are on the books, it will be interesting to see how FOMC members adjust their outlook, if at all. Our forecast calls for growth on a quarterly basis to slow from roughly 3% in the second half of 2018 to below 2% by 2020. Those numbers do not include the impact from the latest round of tit for tat tariffs.
If the 10% tariff on roughly $200bn in Chinese imports run their stated course, and rise to 25% on January 1st, we estimate that U.S. real GDP growth could be knocked back by roughly 0.4 percentage points over a 4-6 quarter period. The peak impact would occur at roughly the same time as the waning impact of fiscal stimulus measures exerts a drag on growth. Those two headwinds could hold the economy back to a very anemic 1.5% pace by early 2020.
In the event of full escalation of the U.S.-China trade war, where the administration follows through on its threat of tariffs on a further $267bn in Chinese imports, the economic hit would double to 0.8 percentage points in total. That could push US growth closer to 1%. For now, it seems financial markets do not think that this outcome is too likely, but forecasters are becoming increasingly concerned about the risks to growth in 2019. The OECD lowered its targets for global growth slightly in its outlook published this week. It now expects the global economy to grow by 3.7% next year, down two ticks from its 3.9% forecast back in May citing downside risks from trade.
We also expect global growth to moderate next year to 3.6%, due to weakening emerging market momentum, without the impact from escalating China-U.S. trade tensions. The path forward on tariffs is not written in stone, and hopefully if the political rhetoric cools down after the U.S. mid-term elections in November, cooler heads might also prevail at the trade negotiation table.
Canada - Positive Data Releases Overshadowed by NAFTA
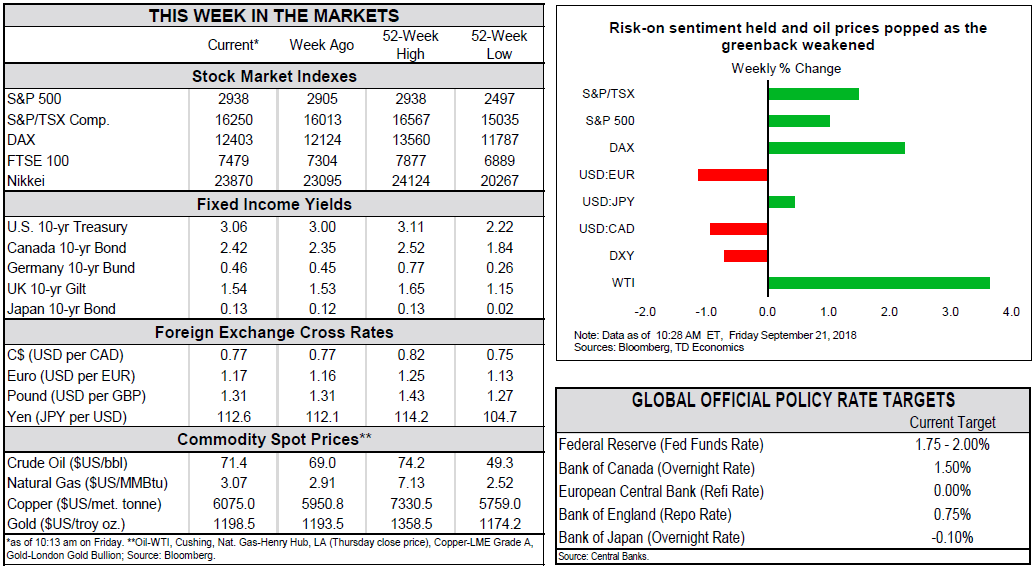
It was a busy week on the Canadian data front, with financial markets and trade negotiations offering an added element of excitement. A run in healthcare, financials, and energy, amongst others, helped to move the S&P/TSX up to its highest level this month – climbing more than 1.3% so far on the week (as of 10AM). This was coupled with a jump in WTI prices above the $70 mark on the wake of Iranian supply concerns. Finally, the loonie gained on the week, due in part to risk-on sentiment weakening the greenback, increases in oil prices, and the market shrugging off trade uncertainty.
On the data front, releases this week solidify our view that macroeconomic fundamentals remain strong in Canada. As discussed in our latest Quarterly Economic Forecast, our 2018 and 2019 GDP forecasts were modestly revised upward to allow for new cannabis accounting, in addition to some slight additional upside in housing market momentum.
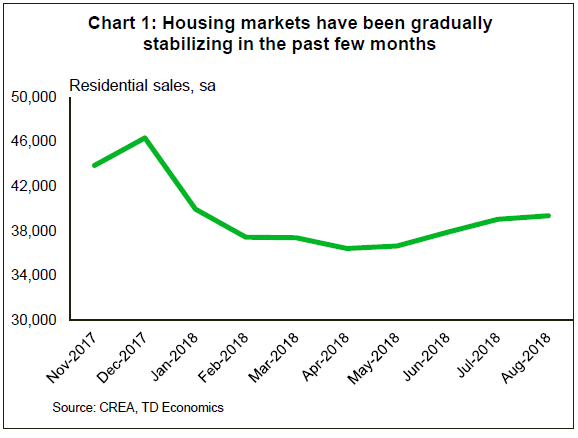
To that point, kicking off the release schedule was a home sales print of +0.9% month-on-month in August, its fourth consecutive increase. Especially notable were gains in some of British Columbia's markets, the hardest-hit by a combination of federal and provincial regulations. Once again, the release adds more evidence that housing markets are recovering from the late-2017 macro-prudential measures, and are on track to add some modest upside to growth.
Meanwhile, manufacturing sales were particularly impressive, rising 1% in real terms in July and boosted further by an upward revision to the previous month's data. Retail sales met expectations with a modest 0.3% increase in July – although volumes were flat. Dissecting the monthly noise, the trend in both indicators offers a consistent healthy picture of an economy overcoming ongoing headwinds and transitory factors (tariffs, outages, rising interest rates).
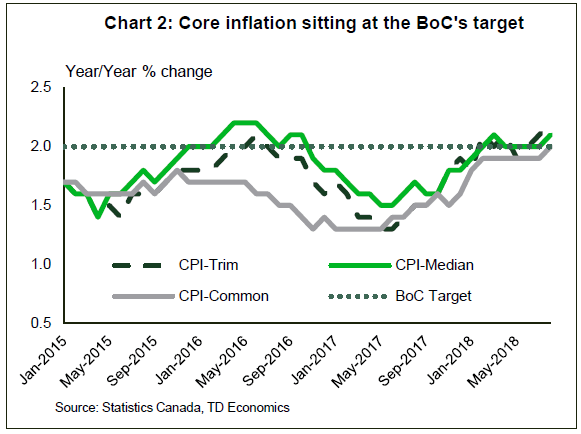
Wrapping it all up was perhaps the week's most watched release: consumer price inflation. Coming in at 2.8% year-over-year in August, headline inflation declined slightly from July, signaling that last month's gasoline and transportation spikes were only a transitory bump. More importantly, the Bank of Canada's target measures all hovered around its 2% target, with CPI-Common sitting exactly at 2%. Taking the two together, the release reinforces the narrative that the economy is operating at or above capacity.
All told, the wealth of generally positive releases confirms our view on the BoC's next move. An October rate hike has likely been sealed barring any exceptional releases. That said, the timing and pace of further hikes is not as clear-cut. With inflation not showing any pressing movements, and with trade uncertainty still a factor, rate hikes are likely to be more gradual in 2019. Indeed, the BoC has cited trade uncertainty as one of its most-watched developments in the medium and long term. As we saw from yet another week with little progress on NAFTA negotiations, this uncertainty may be sticking around for some time yet.
Canada: Upcoming Key Economic Releases
Canadian Real GDP - July
Release Date: September 28, 2018
Previous: 0.0% m/m
TD Forecast: -0.1% m/m
Consensus: N/A
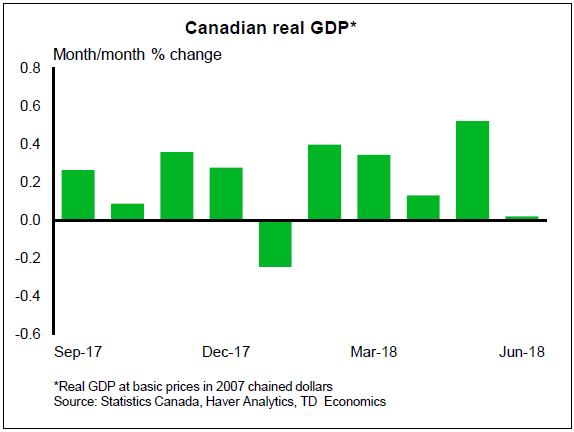
Industry-level GDP is set to post a modest 0.1% decline in July on weakness in the energy sector after power outages curtailed output from a large producer in the oil sands. The pullback in energy output will leave services to drive growth while manufacturing and utilities provide a modest offset. A country-wide heat wave will provide a key tailwind to the latter, though it also threatens residential construction due to unfavourable working conditions. Weakness in the energy sector should be temporary, and we look for output in the oil sands to bounce back in the coming months. Furthermore, we expect the BoC to look through such distortions ahead of the October meeting. The 1.5% forecast for Q3 from the July MPR indicates that they've already penciled in some downside for July and Senior Deputy Governor Wilkins recently said she expects growth to average 2% over H2, implying a rebound in Q4.
Week Ahead; Theresa May, Trump, Trade War, Fed
Thersa May created a lot of uncertainty in the market by saying no deal is better than a bad deal. She has nothing on the table and traders knows about this.
Minutes from the 4 September monetary policy meeting at the Reserve Bank of Australia confirmed that the next move in interest rates is likely to be another hike. Trump is asking OPEC to cut oil prices, and this is going to be the major theme in the oil market. The UK retail sales and inflation beat forecasts despite Brexit uncertainty, and this pushed the sterling higher however the question is if it can sustain its gain. China has imposed 10% tariffs on $60bn American imports in response to US 10% tariffs on 200bn chinses goods.
Technical Analysis
EUR/USD
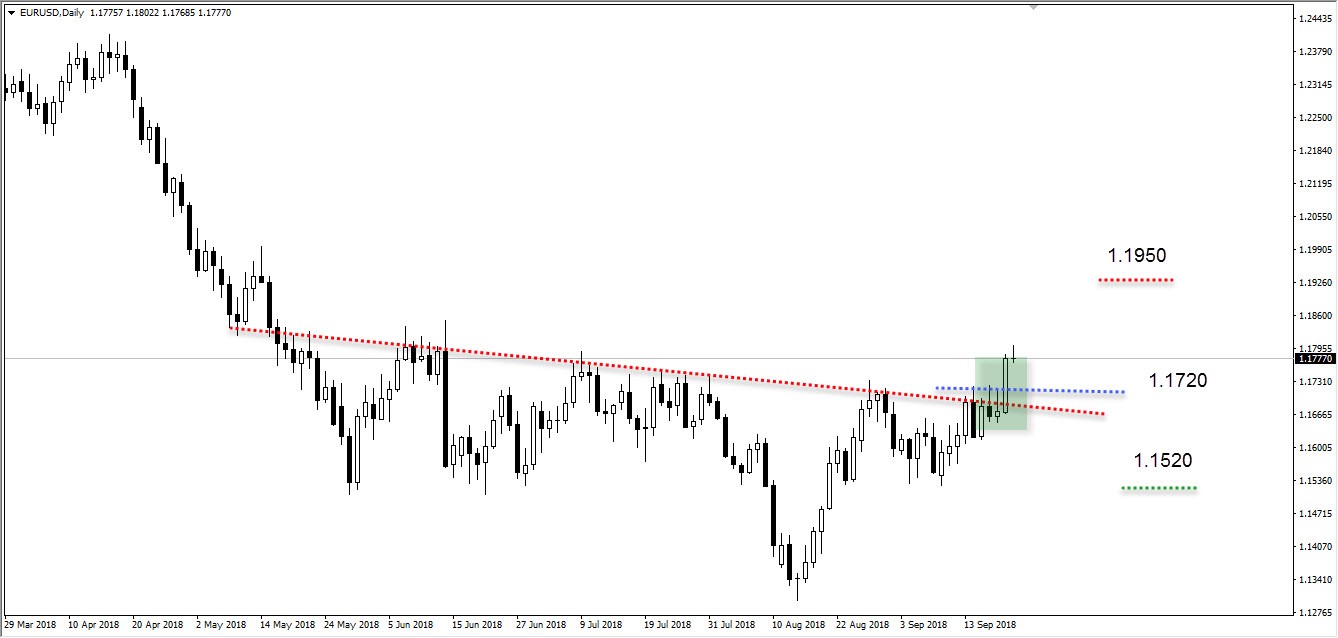
EURUSD has broken its downward trendline on a daily time frame. The price is trading in a bullish breakout and this confirms that the trend is skewed to the upward. Having said this, the price is firmly trading above the major levels at 1.1720 which shows that the there is a higher chance that the price may continue its bullish wave. The Balance of Power shows that the bulls are still controlling the momentum.
The resistance is shown by the red horizontal line which is the highest point which the price made on the 15th of May. The support is show by the green line which is the lowest point formed on the 21st of August.
GBP/USD
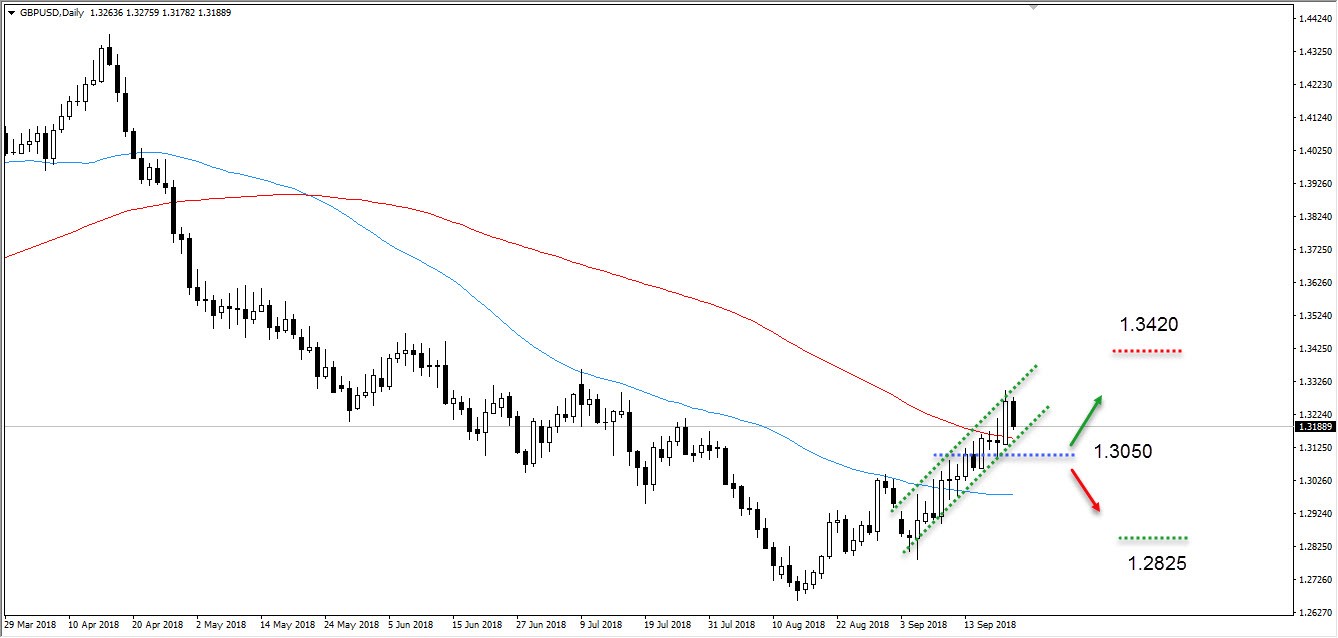
Sterling has broken a critical level at 1.3050 on daily time frame. The price is trading in a bullish tight upward channel and this confirms that the trend is skewed to the upside. Having said this, the price is firmly trading above the 50 and 100-day moving averages which shows that the there is a higher chance that the price continue its upward move. Currently, there is a battle between the price and the 100-day moving average and if the price holds above it, the odds will be even stronger that the uptrend will shape up from there.
The Balance of Power shows that the bulls are still controlling the momentum, we need to see buying pressure continues.
The resistance is shown by the red horizontal line which is the highest point which the price made on the 14th of June. The support is show by the green line which is the lowest point formed on the 5th of September.
USD/JPY
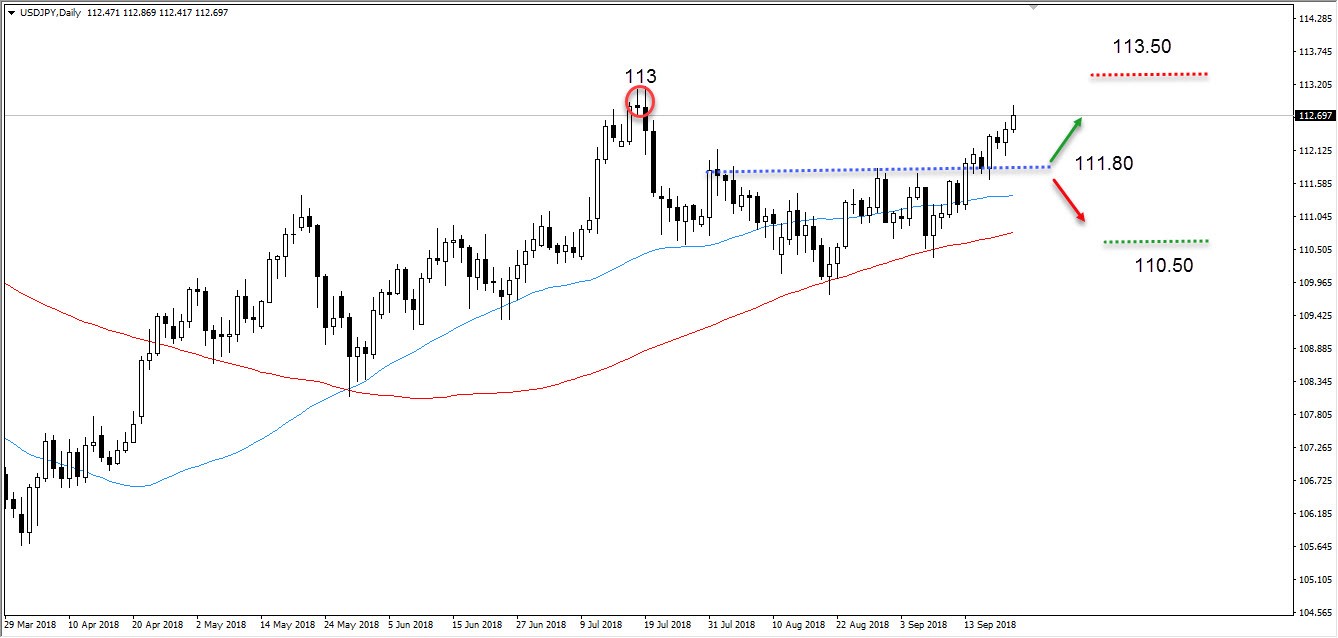
EURUSD has broken its downward trendline on a daily time frame. The price is trading in a bullish breakout and this confirms that the trend is skewed to the upward. Having said this, the price is firmly trading above the major levels at 111.80 which shows that the there is a higher chance that the price may continue its bullish wave. The Balance of Power shows that the bulls are still controlling the momentum.
The resistance is shown by the red horizontal line which is the highest point which the price made on the 27th of December,2017. The support is show by the green line which is the lowest point formed on the 13th of September.
XAU/USD
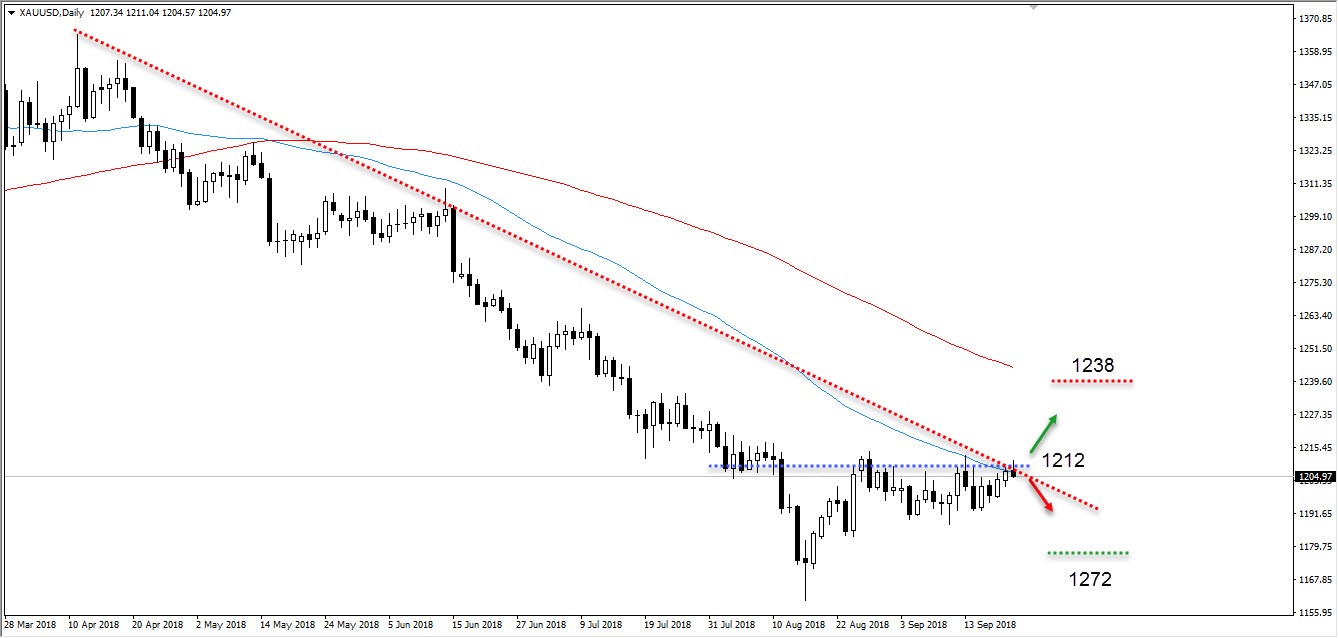
Gold is trading within a range market on a daily time frame. The price is trading tight range between 1212 and 1195. Having said this, the price is firmly trading below the 50 and 100-day moving averages which shows that there is an equal chance between a bullish and bearish breakout. Currently, there is a battle between bears and bulls if the price breaks towards the upside (closing higher than 1212s levels), the odds will be even stronger that the uptrend will shape up from there.
The resistance is shown by the red horizontal line which is the highest point which the price made on the 17th of July. The support is show by the green line which is the lowest point formed on the 16th of August.
WTI
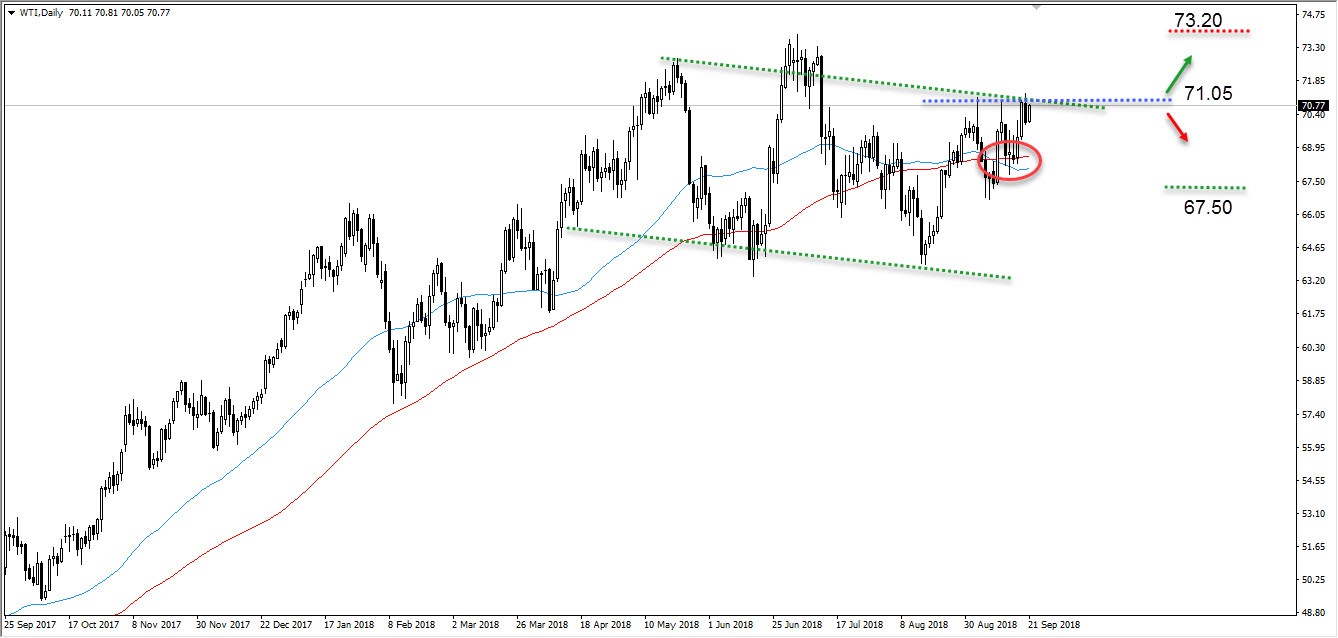
Oil is trading at the upper boundary of the declining channel on a daily hour time frame. The price is trading in a downward channel and this confirms that the trend is skewed to the downside. Having said this, the price is firmly trading above the 50 and 100-day moving averages with a weakness which shows that there is a higher chance that the price may move downward to the moving averages crossovers point at 68.50.
The Balance of Power shows that the bears are still controlling the momentum, we need to see this continue and that would support the above argument.
The resistance is shown by the red horizontal line which is the highest point which the price made on the 10th of July. The support is show by the green line which is the lowest point formed on the 18th of September.
Dow Jones
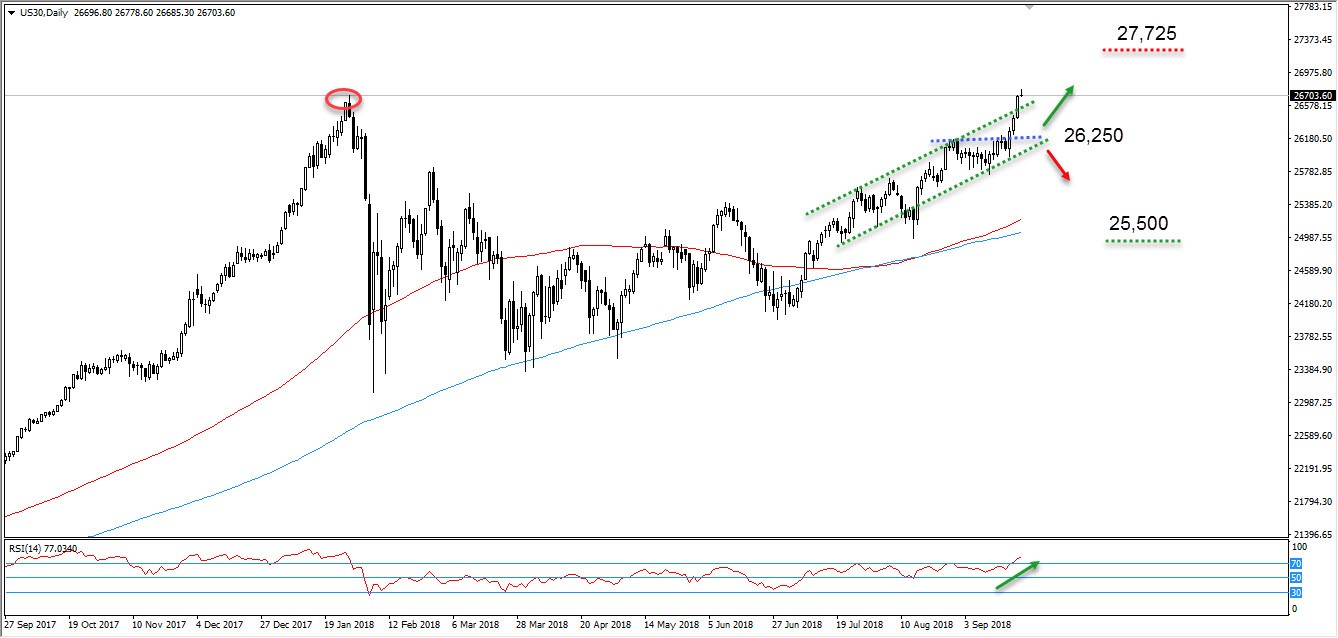
Dow Jones has broken all time highs on a daily hour time frame. The price is trading in a bullish upward channel and this confirms that the trend is skewed to the upside. Having said this, the price is trading above the 100 and 200-day moving averages which shows that the there is a higher chance that the price may continue is upward move.
The Balance of Power shows that the bulls are controlling the momentum, we need to see this build up and that would support the above argument.
The resistance is shown by the red horizontal line which a result of the expected of a measure move. The support is show by the green line which is the lowest point formed on the 23rd of August.
Trump’s Trade Crusade: Good or Bad for World Economy?
Key points
- The tit-for-tat trade dispute between the US and China escalated this week.
- However, the market reaction was positive, as the actions were not as bad as expected.
- Indeed, both countries pushed for lower trade barriers (with other countries).
- While it will be a long and difficult path, we think a deal will be reached eventually.
- This may actually leave the world economy better off than before the whole trade dispute started.
This week saw an escalation in the tit-for-tat trade war between the US and China. First, on Monday, the Trump administration announced 10% tariffs on USD200bn worth of imports from China, taking the total imports from China hit by new tariffs to USD250bn, or roughly half of the total US imports from China. Chinese authorities responded relatively swiftly, announcing 5-10% of tariffs on USD60bn of imports from the US from 24 September. Clearly, a negative development for the sake of the world economy, as it increases uncertainty for companies and risks hurting global trade if these trade restrictions are made permanent.
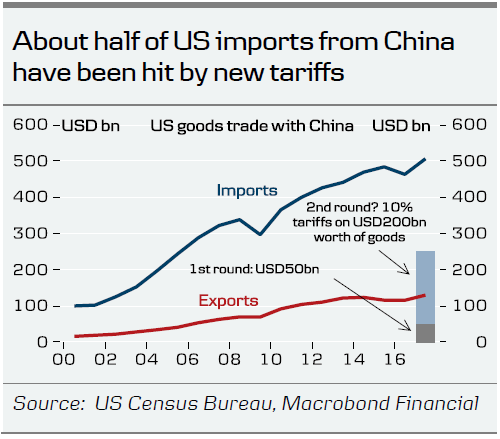
However, the market reaction this week was very interesting. Instead of falling off the cliff, risk sentiment actually improved. For a start, the market was probably relieved that the new US tariffs were 'only' 10% and not 25% as Trump had signalled. And the Chinese response were also fairly moderate. This reversed some of the sell-off that EM currencies faced in the early summer when trade tensions escalated. On another note, despite threatening to decline the US's invitation for further trade negotiations by the end of week if Trump proceeded with the new tariffs, the Chinese have still not called off these negotiations. Overall, this suggests that some caution is being exercised on both sides to not provoke the other side too much.
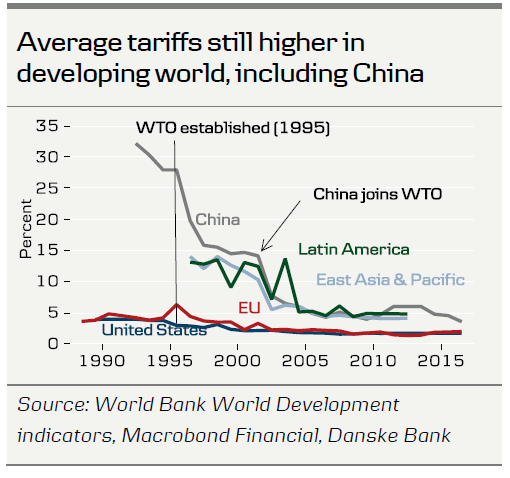
Furthermore, this week there were also pledges to reduce trade barriers towards other countries from both China and the US. While the US hit China with new tariffs, the Trump administration signalled a desire to push for bilateral trade agreements with Canada, Europe and Japan. Similarly, on Wednesday, China's premier Li Keqiang said China plans to cut tariffs on imports from the majority of its trading partners next month (see Bloomberg). It is an interesting development, as China cut tariffs in July on a range of consumer goods. Both moves, if put into effect, would be good for the global economy. Finding a solution between China and US appears to be the biggest obstacle at this stage. We remain sceptical that a deal can be found before the US mid-term elections and think that genuine discussions will first start when the pain is felt on both sides. Along the way, there is a risk that the two sides might fail to reach a solution, and that the new higher trade tariffs become the 'new normal' or the conflict even escalates. However, we think that both sides will ultimately have a strong interest in finding an agreement. If such a deal includes scrapping the tariffs that have been put in place over the past months and moreover leads China to open up to more foreign investment and foreign trade (by actually lowering the average tariffs by more than before the trade dispute started), then the global economy may actually be better off. However, the road is likely to be long (lasting well into 2019) and is paved with uncertainty and market volatility.
FOMC Preview: Destination Neutral
- As the real economy is in good shape, the Fed is on autopilot until the target range reaches 2.75-3.00% (most FOMC members' estimate of the neutral rate)
- After neutral is reached, it is more 'stop and go' depending on how the economy is doing and how markets are reacting to the monetary tightening. We expect the Fed to continue hiking next year.
- We continue to see modest upward pressure for 10Y US treasury yields and have a 12M forecast at 3.25%.
- Continued Fed hikes should help EUR/USD revisit the 1.15 area again during the course of the autumn.
Fed outlook: Fed on autopilot at least until March
In line with everyone else, we expect the Fed to raise the target range by 25bp to 2.00- 2.25% at next week's meeting. We do not expect it to be necessary for the Fed to send any new important signals to the markets. We believe the most important parts of the statement will remain unchanged and even if the sentence 'monetary policy is accommodative' is removed or changed, it should not matter much, in our view, as it would just reflect reality.
With respect to the dots, the Fed will most likely still signal another hike in December (and probably that more FOMC members support this) and three hikes next year (it was divided between two or three additional hikes next year and it would take four members to move it higher). The Fed will also still signal that it is going to raise the Fed funds rate above the longer-run dot. The longer-run dot may be revised higher to 3.00%.
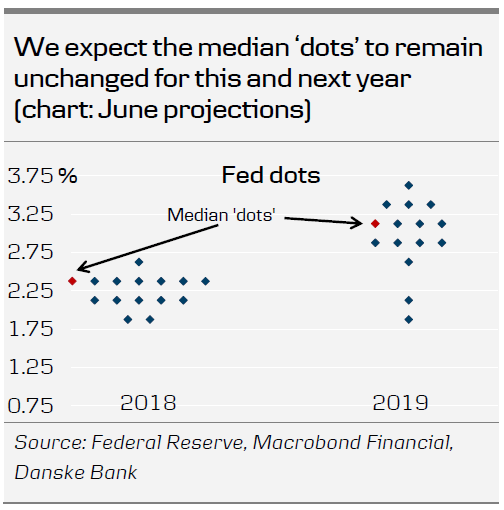
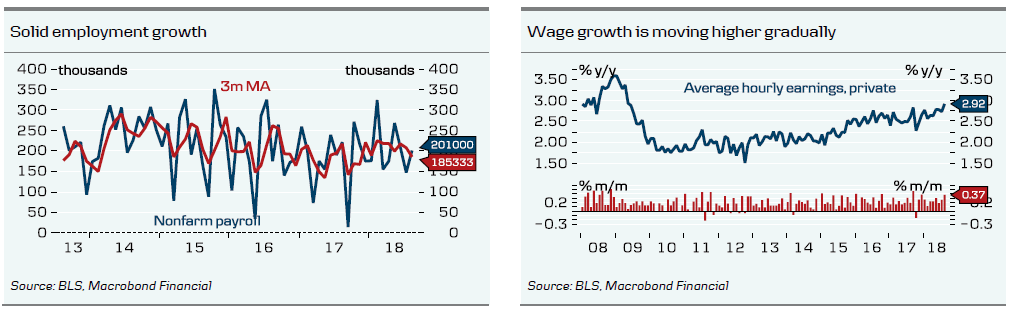
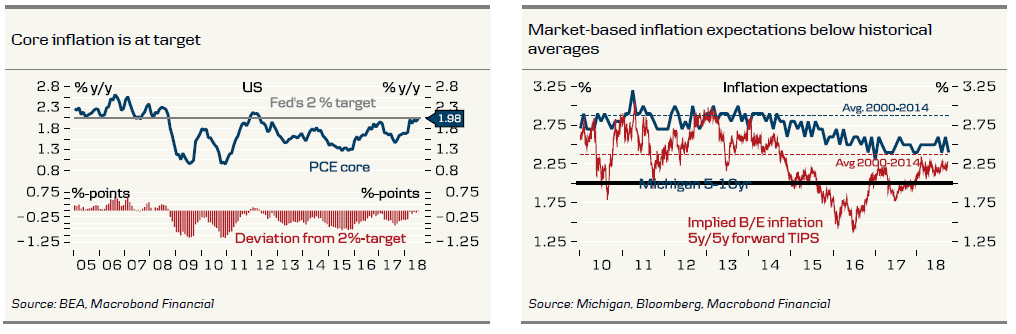
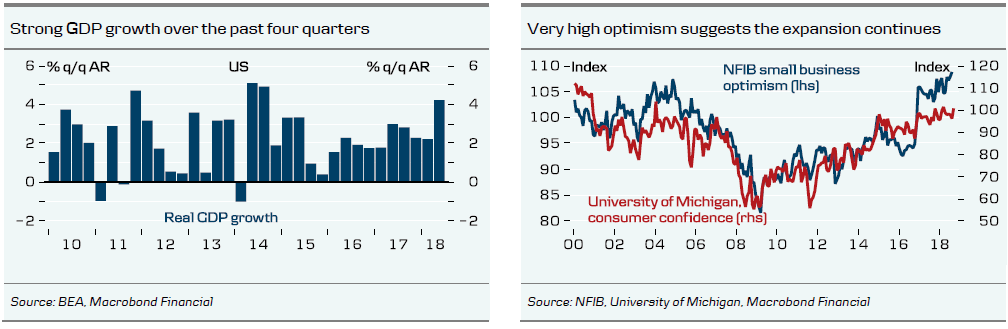
Currently, most FOMC members are signalling that the (nominal) natural rate of interest (the rate where monetary policy is neither expansionary nor contractionary) is around 2.75- 3.00% and many, even the more dovish members, have signalled in speeches that the Fed is on autopilot until neutral is reached. That means that the hikes in December and in March seem very likely. Another hike during the summer next year, perhaps June, is also likely. The real economy is in good shape and is stronger than when the Fed started its tightening cycle: Growth is strong, employment continues to rise, wage growth is increasing, PCE core inflation is 2% and optimism is high. The trade war has not had a material impact on the US economy so far, partly because the US economy is quite closed and partly because the massive fiscal boost is offsetting the negative impact from trade.
After the Fed funds rate reaches neutral, it is more 'stop and go' depending on how the economy is doing and how markets are reacting to monetary tightening. At the June meeting, Fed Chair Powell hinted that the reason why the Fed removed much of its forward guidance was because he wants more flexibility going forward. It is also going to be easier, as every meeting is 'live' next year when Powell is hosting a press conference after every meeting. We believe the Fed will be able to continue hiking with one hike in H2 19 (i.e. three hikes next year and a total of five hikes from now until year-end 2019). Markets are pricing in 3.75 hikes from now until year-end 2019 (i.e. including the hike next week).
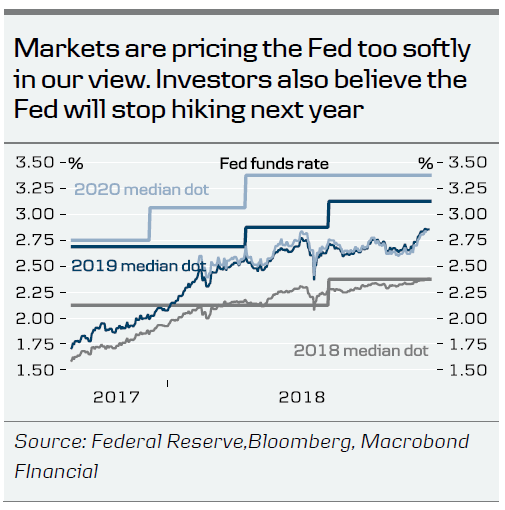
Recently, Brainard held a very interesting speech, where she discussed the concept of the natural rate of interest. She argues that there are short-term fluctuations in the natural rate of interest, meaning that you should distinguish between the short-run and long-run natural rate. While the Fed's median longer-run dot (2.875% currently) is an estimation of long-run natural rate, she believes the short-run rate is higher. In other words, Brainard believes it is necessary for the Fed to raise the Fed funds rate above 2.875% to keep monetary policy neutral. So, in line with our base case, the Fed will not necessarily stop hiking in mid-2019 and may continue into 2020.
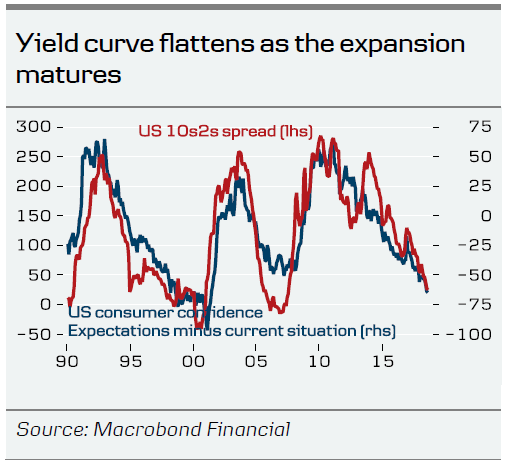
The flattening of the US yield curve has attracted a lot of attention recently, not just by investors and Fed watchers but also by the Fed itself, as a negative US 10s2s spread has historically been a reliable indicator of a forthcoming recession. The minutes from the last meeting suggest that it is something the Fed is monitoring. Still, we would like to highlight two things: (1) the 10s2s spread is still positive and needs to turn negative and stay there for a while before it is a reliable recession signal and (2) more narrow spreads like the 2s3m need to turn negative as well. That said, there is an internal division between the Board of Governors, who do not seem so concerned right now, and the Regional Presidents, who seem more concerned. We believe the Fed will react accordingly if markets send a strong recession signal but we are not there yet.
Fixed Income: little impact on US treasuries
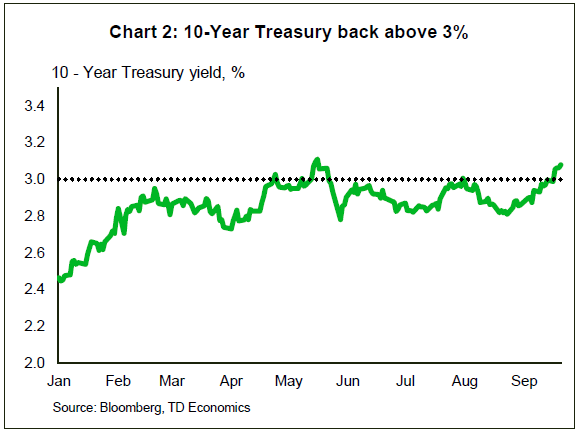
US Treasury yields have moved higher over the past couple of weeks and we have finally decisively broken the technical important 3% level in 10Y treasury yields. Given that we are not looking for any news from the FOMC this time, we see little market impact.
We continue to see modest upward pressure for 10Y US treasury yields and have a 12M forecast at 3.25%. For more, see the latest issue of Yield Outlook, 17 September.
FX: still pockets of USD strength left
With the Fed set to stay on autopilot for now, US rates are set to stay a source of USD support. This should help cement the status of the dollar as a carry currency both in terms of the level of and the change in short-end yields. With the Fed still keen to continue the process of moving rates back towards 'neutral', it remains too early in our view for the FX market to price the Fed going on hold. This should help EUR/USD revisit the 1.15 area again during the course of the autumn. But, as the ECB is set to signal a first hike coming up at a time where the Fed could be looking to go on hold, a EUR/USD uptick will start to materialise. Indeed, it is when easing stops – rather than when hikes occur - that currency appreciation is seen, and vice versa.
Week Ahead – FOMC Meeting and PCE Inflation Eyed as Dollar Loses Momentum; RBNZ also Meets
All eyes will be on the Federal Reserve policy meeting in the United States next week as markets await the central bank’s response to a firming inflation outlook and rising global trade tensions. The Reserve Bank of New Zealand will too be holding a policy meeting. But it will be a more muted week for economic data, with the main headlines likely to come from inflation and GDP releases, as many Asian markets will be closed at the start of the week for national holidays. There will be no let-up on trade, however, as President Trump turns his attention to Japan in his quest for fairer trade policies.
RBNZ may become less dovish after strong GDP growth
New Zealand’s economy grew by a better-than-expected 1.0% quarter-on-quarter in the three months to June, defying gloomy business confidence indicators. The positive numbers have eased concerns about a slowing economy and the RBNZ could remove some of its cautious language when it announces its latest policy decision on Thursday. The central bank is expected to hold its official cash rate unchanged at 1.75% for yet another meeting. But the New Zealand dollar could extend its gains beyond this week’s 3-week high if the RBNZ strikes a more upbeat tone.
Prior to the RBNZ meeting though, August trade numbers and the ANZ business confidence gauge for September will be looked at on Wednesday.
Japanese labour market to remain tight in August
The Bank of Japan pledged at its September policy meeting (the summary of which will be published on Friday) to maintain its massive monetary easing until inflation has reached 2%. The BoJ’s biggest hope in achieving its target is faster wage growth, which lately there appears to be some signs of this materializing. August data on the unemployment rate and the jobs/applicants ratio will therefore be watched closely on Friday for evidence that Japan’s labour market continues to tighten. Also relevant will be the preliminary reading of industrial output and annual retail sales numbers, both for August, due the same day.
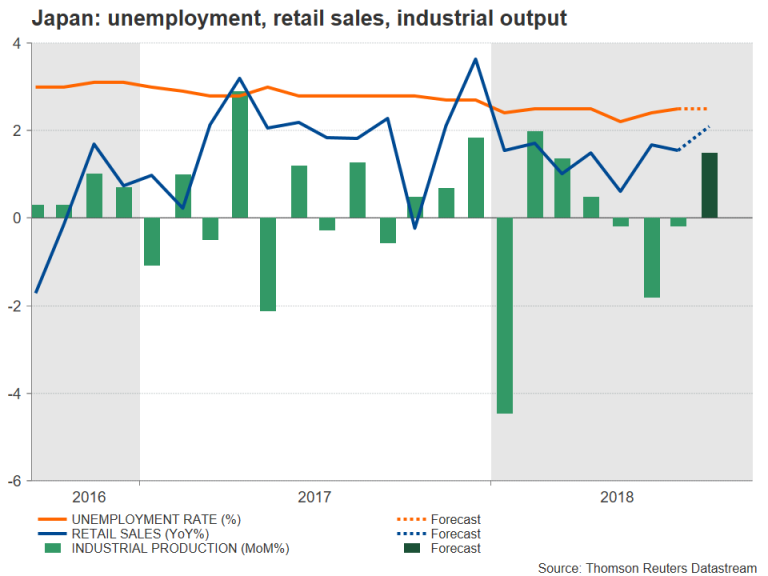
A strong set of figures would only add to speculation that the BoJ is gradually moving towards exiting from its ultra-loose monetary policy program, though the yen is more likely to see action from US-Japan trade talks scheduled for September 26. Japanese Prime Minister Shinzo Abe and US President Donald Trump will be meeting beforehand for dinner on September 23 so the headlines could begin arriving prior to the summit.
Flash inflation to show Eurozone inflation holding at 2%
The flash estimate of Eurozone inflation will be the main highlight in Europe next week, along with Germany’s Ifo survey, which will start the week on Monday. The Ifo business climate index unexpectedly rose to a 6-month high of 103.8 in August, raising hopes that German businesses are becoming less gloomy about the potential impact from the heightened trade tensions. It is projected to ease slightly in September to 103.2. There will be more business confidence data on Thursday with the release of the European Commission’s economic sentiment index. Finally, the flash CPI numbers are due on Friday. The headline rate of inflation is expected to inch up to 2.1% year-on-year in September. The core rate, which excludes volatile items, is also forecast to creep up by 0.1 percentage points to 1.1% y/y in September.
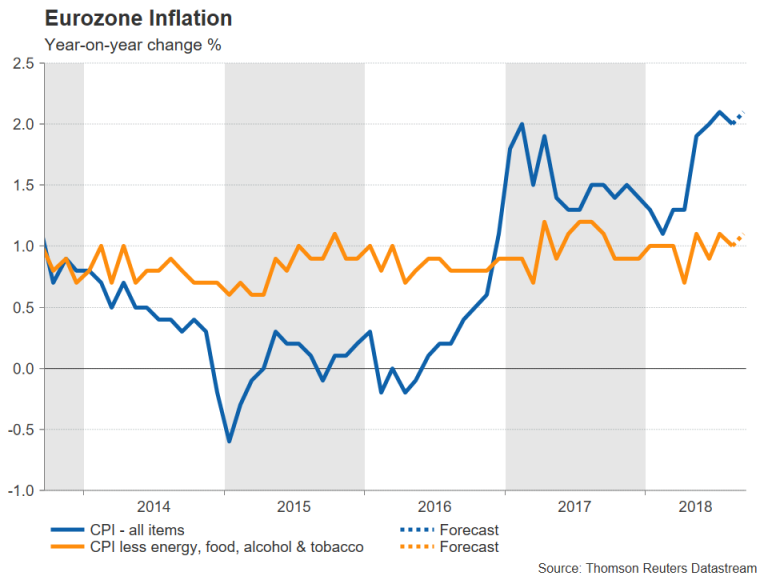
The euro surged higher during the past week despite lacklustre Eurozone PMIs as a dollar pullback helped the single currency rebound. However, there could be trouble ahead as Italy’s new coalition government will reveal its 2019 budget by September 27. The euro could reverse lower if the proposed budget deficit is sharply above levels recommended by Brussels.
Calmer days ahead for sterling?
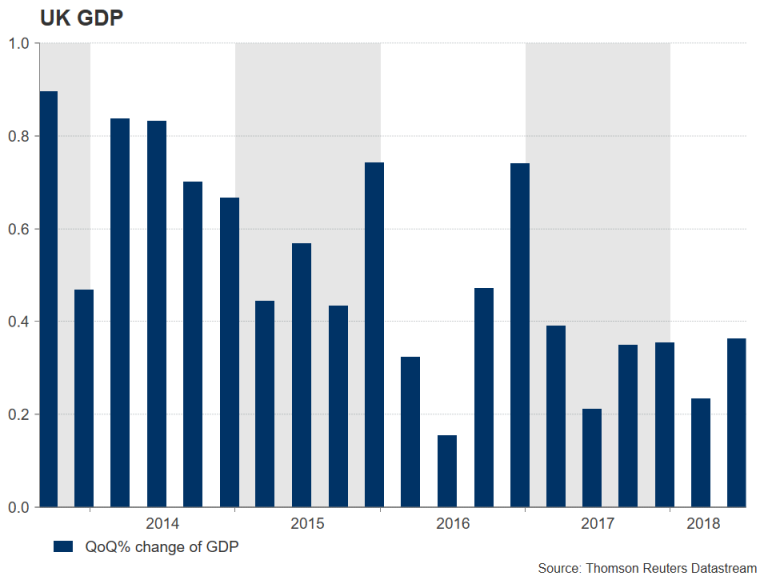
While there’s unlikely to be much respite from Brexit-related news for sterling in the run up to the October EU summit, the UK economic calendar will be very light. The only major release out of the United Kingdom will come from the second estimate of GDP growth for the second quarter. Economic growth quickened to 0.4% q/q in the second quarter, according to the initial estimate. No revision is expected in the second estimate. But in the event of a surprise upward revision, the pound could receive some support following the fresh downside pressure after EU leaders rejected Prime Minister Theresa May’s Chequers plan in Austria this week.
Loonie set for volatile week as NAFTA deadline nears
The Canadian dollar rose to a 3½-month high of C$1.2880 to the US dollar this week amid a retreat in the US currency and cautious optimism that a deal on NAFTA is within reach. However, the loonie could retrace its sharp gains over the past couple of weeks if the US and Canada fail to strike an agreement before the October 1 political deadline. Alternatively, the Canadian dollar could enjoy a strong rally if the two sides manage to conclude the overhaul of the 24-year accord.
Economic data due next week could exasperate the loonie’s moves depending on which way the talks go. Monthly GDP figures for July and August producer prices are out on Friday.
Fed to raise rates but focus on 2019 forecasts
While the Fed’s latest policy decision will be at the forefront of investors’ minds, there will also be plenty of economic indicators from the US to ensure the dollar remains in the spotlight for much of the week. The Conference Board’s consumer confidence index will be the first major data on Tuesday. The closely-monitored sentiment gauge is forecast to slip to 132.0 in September but to hold close to August’s 18-year high of 133.4. On Wednesday, new home sales for August will be watched for clues on the state of the US housing market given some recent weakness in the sector. Thursday’s August pending home sales will be the other main data point on the housing market.
Other releases on Thursday will include durable goods orders and the final estimate of GDP growth for the second quarter, as well as the advance report on the August goods trade balance. Durable goods orders are anticipated to have rebounded by 1.8% month-on-month in August after declining by 1.7% in the prior month, while no revision is expected to the final GDP estimate for the June quarter, which was revised up to 4.2% annualized growth in the second print. Wrapping up the week on Friday, will be the personal consumption expenditures (PCE) report. It’s expected to be another solid month for US personal income and spending, with consensus estimates of 0.4% m/m and 0.3% m/m growth respectively for August. Moreover, annual inflation, as measured by the core PCE price index and targeted by the Fed, is projected to hold steady at the Fed’s 2% objective in August.
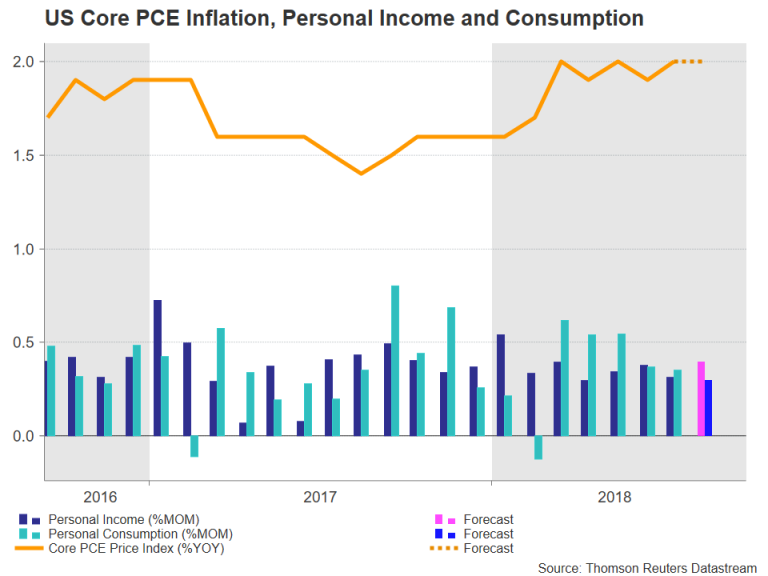
As for the Fed, the Federal Open Market Committee (FOMC) will give its latest views on the US economy on Wednesday when it concludes its two-day monetary policy meeting. A rate hike of 25 basis points to a target range of 2.00-2.25% is almost fully priced in by Fed fund futures. But the real focus will be the FOMC’s updated economic forecasts, in particular, committee members’ projections on how many times they expect to lift interest rates in 2019. In June, the FOMC’s dot plot chart pointed to three more rate rises in 2019. Any change to that forecast would likely trigger significant moves for the dollar. A downward revision is possible if FOMC members cite increased trade risks, whereas an upward revision could come if policymakers become more concerned about higher wage growth.
Weekly Focus: Italy Countdown
Market movers ahead
- In the US, we expect the Fed to hike the target range to 2.00-2.25% and PCE core inflation to rise +0.1% m/m which leaves y/y unchanged at 2.0%.
- In the trade war, we are still awaiting an official response to the US invitation for highlevel talks sent on 12 September.
- In the euro area, we expect HICP inflation to slow further to 2.01% y/y driven by lower contribution from both food and energy prices.
- In Italy, it will be very interesting to see if the budget deficit is in line with EU regulations. We expect the 2019 deficit to land somewhere between 2.0-2.4% of GDP.
- In Scandinavia, we will look for Danish business confidence, Swedish retail sales and Norwegian unemployment among others.
Global macro and market themes
- The tit-for-tat trade dispute between the US and China escalated this week.
- But the market reaction was positive, as the actions were not as bad as expected.
- Indeed, both countries pushed for lower trade barriers (with other countries).
- While it will be a long and difficult road, we think a deal will be reached.
- This may actually leave the world economy better off than before the whole trade dispute started.