Sample Category Title
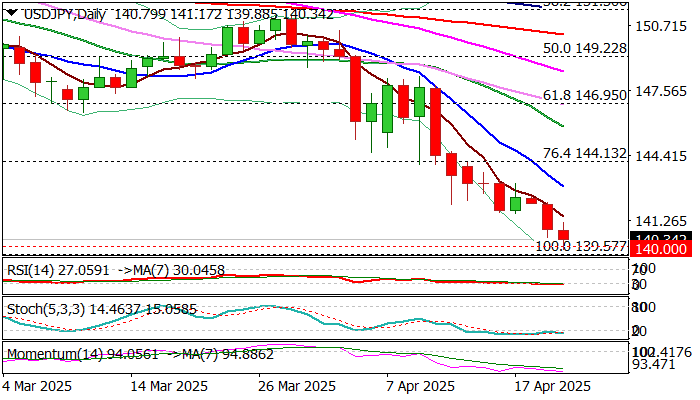
USDJPY – Bears Likely to Pause Above Key Support Zone at 140.00/139.57
USDJPY edged higher on Tuesday after bears cracked psychological 140 support and hit new multi-month low (139.88) and approached key med-term support at 139.57 (2024 low posted on Sep 16).
Partial profit taking at this zone was quite logical action which provides a breather to larger bears, to consolidate and position for final attack at 139.57 pivot.
Oversold daily studies contribute to such scenario, although upticks are likely to be limited as technical picture is very bearish and current situation is very fragile that is expected to continue to fuel risk aversion to support safe-haven yen further deflate US dollar.
Bounce was so far mild, with stronger upticks to be ideally capped under falling daily Tenkan-sen (143.84) to keep larger bears fully in play.
Clear break of 140.00 and 139.57 pivots to signal continuation of 2025 downtrend (from 158.87, Jan peak) and expose targets at 137.23 (July 2023 trough) and 135.41 (Fibo 76.4% of 127.22/161.95) in extension.
Res: 141.17; 142.12; 142.91; 143.84
Sup: 140.00; 139.57; 137.23; 135.41
Crypto Market Escapes from Fear
Market Overview
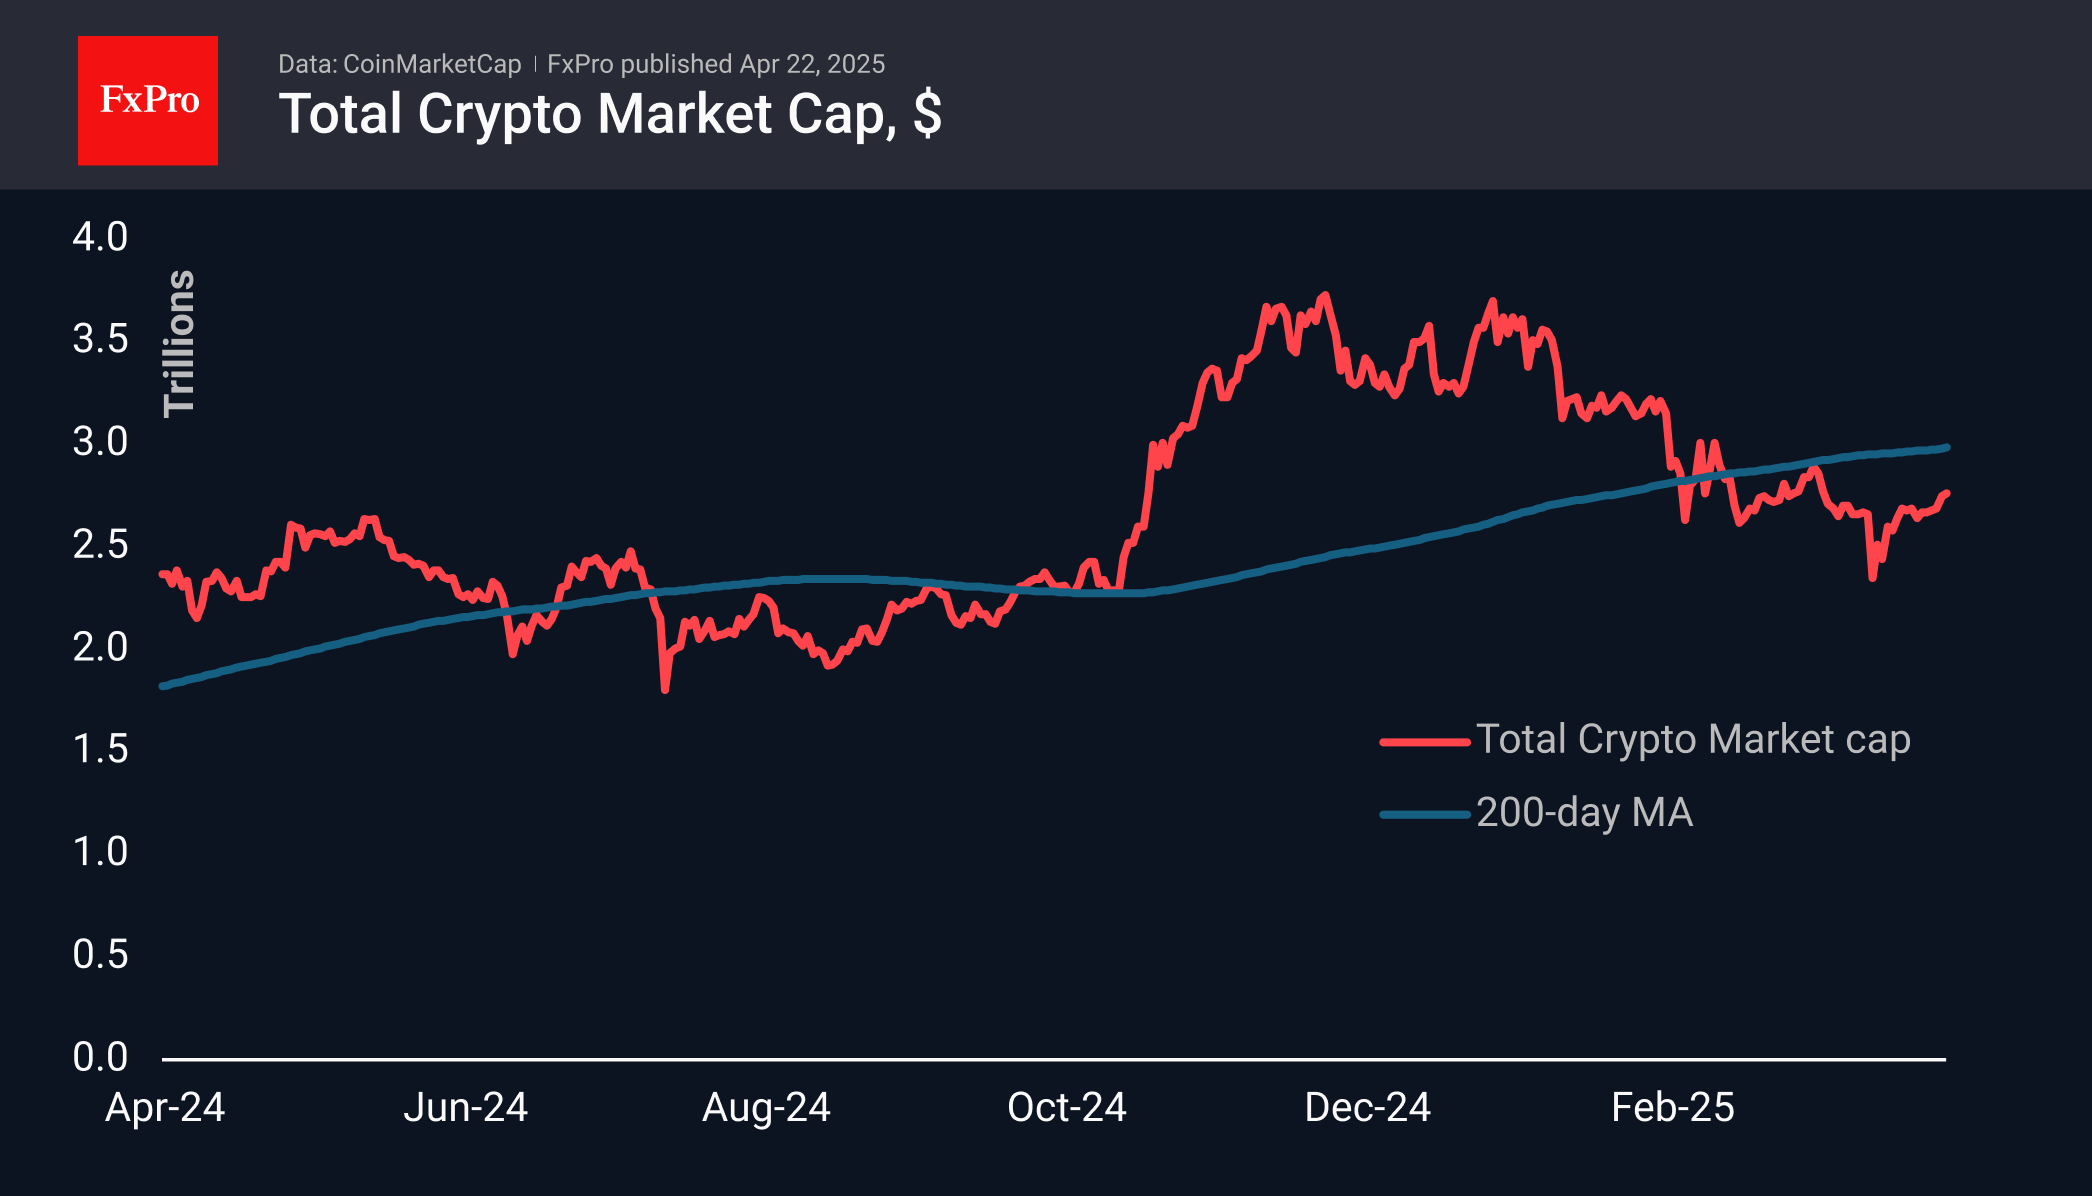
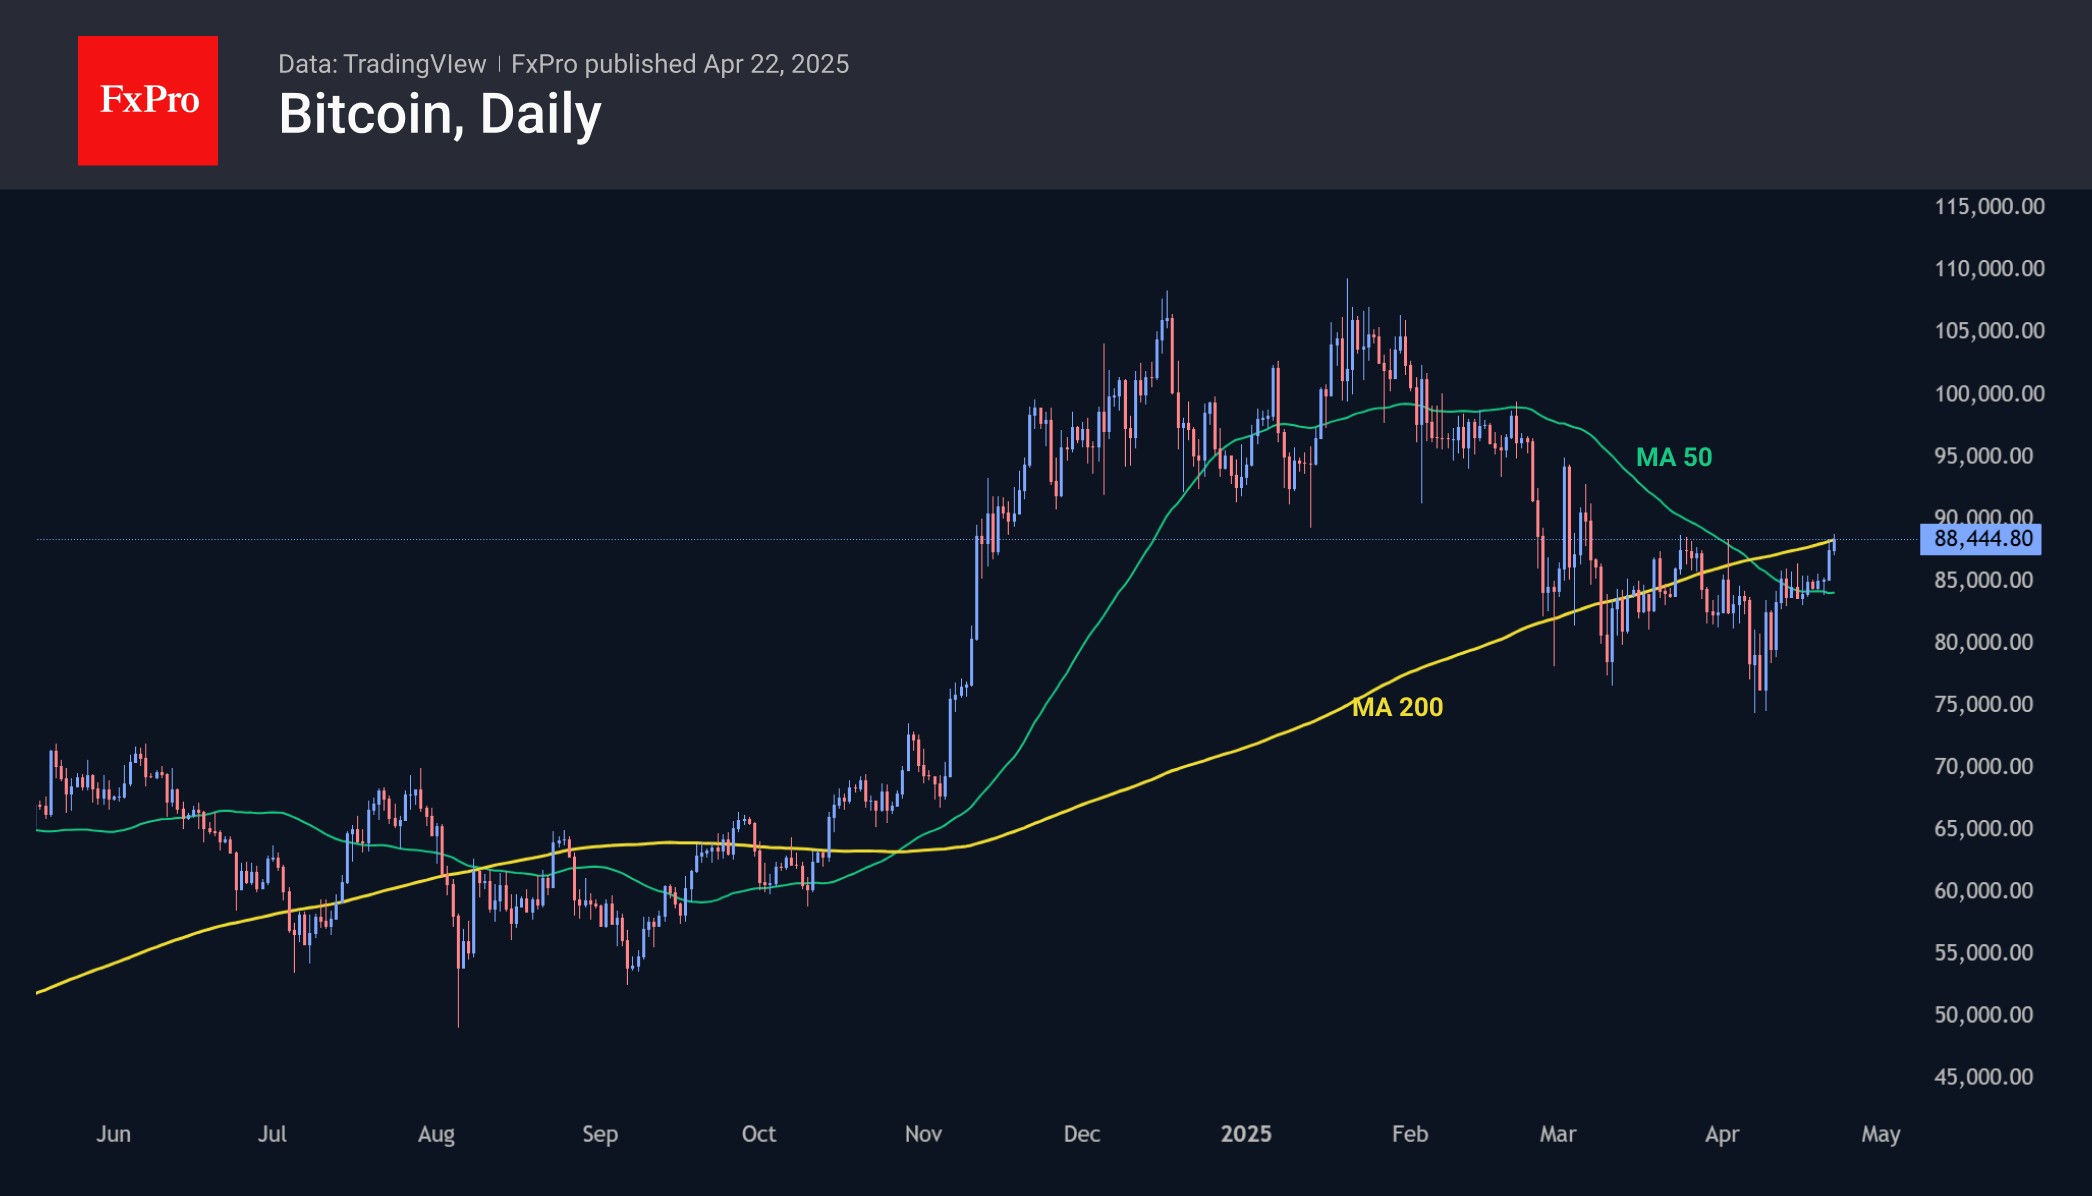
The crypto market has gained around 2% over the past seven days, with most of the increase coming at the start of this week. With a market capitalisation of $2.76 trillion, the crypto market has reached the upper boundary of its April range. For now, it can be noted that the market managed to find support at the key $2.45 trillion level—a former resistance zone last year that became the launchpad for the rally starting in November.
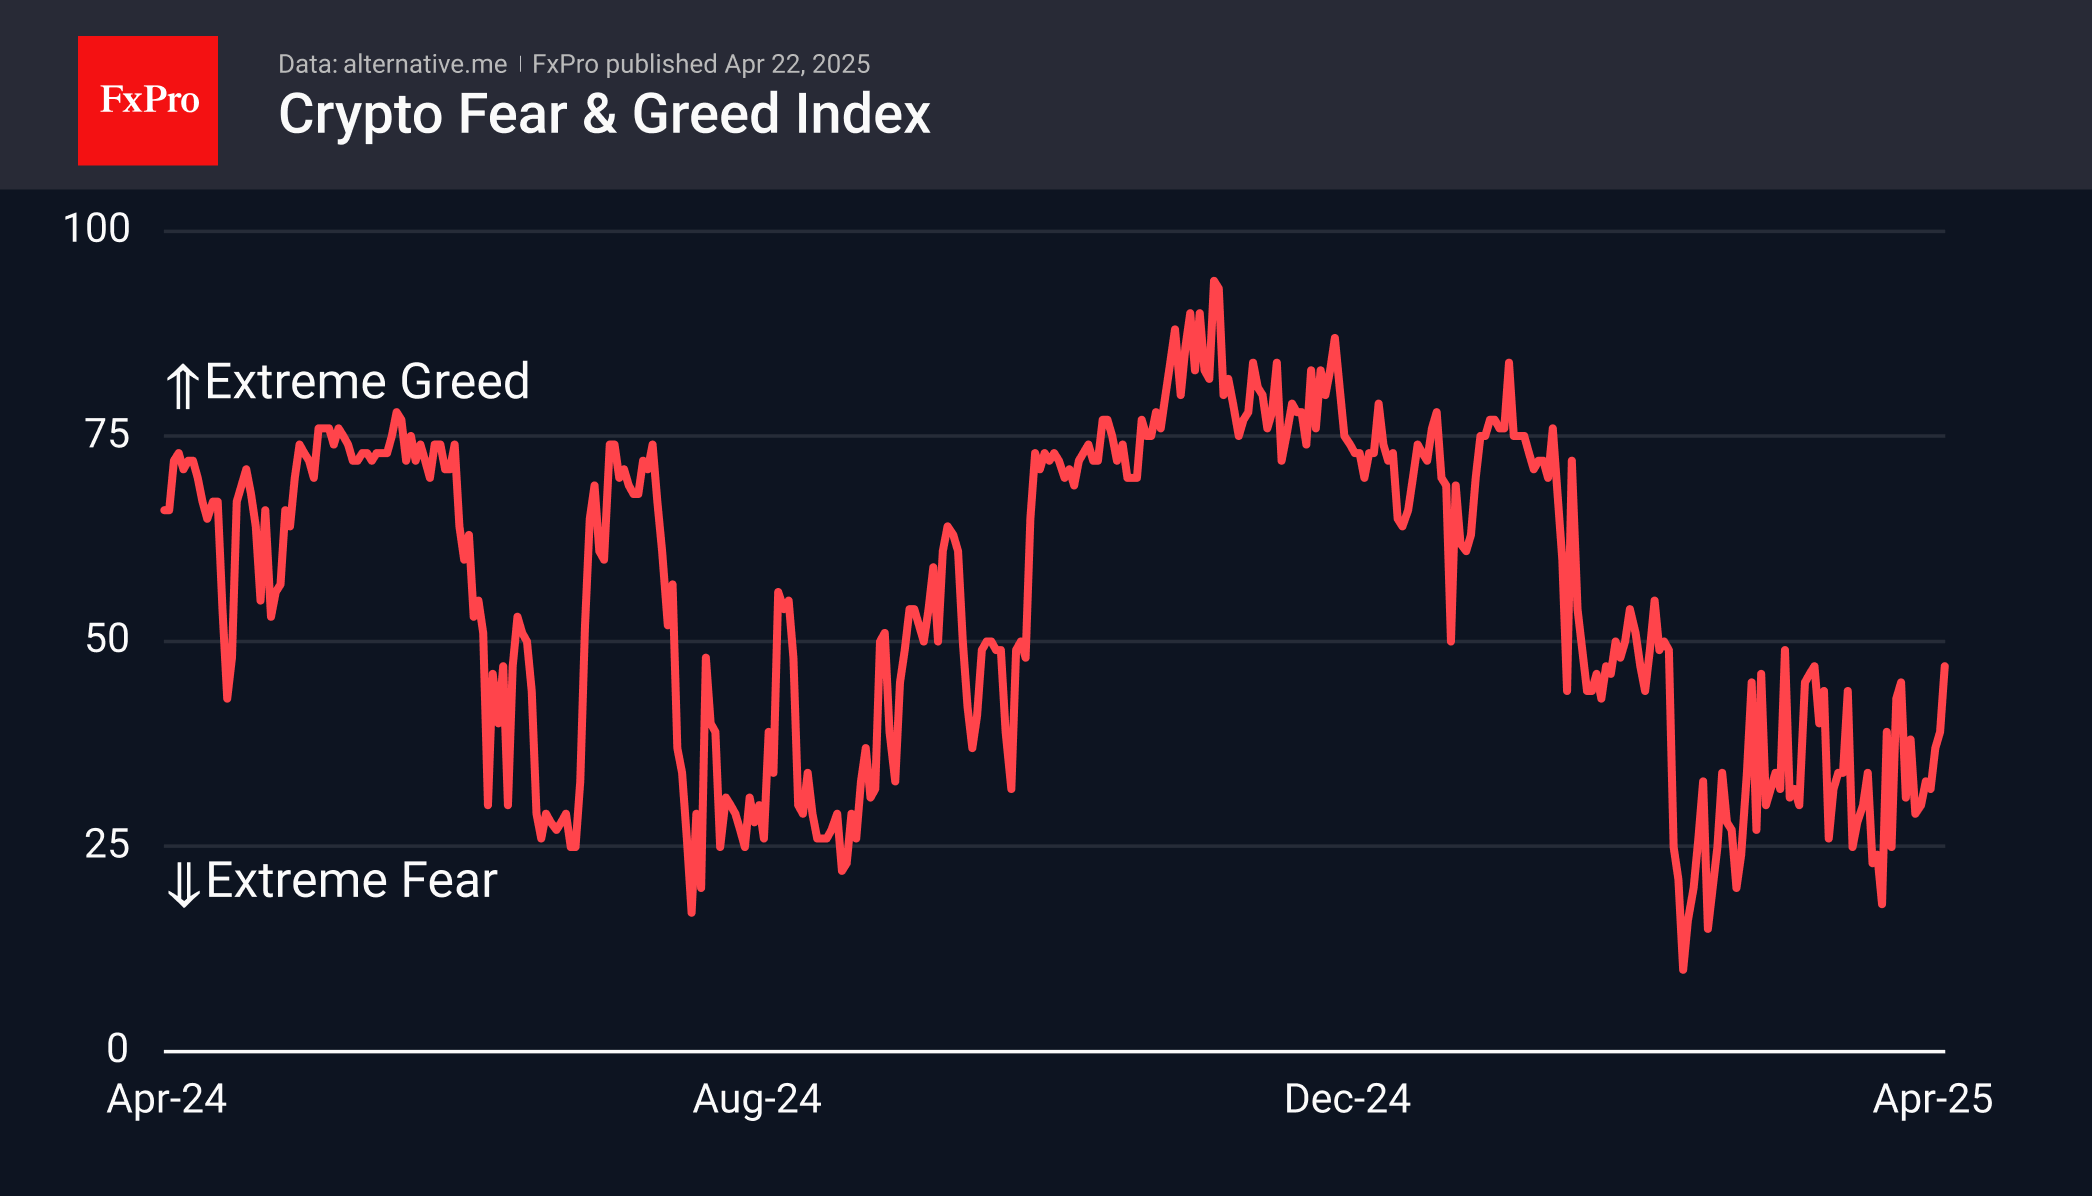
Sentiment is also recovering, with the relevant index rising to 47, matching the highs of 27 March. This marks a promising move from the fear zone into neutral territory. Such shifts are often followed by continued market strength after a pullback.
On Monday, Bitcoin rose to nearly one-month highs above $88,000, despite a decline in equity indices. BTC climbed amid a weakening dollar and gold reaching a new all-time high. The leading cryptocurrency is now testing the 200-day moving average after a prolonged struggle around the 50-day average. A breakout above this level could lead to acceleration.
News Background
Bitget Research notes that the weakening dollar and increasing correlation with gold enhance Bitcoin’s appeal as an inflation hedge and a safe-haven asset.
According to Glassnode, the number of wallets holding more than 1,000 BTC has reached a four-month high in recent months. The metric has returned to levels seen in November–December 2024, when the market was rallying following Donald Trump’s election as US President.
BitMEX co-founder Arthur Hayes stated that this may be the last opportunity to buy BTC below $100,000. In his view, the key growth driver will be the US Treasury’s buyback of government bonds, which injects additional liquidity into the market.
Japanese Yen Appreciates Too Rapidly: Speed Poses Risks
The USD/JPY pair dropped to 140.13 on Tuesday, marking yet another seven-month low.
Key Drivers Behind USD/JPY Movements
The yen’s rally is gaining momentum amid rising global trade risks. Additionally, investors are growing increasingly wary of US assets.
Last week’s tentative market optimism has now faded, with sentiment deteriorating following remarks from US President Donald Trump regarding the potential dismissal of Federal Reserve Chair Jerome Powell. Trump has expressed dissatisfaction with the Fed’s pace of decision-making, with the White House believing progress is too slow.
Domestically, Japanese investors are closely watching the upcoming Bank of Japan (BoJ) meeting on 1 May. While the key interest rate is expected to remain steady at 0.50% per annum, the central bank may revise its economic growth forecasts—prompted by mounting external risks, including the impact of US tariffs on Japanese exports.
The yen continues to perform strongly as a safe-haven asset. However, an excessively strong JPY also carries risks.
Technical Analysis: USD/JPY
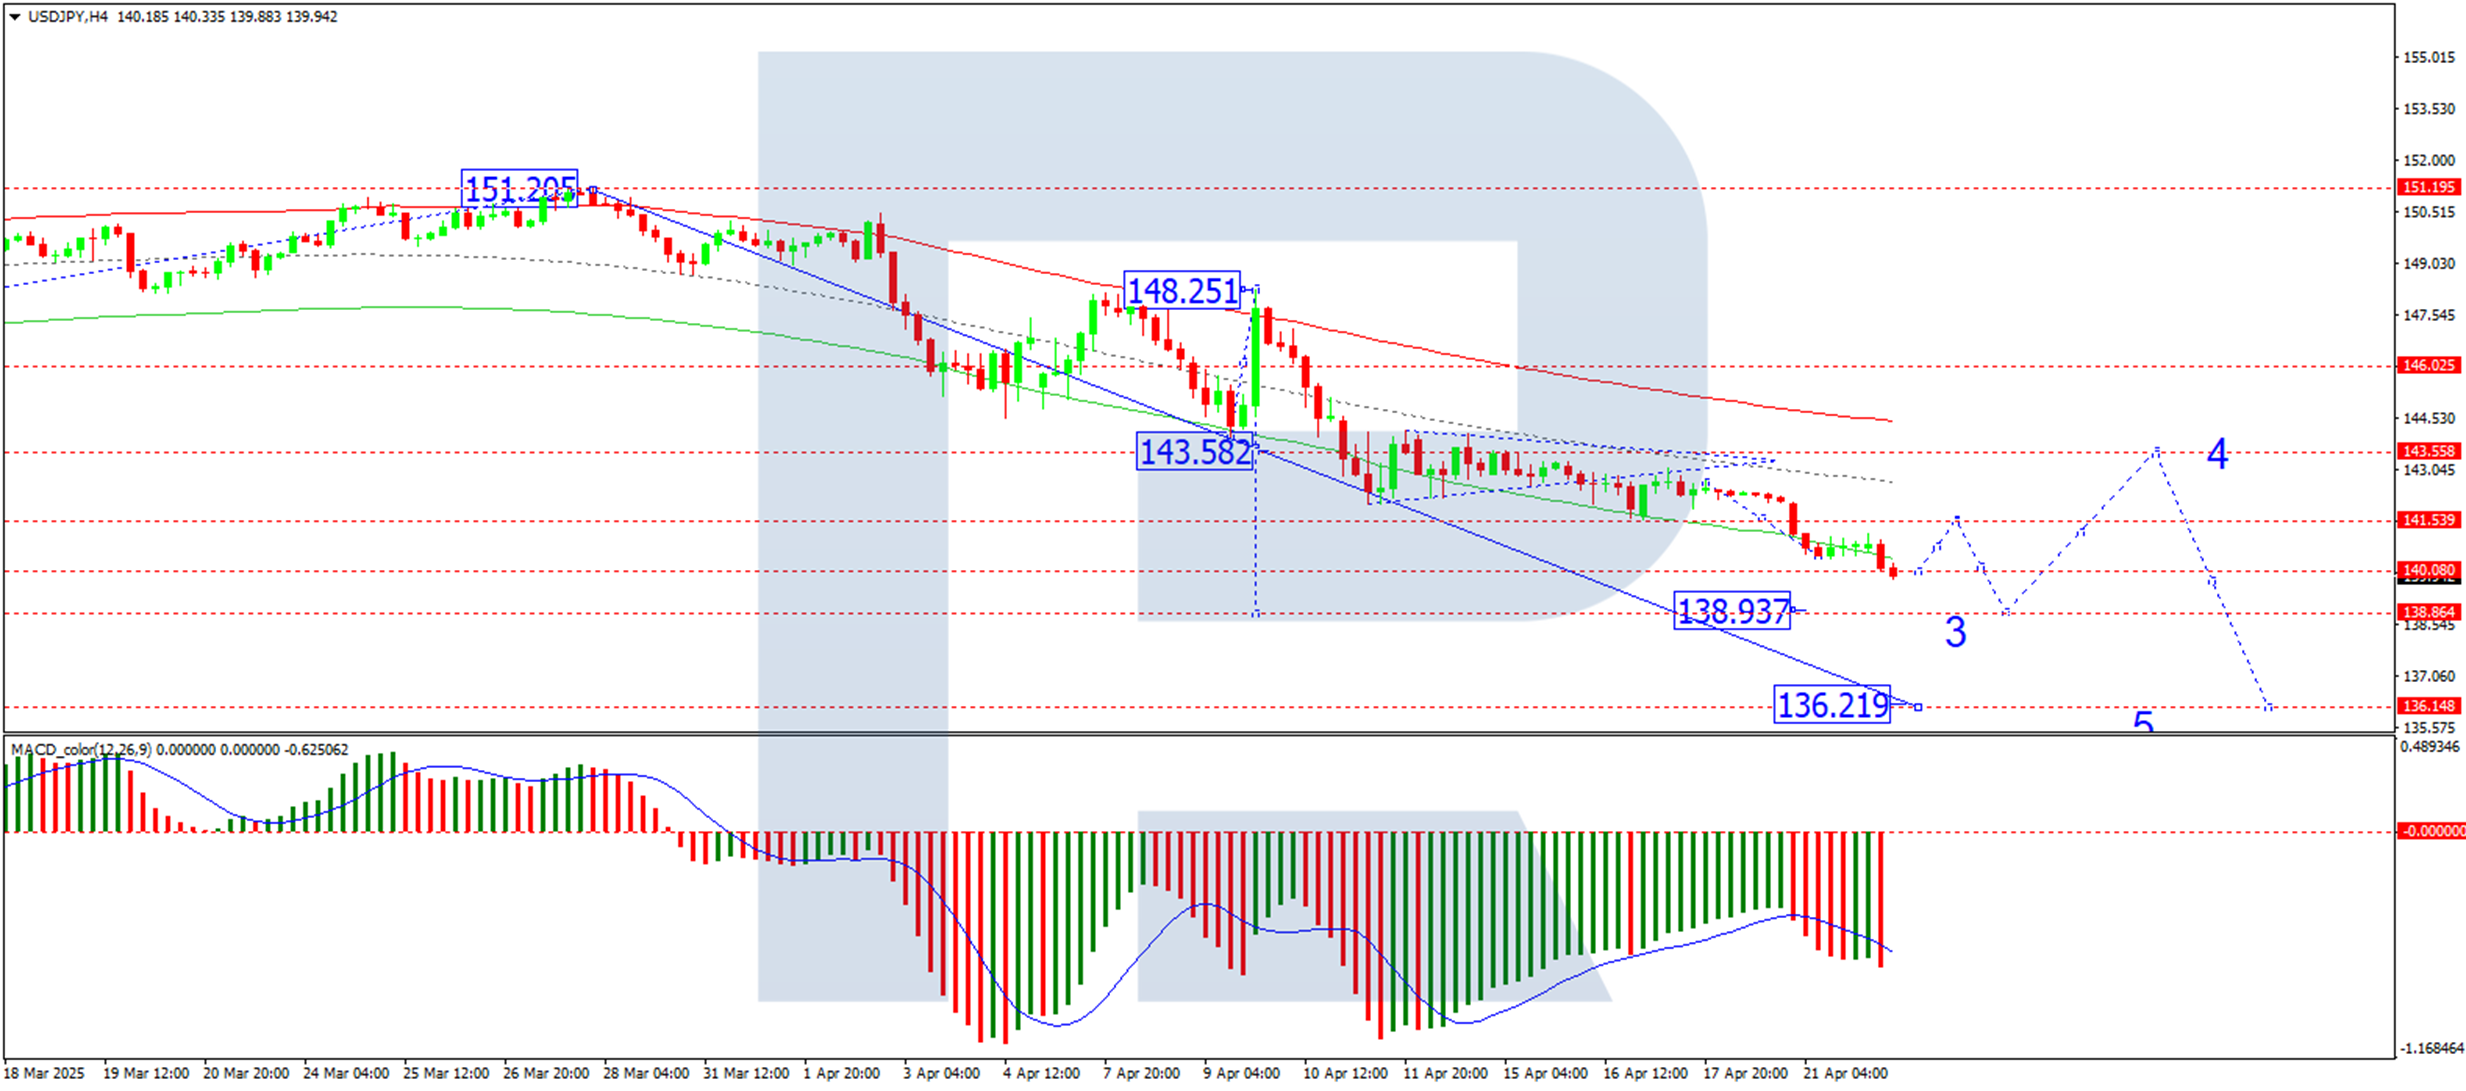
H4 Chart
On the H4 chart, USD/JPY has broken below the 141.55 level, extending its downward wave towards 138.88. This is a near-term target, and upon reaching it, a corrective rebound towards 143.55 is possible. Beyond that, further downside towards 136.22 may be considered. This scenario is supported by the MACD indicator, with its signal line firmly below zero and pointing sharply downward.
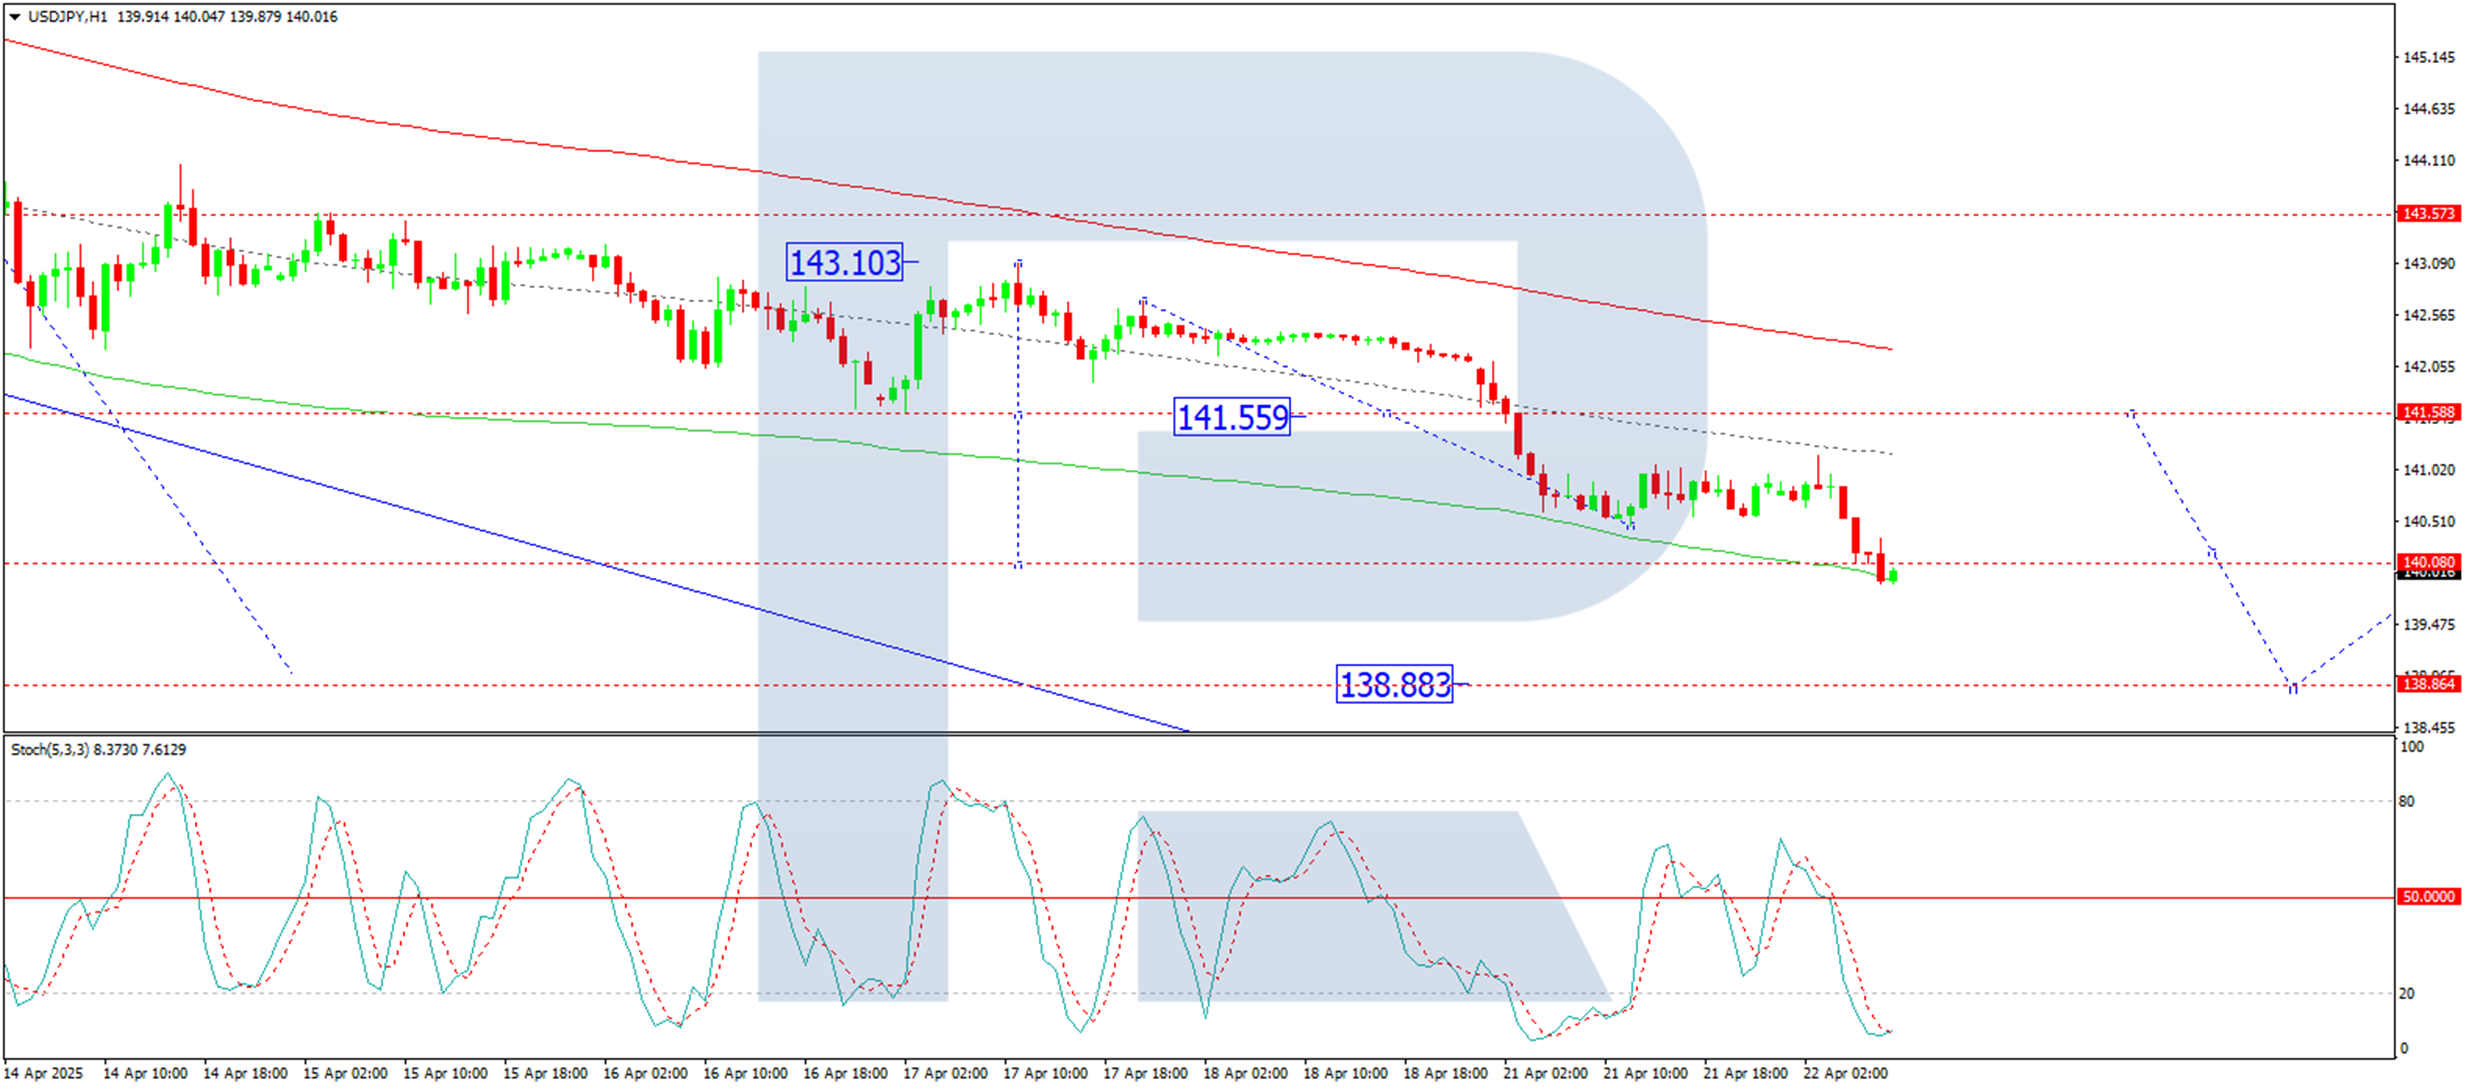
H1 Chart
On the H1 chart, the pair continues to develop the third wave of its downtrend. The immediate target of 140.00 has been met, and a temporary rebound to 141.55 (testing from below) could occur today. Subsequently, another decline towards 138.88 may follow. This outlook is corroborated by the Stochastic oscillator, whose signal line is below 20 but turning upward towards 80.
Conclusion
While the yen’s strength reflects its defensive appeal, excessive appreciation could prove detrimental. Traders should monitor both fundamental developments and technical signals for further guidance.
ECB Survey: Inflation expectations tick higher, growth outlook softens
ECB’s latest Survey of Professional Forecasters for Q2 showed a modest upward revision to inflation expectations, signaling persistent price pressures across the Eurozone.
Headline HICP inflation is now expected to average 2.2% in 2025, before easing to 2.0% in both 2026 and 2027. These figures reflect a 0.1% upward revision for 2025 and 2026. Figures for 2027 was left unchanged.
Core inflation, which excludes energy and food, was also revised slightly higher across all horizons, now projected at 2.3% (prior 2.2%) in 2025 and 2.1% (prior 2.0%) for both 2026 and 2027.
Long-term expectations for headline inflation remain anchored at 2.0%, with core inflation expectations edging up from 1.9% to 2.0%.
On the growth front, the outlook was revised slightly lower for the near term. Real GDP is expected to expand by 0.9% in 2025 and 1.2% in 2026—both down -0.1% from the prior survey—before picking up to 1.4% in 2027. Longer-term growth expectations remain unchanged at 1.3%.
EUR/USD Skyrockets Above 1.1500 as Dollar Crumbles
- EURUSD consolidates around 1.1500 after jumping to 3½-year high.
- Overbought conditions may limit further gains.
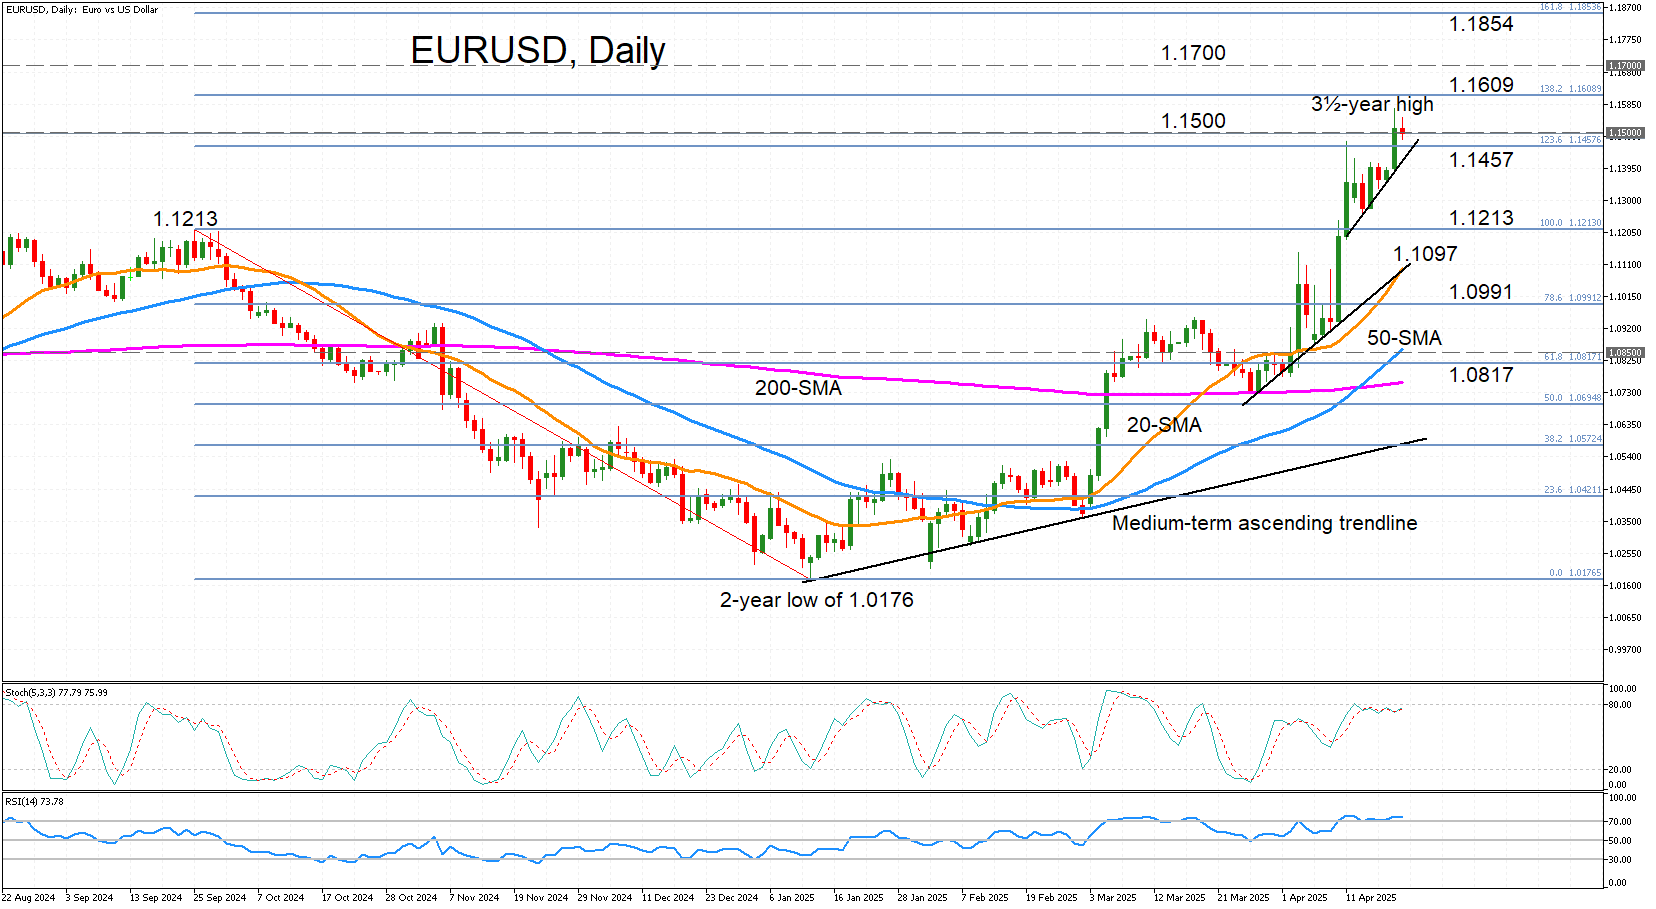
EURUSD broke another technical barrier on Monday, surging above the 1.1500 handle to hit a three-and-a-half-year peak of 1.1572 amid the ongoing selloff in the US currency. The dollar came under pressure again yesterday after US President Trump renewed his attack on Federal Reserve Chair Jerome Powell.
The pair is trading well above its medium-term ascending trendline, as well as its simple moving averages (SMA). But it’s unclear how sustainable this rally is in the short term, as the RSI has crossed above the 70 overbought level, while the stochastics are hovering right beneath the corresponding mark.
Should EURUSD continue its ascent, the next hurdle is the 138.2% Fibonacci extension of the September 2024-January 2025 downtrend at 1.1609. Not far higher is the 1.1700 handle, and after that, the main challenge is to overcome the 161.8% Fibonacci extension of 1.1854.
However, if bulls run out of breath, immediate support is likely to come from the most recent uptrend line, which is intersecting with the 123.6% Fibonacci extension of 1.1457. A drop lower would bring into scope the September 2024 peak of 1.1213, followed by the 20-day SMA at 1.1097. After that, there’s likely to be another major battle in the heavily congested 1.0850 region, which contains the 50-day SMA.
All in all, EURUSD is strongly bullish in the short- and medium-terms but the speed of the uptrend is subject to shift, with a near-term correction possible. A major test to the upside is the 1.1700 level, while to the downside, holding above the 20-day SMA will be key in maintaining momentum.
USD/JPY Analysis: Exchange Rate Falls Below 140 Yen per Dollar Today
As shown on the USD/JPY chart today, the exchange rate between the US dollar and Japanese yen has fallen below 140 yen per dollar – marking the first time this has occurred in 2025. Since the beginning of the year, the rate has dropped by approximately 11%.
Among the main driving factors is the White House's tariff policy, which has triggered a sell-off in US government bonds and a weakening of the dollar. One of the more recent developments includes the release of the Consumer Price Index report by the Bank of Japan, which revealed that the CPI remained steady at 2.2%, despite analysts (according to ForexFactory) forecasting a rise to 2.4%.
It’s possible that, due to the lack of inflationary pressure in Japan, the yen is in a relatively stronger position compared to the US currency, where concerns persist that trade wars and Trump’s push for lower interest rates may lead to a spike in inflation and a devaluation of the dollar.
Technical Analysis of the USD/JPY Chart
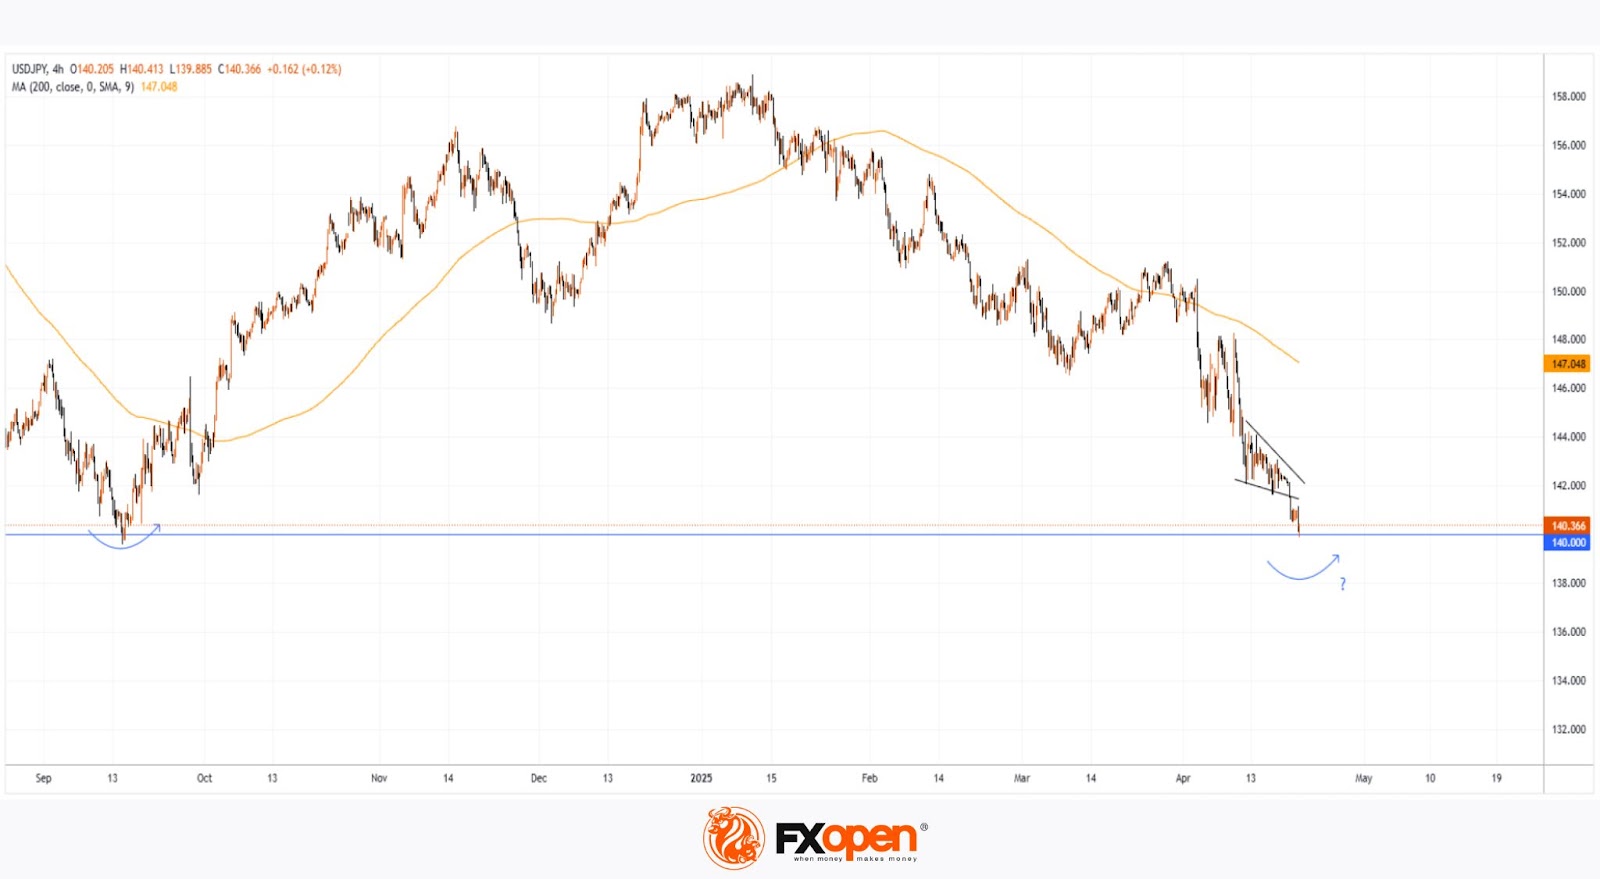
It’s worth noting that the psychological level of 140 yen per dollar has acted as key support since late 2023. On the rare occasions when the rate has dipped below this mark, the bulls have soon regained confidence, prompting a reversal.
It’s quite possible we may witness a similar attempt on the USD/JPY chart in the coming weeks or even days. However, the current outlook remains bearish, as the price has broken below the Descending Wedge pattern (marked with black lines), indicating that supply is outweighing demand.
Trade over 50 forex markets 24 hours a day with FXOpen. Take advantage of low commissions, deep liquidity, and spreads from 0.0 pips. Open your FXOpen account now or learn more about trading forex with FXOpen.
This article represents the opinion of the Companies operating under the FXOpen brand only. It is not to be construed as an offer, solicitation, or recommendation with respect to products and services provided by the Companies operating under the FXOpen brand, nor is it to be considered financial advice.
Questions Around Fed Independence and Tariffs Weigh on Sentiment, Eurozone Consumer Confidence Ahead
Asian stocks struggled on Tuesday as investors moved away from U.S. assets, weakening Wall Street and the dollar. Worries about the Federal Reserve's independence also added more stress to Treasuries.
The Dollar index was on track for a fourth day of losses as little progress in tariff negotiations continued to weigh on sentiment.
President Donald Trump’s sharp criticism of Fed Chair Jerome Powell for not lowering interest rates led to Wall Street dropping about 2.4% on Monday, with the dollar falling to its lowest level in three years.
Gold prices hit new highs due to worries about the Federal Reserve's independence. A sign of risk sentiment is reflected in oil and other risk assets which are struggling.
Currency Strength Chart, Strongest - Weakest: JPY, CAD, GBP, AUD, NZD, USD, EUR, CHF
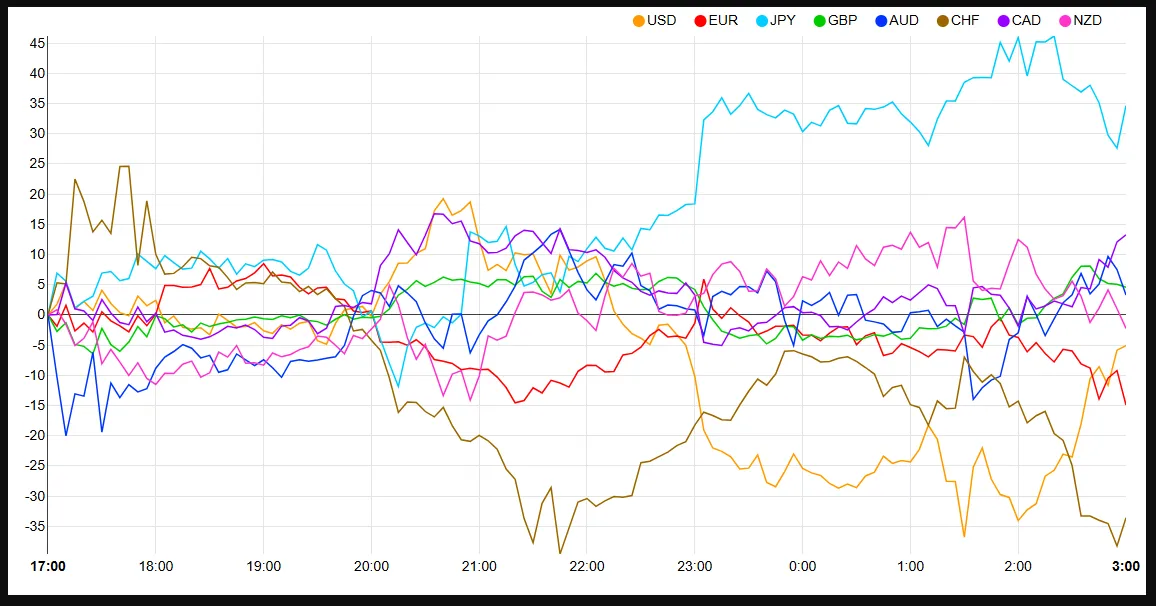
Source: FinancialJuice
Trade tensions between the US and China remain in limbo for now. Developments are slow as China's Xi Jinping warned other countries against making deals that would harm China.
A high-level Japanese team will deliver a letter from Prime Minister Ishiba to Chinese President Xi this week, showing efforts to ease tensions between the US and China.
A poll shows that Trump’s tariff campaign is already affecting Japanese companies, with about 10% saying it has impacted their business and more worried about future disruptions.
Looking at sentiment heading into the European Open and markets remain cautious. European Futures are indicating a weak open but the DAX is up 0.40% at the time of writing.
Economic data releases
From a data perspective, the major event for the European session will be the Eurozone Consumer Confidence Flash.
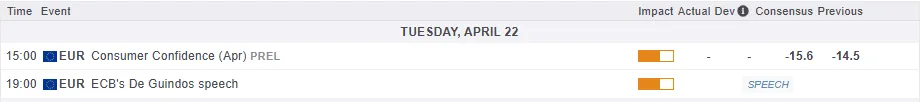
For all market-moving economic releases and events, see the MarketPulse Economic Calendar. (click to enlarge)
Chart of the day - DAX
From a technical standpoint, the DAX is back at the 200-day MA with another rejection yesterday.
The index is up in early trade but given the sentiment in play, a break of the 200-day MA may be a challenge.
However, the more times the DAX tests the 200-day MA the greater the chance of a breakthrough and a push higher.
Looking at the MAs it does appear that a death cross is developing as the 20-day MA eyes a cross below the 200-day MA.
The RSI remains below the 50 neutral level meaning that the bearish momentum remains in play.
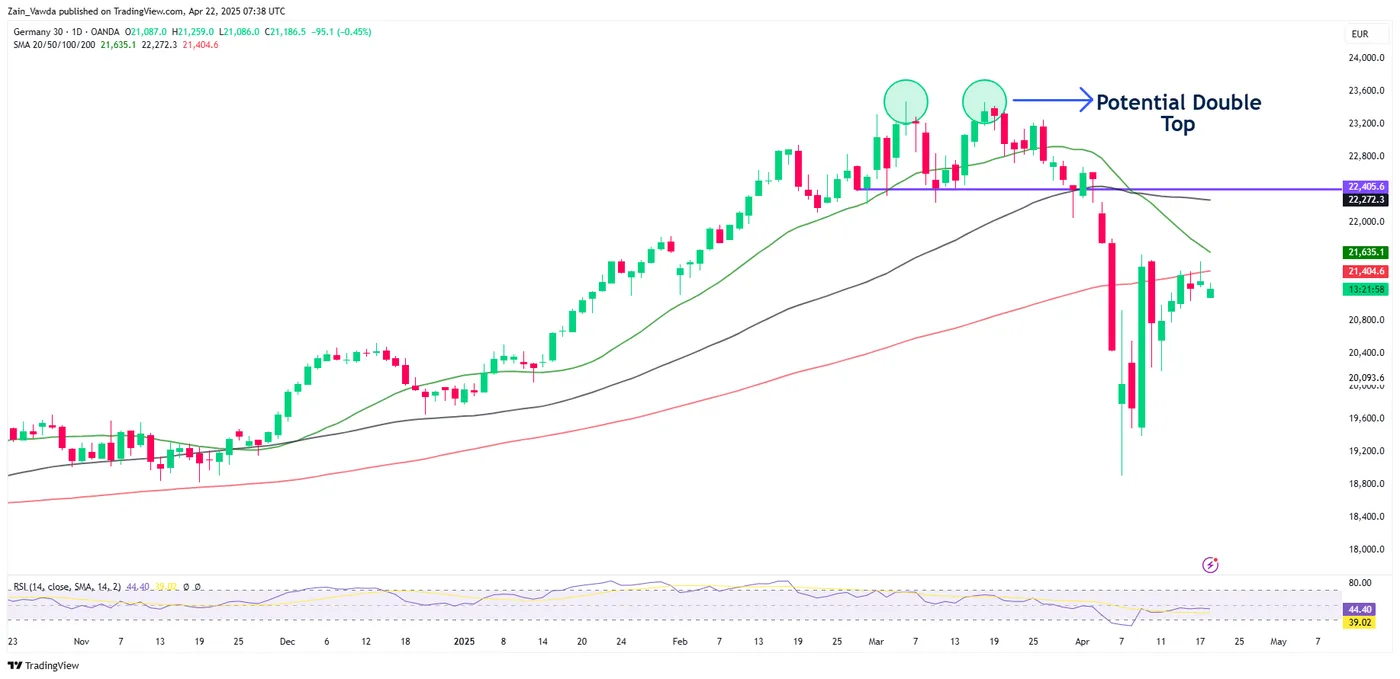
Source: TradingView.com (click to enlarge)
Support
- 21000
- 20190
- 19491
Resistance
- 21404
- 21635
- 22000
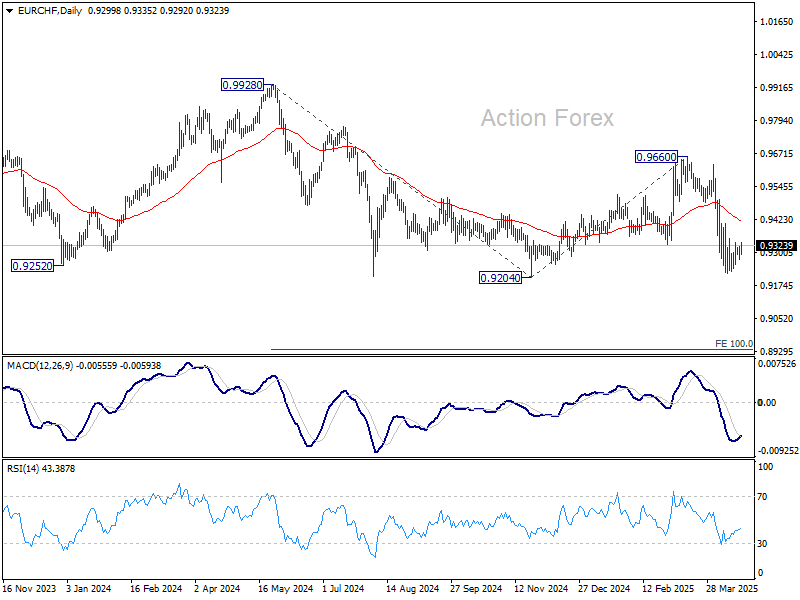
EUR/CHF Daily Outlook
Daily Pivots: (S1) 0.9283; (P) 0.9307; (R1) 0.9339; More....
Intraday bias in EUR/CHF remains neutral as consolidation continues above 0.9218 short term bottom. Outlook will remain bearish as long as 0.9408 resistance holds. On the downside, firm break of 0.9204 low will confirm larger down trend resumption.
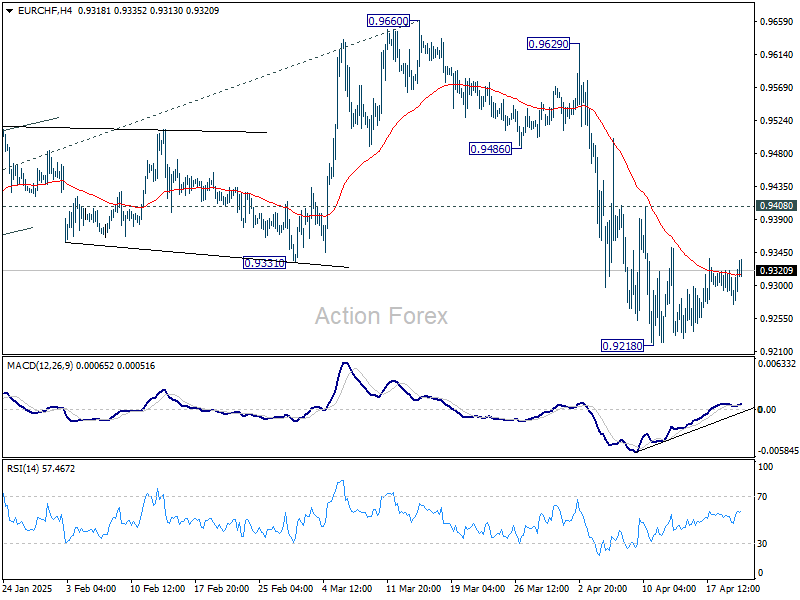
In the bigger picture, rejection by long-term falling channel resistance (now at 0.9600) retains medium term bearishness. That is, down trend from 1.2004 (2018 high) is still in progress. Firm break of 0.9204 (2024 low) will confirm resumption. Next target is 100% projection of 0.9928 to 0.9204 from 0.9660 at 0.8936.
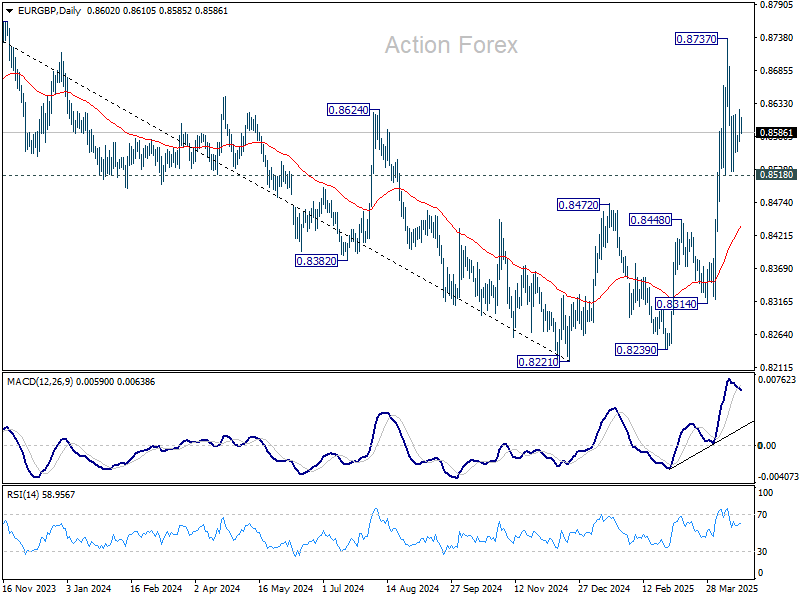
EUR/GBP Daily Outlook
Daily Pivots: (S1) 0.8580; (P) 0.8602; (R1) 0.8626; More...
EUR/GBP is staying in consolidation below 0.8737 short term top and intraday bias remains neutral. Further rise is expected as long as 0.8518 support holds. On the upside, break of 0.8737 will resume the larger rally from 0.8221. However, sustained break of 0.8518 will bring deeper fall back to 55 D EMA (now at 0.8438).
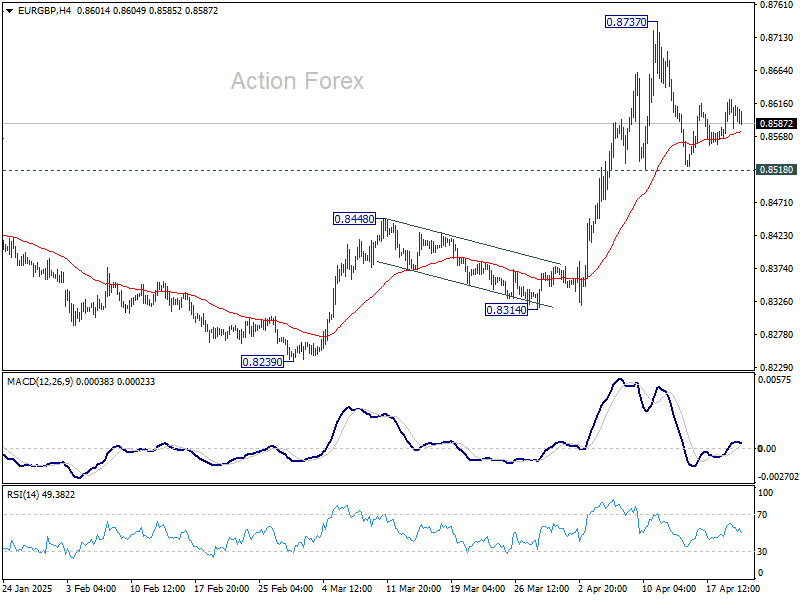
In the bigger picture, down trend from 0.9267 (2022 high) should have completed at 0.8221, just ahead of 0.9201 key support (2024 low). Rise from 0.8221 is likely reversing the whole fall. Further rise should be seen to 61.8% retracement of 0.9267 to 0.8221 at 0.8867 next. This will now remain the favored case as long as 0.8472 resistance turned support holds.
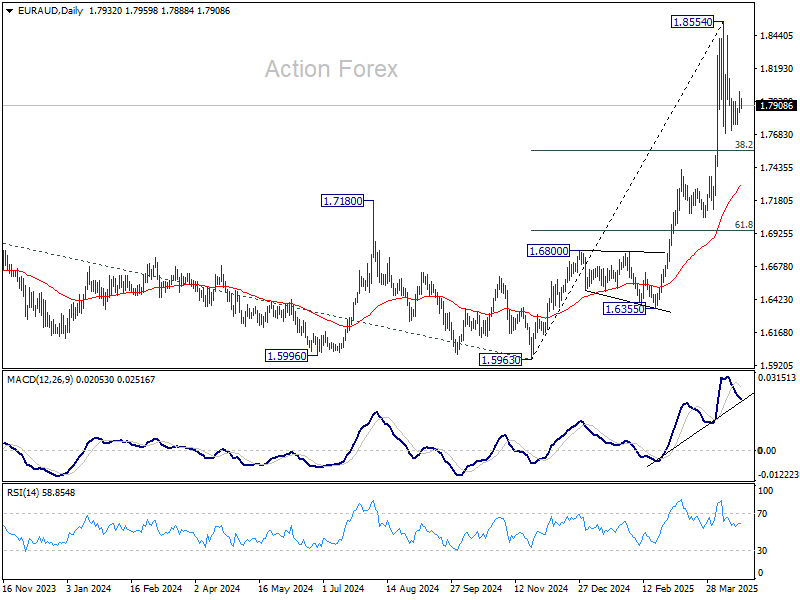
EUR/AUD Daily Outlook
Daily Pivots: (S1) 1.7870; (P) 1.7943; (R1) 1.8017; More...
Intraday bias in EUR/AUD remains neutral as consolidations continue below 1.8554 short term top. Downside of the pull back should be contained by 38.2% retracement of 1.5963 to 1.8854 at 1.7750. On the upside, firm break of 1.8554 will resume larger up trend.
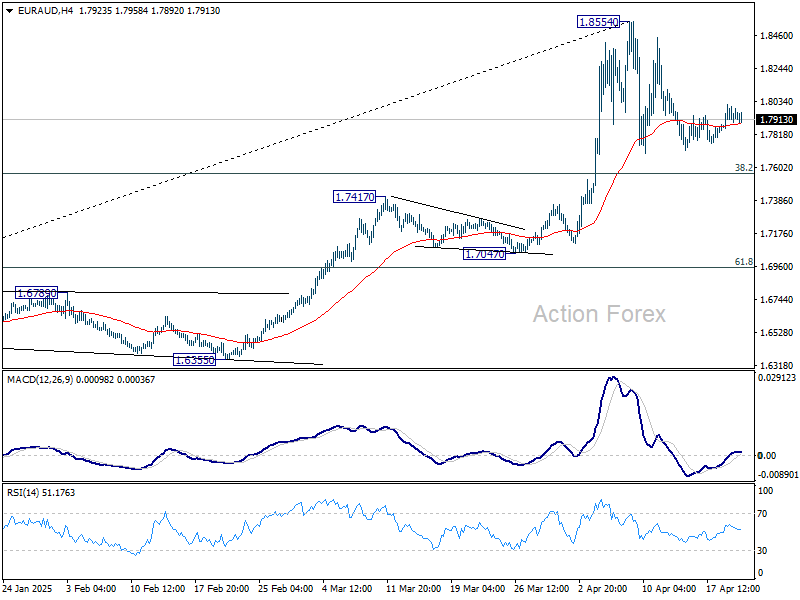
In the bigger picture, up trend from 1.4281 (2022 low) is in progress, and in reacceleration phase as seen in W MACD. Next target is 100% projection of 1.4281 to 1.7062 from 1.5963 at 1.8744. Firm break there will pave the way to 138.2% projection at 1.9806, which is close to 1.9799 (2020 high). Outlook will remain bullish as long as 1.7417 resistance turned support holds even in case of deep pullback.