
Sample Category Title
USD/CAD Daily Outlook
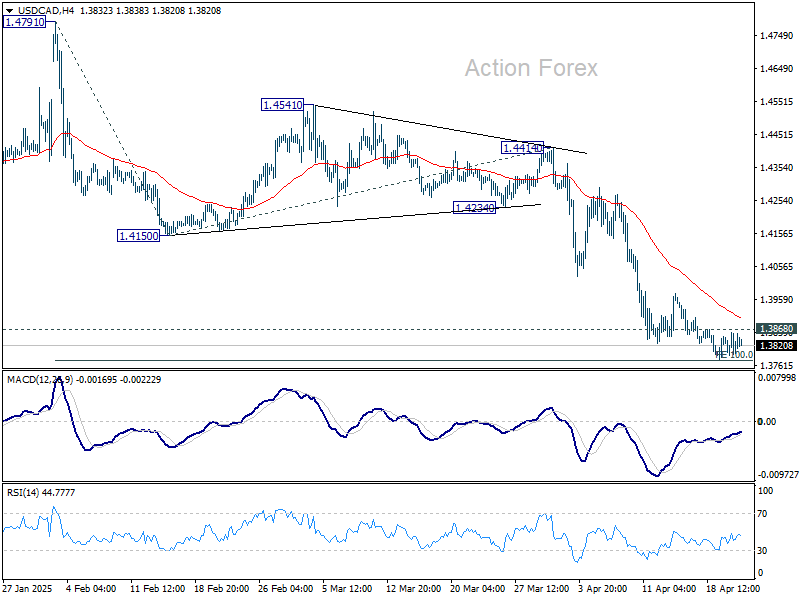
Daily Pivots: (S1) 1.3785; (P) 1.3823; (R1) 1.3854; More...
Further decline is in favor in USD/CAD with 1.3868 minor resistance intact. Firm break of 100% projection of 1.4791 to 1.4150 from 1.4414 at 1.3773 will extend the decline from 1.4791 to 138.2% projection at 1.3528. On the upside, above 1.3868 minor resistance will turn intraday bias back to the upside for stronger recovery.
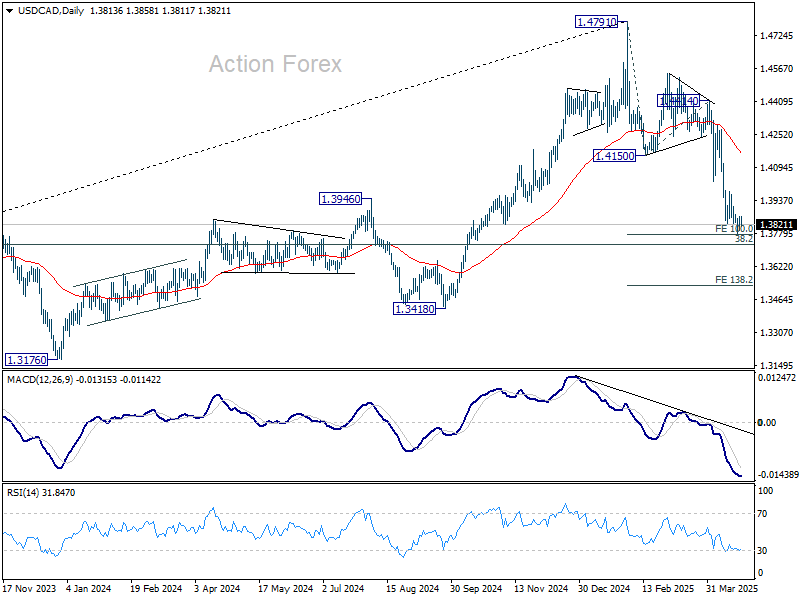
In the bigger picture, the break of 1.3976 resistance turned support (2022 high) and 55 W EMA (now at 1.3982) indicates that a medium term top is already in place at 1.4791. Fall from there would either be a correction to rise from 1.2005, or trend reversal. In either case, firm break of 38.2% retracement of 1.2005 (2021 low) to 1.4791 at 1.3727 will pave the way back to 61.8% retracement at 1.3069.
AUD/USD Daily Report
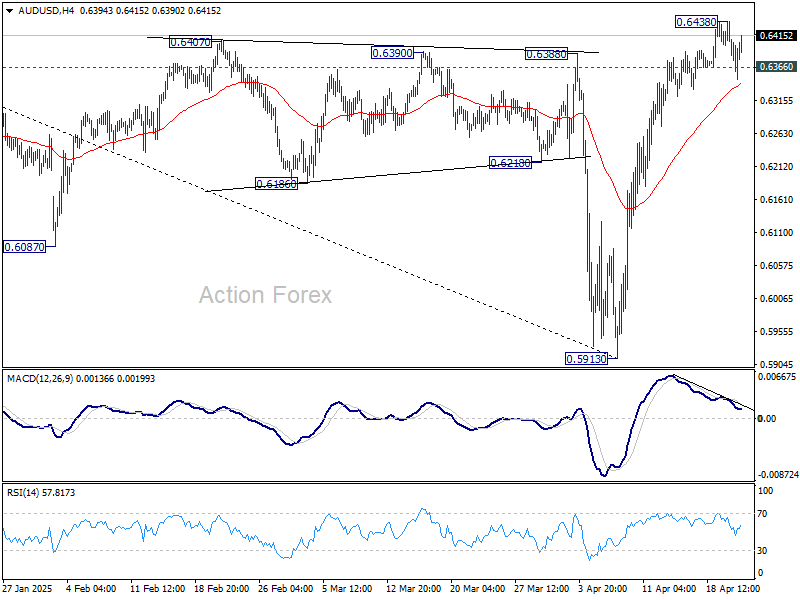
Daily Pivots: (S1) 0.6338; (P) 0.6389; (R1) 0.6416; More...
Intraday bias in AUD/USD is turned neutral first with breach of 0.6366 minor support. Some consolidations would be seen but further rally is expected as long as 55 D EMA (now at 0.6296) holds. Above 0.6438 temporary top will resume the rebound from 0.5913 to 61.8% retracement of 0.6941 to 0.5913 at 0.6548. However, sustained trading below 55 D EMA will argue that the rebound has completed and turn bias back to the downside.
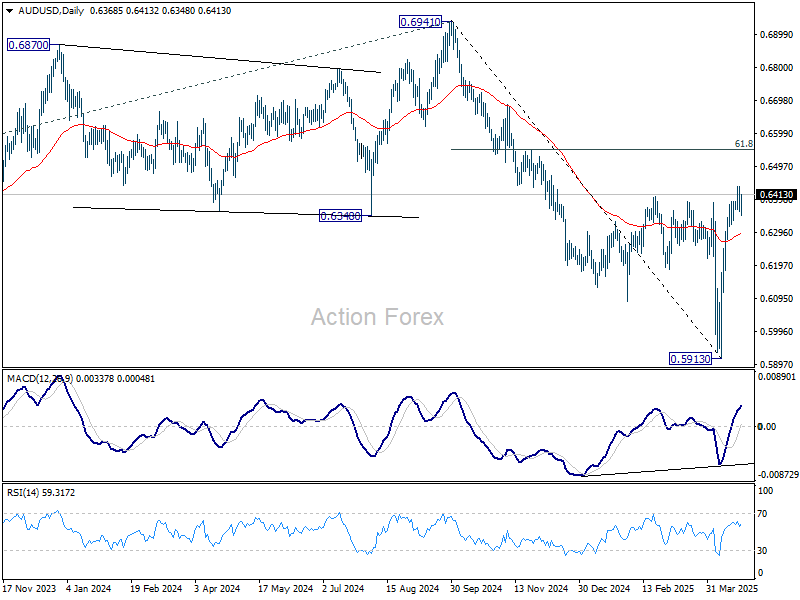
In the bigger picture, fall from 0.6941 (2024 high) is seen as part of the down trend from 0.8006 (2021 high). Next medium term target is 61.8% projection of 0.8006 to 0.6169 from 0.6941 at 0.5806. However, sustained trading above 55 W EMA (now at 0.6443) will argue that a medium term bottom was already formed, and set up further rebound to 0.6941 resistance instead.
EUR/USD Daily Outlook
Daily Pivots: (S1) 1.1377; (P) 1.1462; (R1) 1.1507; More...
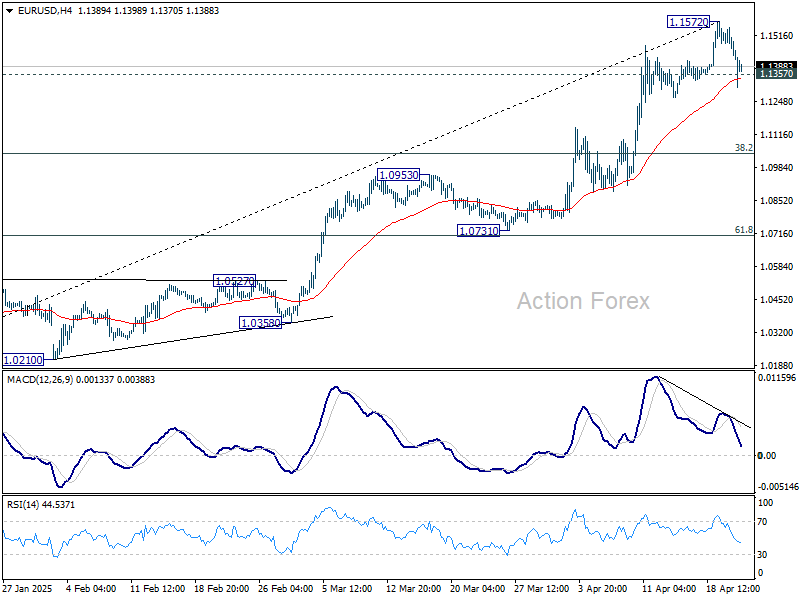
EUR/USD's breach of 11357 minor support suggests short term topping at 1.1572, on bearish divergence condition in 4H MACD. Intraday bias is back on the downside for deeper pullback. But downside should be contained by 38.2% retracement of 1.0176 to 1.1572 at 1.1039. On the upside, break of 1.1572 will resume larger up trend.
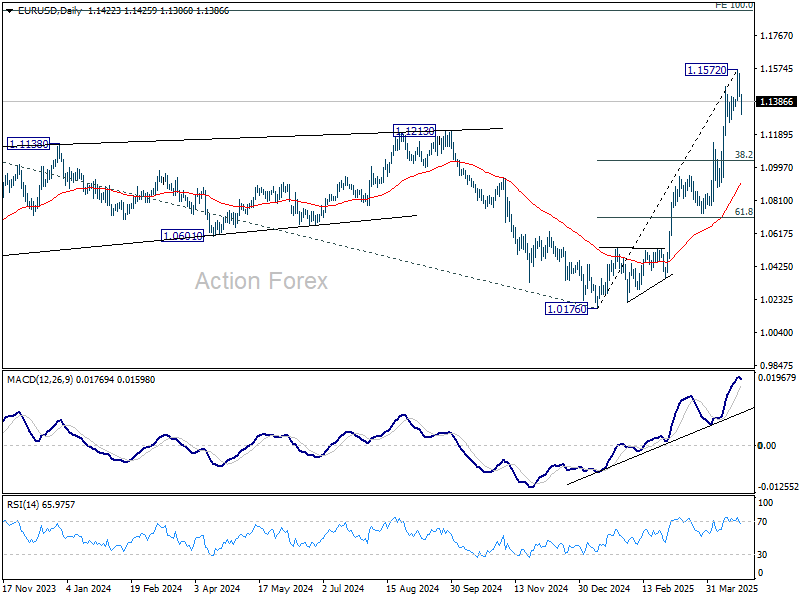
In the bigger picture, rise from 0.9534 long term bottom could be correcting the multi-decade downtrend or the start of a long term up trend. In either case, further rise should be seen to 100% projection of 0.9534 to 1.1274 from 1.0176 at 1.1916. This will now remain the favored case as long as 55 W EMA (now at 1.0776) holds.
GBP/USD Daily Outlook
Daily Pivots: (S1) 1.3298; (P) 1.3360; (R1) 1.3395; More...
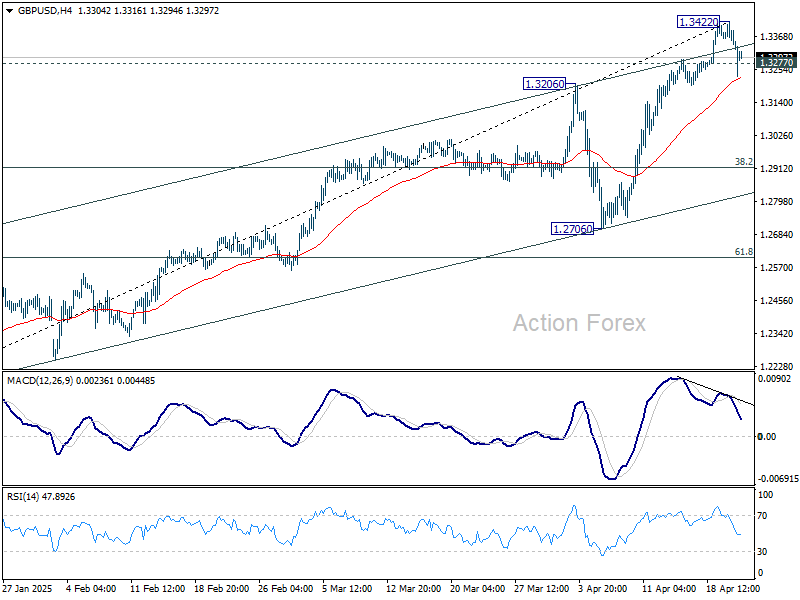
GBP/USD's breach of 1.3277 minor support suggests short term topping at 1.3422, on bearish divergence condition in 4H MACD, ahead of 1.3433 high. Intraday bias is turned to the downside for deeper pullback. But downside should be contained by 38.2% retracement of 1.2099 to 1.3422 at 1.2917. On the upside, firm break of 1.3433 will resume larger up trend.
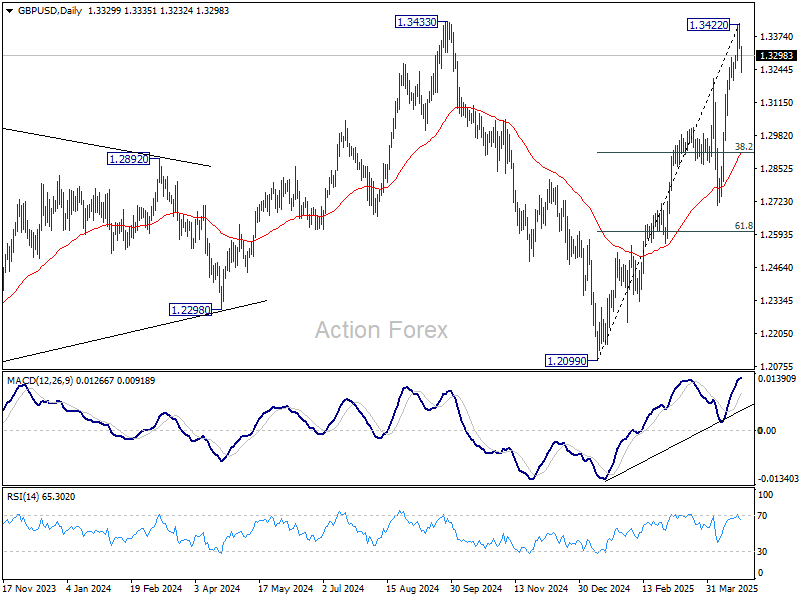
In the bigger picture, price actions from 1.3433 are seen as a corrective pattern to the up trend from 1.3051 (2022 low). Rise from 1.2099 could be the second leg. Overall, GBP/USD should target 1.4248 key resistance (2021 high) on break of 1.3433 at a later stage.
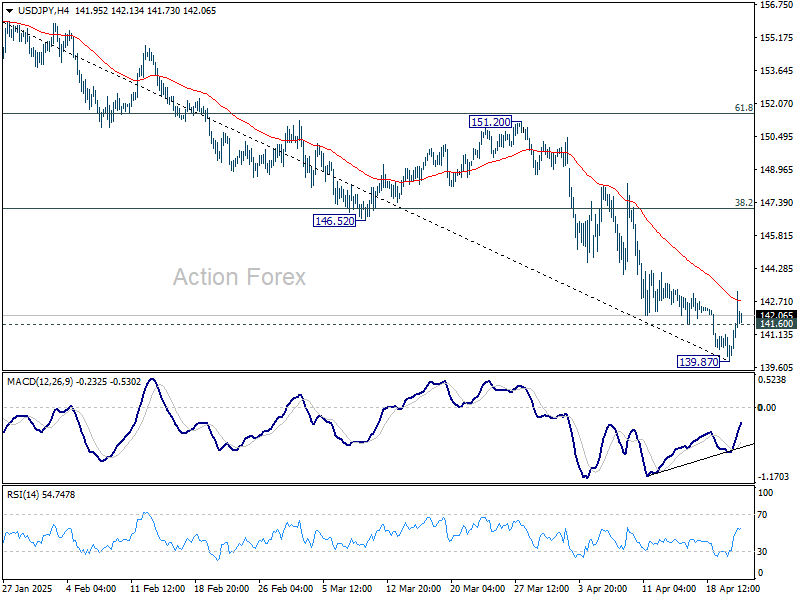
USD/JPY Daily Outlook
Daily Pivots: (S1) 140.44; (P) 141.05; (R1) 142.22; More...
USD/JPY's break of 141.60 minor resistance suggests short term bottoming at 139.87, on bullish convergence condition in 4H MACD, ahead of 139.26/57 key support zone. Intraday bias is back on the upside for stronger rebound. However, risk will stay on the downside as long as 38.2% retracement of 158.86 to 139.87 at 147.12 holds. On the downside, decisive break of 139.26 will carry larger bearish implications.
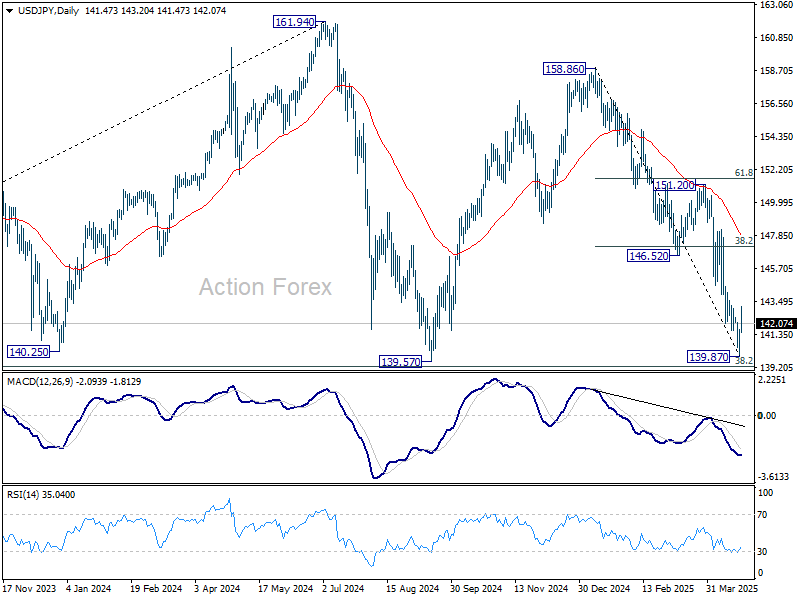
In the bigger picture, price actions from 161.94 are seen as a corrective pattern to rise from 102.58 (2021 low), with fall from 158.86 as the third leg. Strong support should be seen from 38.2% retracement of 102.58 to 161.94 at 139.26 to bring rebound. However, sustained break of 139.26 would open up deeper medium term decline to 61.8% retracement at 125.25.
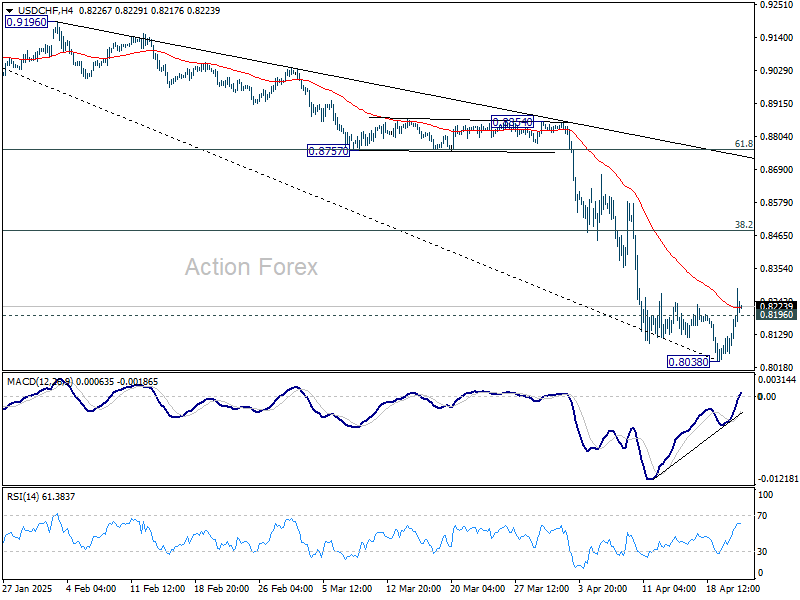
USD/CHF Daily Outlook
Daily Pivots: (S1) 0.8106; (P) 0.8149; (R1) 0.8233; More…
USD/CHF's break of 0.8196 minor resistance suggests short term bottoming at 0.8038, on bullish convergence condition in 4H MACD. Intraday bias is back on the upside for stronger recovery to 38.2% retracement of 0.9200 to 0.8038 at 0.8482. Strong resistance should be seen there to limit upside. On the downside, break of 0.8038 will resume larger down trend.
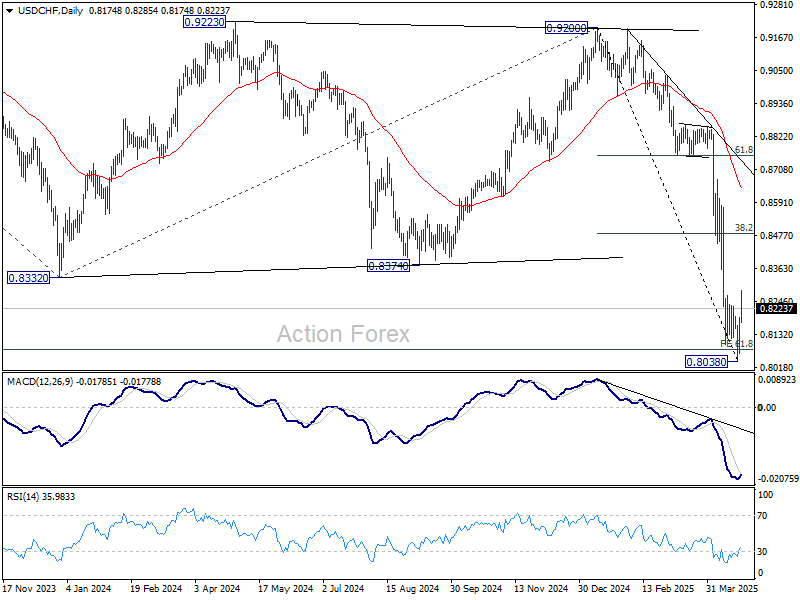
In the bigger picture, long term down trend from 1.0342 (2017 high) is still in progress and met 61.8% projection of 1.0146 (2022 high) to 0.8332 from 0.9200 at 0.8079 already. In any case, outlook will stay bearish as long as 55 W EMA (now at 0.8794) holds. Sustained break of 0.8079 will target 100% projection at 0.7382.
Markets Rebound as Trump Softens on Tariffs and Powell, Risk Sentiment Regains Ground
US stock staged a strong rebound overnight, erasing all of Monday’s steep losses as risk sentiment recovered on signs of potential de-escalation in US-China trade conflicts. The sharp reversal in equities was driven by multiple headlines suggesting a thaw in relations, including comments from US Treasury Secretary Scott Bessent and President Donald Trump that tariffs may soon come down. The recovery extended into Asian markets, with relief spreading after Trump also backed away from threats to fire Fed Chair Jerome Powell.
In a closed-door meeting with investors, Bessent reportedly said he expects “a de-escalation” in the trade standoff with China in the “very near future,” acknowledging that the current tariff regime—now as high as 145% on Chinese goods—is unsustainable. “We have an embargo now, on both sides, right?” he added, highlighting the urgency to reach a deal. Trump echoed that tone during a press conference in the Oval Office, stating that the current tariff rates “won’t be that high” and expressing optimism that an agreement with Beijing could be reached “pretty quickly.” He also pledged not to “play hardball” during the negotiations, a marked shift in tone from recent weeks.
In another positive turn for market stability, Trump publicly backed off from his threat to remove Fed Chair Powell. “No, I have no intention of firing him,” he told reporters, although he reiterated his preference for interest rate cuts. The reversal comes just days after sharp market losses partly triggered by growing concerns over Fed independence. Markets took the remarks in stride, viewing them as a sign that political pressure may ease for now, and that the central bank will retain the space to operate without further direct confrontation from the White House.
In currency markets, Swiss Franc is currently the week’s weakest performer, followed by the Euro and Sterling. On the stronger side, Kiwi leads, with Aussie and Loonie also firming. Dollar, which rebounded notably, and Japanese Yen are holding in the middle of the pack.
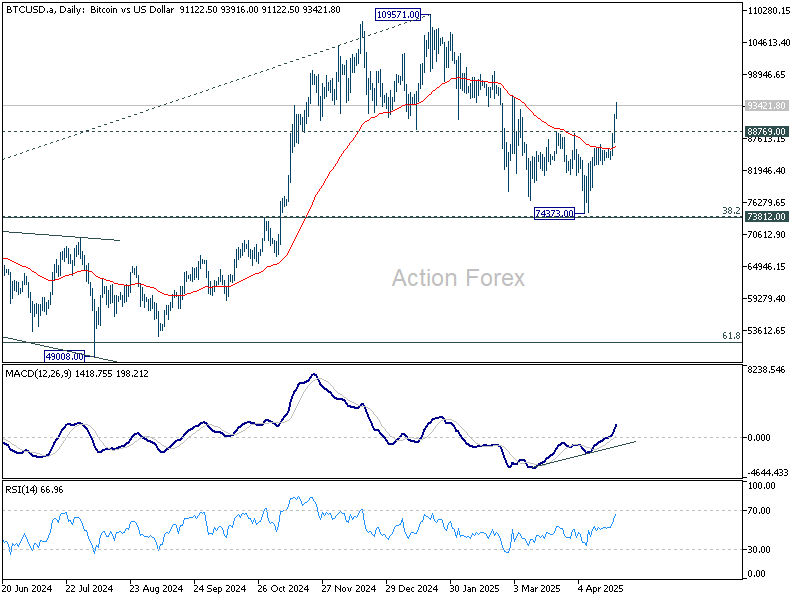
Technically, Bitcoin’s rebound from the 74,373 level gathered momentum a decisive break through 88,769 resistance. This move suggests that the correction from the 109,571 high may have already completed at the 73,812 cluster support area. While it's still early to confirm a full resumption of the long-term uptrend, the rally may signal an early return of risk-on sentiment. A retest of 109,571 peak appears likely as bullish momentum rebuilds.
Looking ahead, Eurozone will release PMI flash and trade balance. UK will also release PMI flash. Later in the day, US will release PMI flash and new home sales, as well as Fed's Beige Book economic report.
In Asia, at the time of writing, Nikkei is up 1.72%. Hong Kong HSI is up 2.61%. China Shanghai SSE is up 0.10%. Singapore Strait Times is up 1.05%. Japan 10-year JGB yield is up 0.012 at 1.324. Overnight, DOW rose 2.66%. S&P 500 rose 2.51%. NASDAQ rose 2.71%. 10-year yield fell -0.016 to 4.389.
Japan’s PMI composite rises to 51.1, service leads while manufacturing drags
Japan’s flash PMI data for April signaled a return to growth in the private sector, with Composite PMI rising from 48.9 to 51.1. The recovery was driven primarily by a rebound in the services sector, where activity rose to 52.2 from 50.0. Meanwhile, manufacturing remained in contraction, though the pace of decline eased slightly, with the PMI inching up from 48.4 to 48.5.
According to S&P Global’s Annabel Fiddes, the divergence between sectors reflected subdued factory output versus strengthening service demand.
A closer look at new business trends revealed further divergence. Manufacturers reported the sharpest drop in new orders in over a year, driven by falling foreign demand and persistent concerns over tariffs and client spending. In contrast, service providers saw their strongest rise in new work since January.
Still, inflationary pressures were strong across the board, with input costs rising at the fastest pace in two years, prompting firms to pass on those costs to customers via higher selling prices.
Overall optimism for output over the next year fell to its lowest level since August 2020, during the early phase of the COVID-19 crisis.
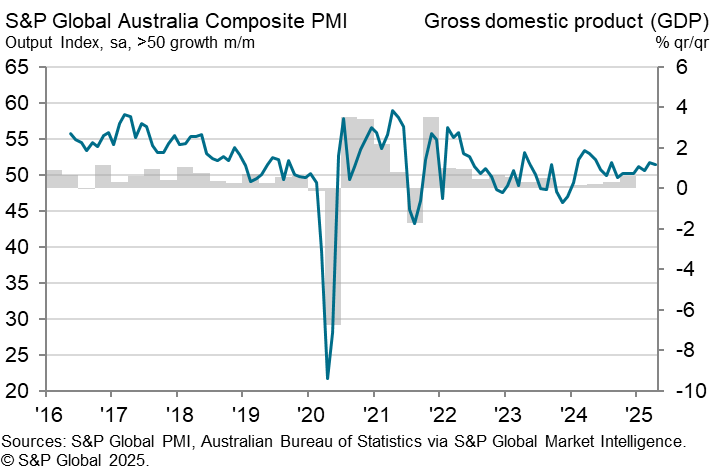
Australia’s PMI composite dips to 51.4, cost pressures emerge
Australia’s flash PMI data for April showed continued, albeit slower, expansion in the private sector, with Manufacturing PMI slipping from 52.1 to 51.7 and Services PMI easing from 51.6 to 51.4. The Composite PMI also declined slightly from 51.6 to 51.4.
Despite the modest pullback, S&P Global’s Jingyi Pan noted that domestic demand remained a "strong proponent" of business activity, supporting further job creation across sectors. The data suggests a solid start to Q2, underpinned by internal momentum, even as external headwinds mount.
However, the impact of US tariffs are starting to show. Export performance weakened, and manufacturers reported "intensification of cost pressures" due to currency fluctuations.
In response, many firms passed on higher costs to clients, pushing overall selling price inflation to a nine-month high.
Fed’s Kugler stresses caution amid tariff shock and inflation risks
Fed Governor Adriana Kugler said in a speech that she supports holding interest rates steady as long as upside inflation risks persist, provided that economic activity and employment remain stable.
Kugler noted that the current policy stance is "well positioned" to adapt to evolving macroeconomic conditions, but emphasized the need for caution given the increasing complexity of the outlook.
She highlighted a significant rise in uncertainty, pointing to a dual threat: upward pressure on inflation and downside risks to employment.
The recent escalation in tariffs, described as "significantly larger" than previously expected, has heightened concerns about both growth and price stability.
Kugler warned that "the economic effects of tariffs and the associated uncertainty are also likely to be larger than anticipated."
Fed's Kashkari warns of policy dilemma amid tariff tensions and market strains
Minneapolis Fed President Neel Kashkari said overnight that it's "too soon" to determine the future path of US interest rates. While he acknowledged that tariffs alone may not necessarily reignite persistent inflation, he emphasized that Fed cannot dismiss the risk, especially given the still-elevated price levels in recent months.
At the same time, Kashkari noted that tariffs are likely to weigh on growth, creating a policy dilemma: Fed cannot simultaneously counter rising inflation and rising unemployment without making difficult trade-offs.
Kashkari highlighted that the growing uncertainty surrounding US trade policy is compounding the challenge. While resolution could come quickly if negotiations succeed, the current lack of clarity is already deterring both consumer and business activity.
Adding to the complexity, Kashkari pointed to additional pressure from a weakening dollar and rising Treasury yields, as global investors begin to question the attractiveness of US assets.
“If we're no longer the economy that investors around the world say, hey, this is the preeminent competitive economy,” he cautioned, “then we probably have less runway.”
USD/CHF Daily Outlook
Daily Pivots: (S1) 0.8106; (P) 0.8149; (R1) 0.8233; More…
USD/CHF's break of 0.8196 minor resistance suggests short term bottoming at 0.8038, on bullish convergence condition in 4H MACD. Intraday bias is back on the upside for stronger recovery to 38.2% retracement of 0.9200 to 0.8038 at 0.8482. Strong resistance should be seen there to limit upside. On the downside, break of 0.8038 will resume larger down trend.
In the bigger picture, long term down trend from 1.0342 (2017 high) is still in progress and met 61.8% projection of 1.0146 (2022 high) to 0.8332 from 0.9200 at 0.8079 already. In any case, outlook will stay bearish as long as 55 W EMA (now at 0.8794) holds. Sustained break of 0.8079 will target 100% projection at 0.7382.
Japan’s PMI composite rises to 51.1, service leads while manufacturing drags
Japan’s flash PMI data for April signaled a return to growth in the private sector, with Composite PMI rising from 48.9 to 51.1. The recovery was driven primarily by a rebound in the services sector, where activity rose to 52.2 from 50.0. Meanwhile, manufacturing remained in contraction, though the pace of decline eased slightly, with the PMI inching up from 48.4 to 48.5.
According to S&P Global’s Annabel Fiddes, the divergence between sectors reflected subdued factory output versus strengthening service demand.
A closer look at new business trends revealed further divergence. Manufacturers reported the sharpest drop in new orders in over a year, driven by falling foreign demand and persistent concerns over tariffs and client spending. In contrast, service providers saw their strongest rise in new work since January.
Still, inflationary pressures were strong across the board, with input costs rising at the fastest pace in two years, prompting firms to pass on those costs to customers via higher selling prices.
Overall optimism for output over the next year fell to its lowest level since August 2020, during the early phase of the COVID-19 crisis.
Australia’s PMI composite dips to 51.4, cost pressures emerge
Australia’s flash PMI data for April showed continued, albeit slower, expansion in the private sector, with Manufacturing PMI slipping from 52.1 to 51.7 and Services PMI easing from 51.6 to 51.4. The Composite PMI also declined slightly from 51.6 to 51.4.
Despite the modest pullback, S&P Global’s Jingyi Pan noted that domestic demand remained a "strong proponent" of business activity, supporting further job creation across sectors. The data suggests a solid start to Q2, underpinned by internal momentum, even as external headwinds mount.
However, the impact of US tariffs are starting to show. Export performance weakened, and manufacturers reported "intensification of cost pressures" due to currency fluctuations.
In response, many firms passed on higher costs to clients, pushing overall selling price inflation to a nine-month high.
Fed’s Kugler stresses caution amid tariff shock and inflation risks
Fed Governor Adriana Kugler said in a speech that she supports holding interest rates steady as long as upside inflation risks persist, provided that economic activity and employment remain stable.
Kugler noted that the current policy stance is "well positioned" to adapt to evolving macroeconomic conditions, but emphasized the need for caution given the increasing complexity of the outlook.
She highlighted a significant rise in uncertainty, pointing to a dual threat: upward pressure on inflation and downside risks to employment.
The recent escalation in tariffs, described as "significantly larger" than previously expected, has heightened concerns about both growth and price stability.
Kugler warned that "the economic effects of tariffs and the associated uncertainty are also likely to be larger than anticipated."